FY21 WORKING BUDGET MEMO MAY 2020 - San Francisco Bay Area Rapid Transit District - BART.gov
←
→
Page content transcription
If your browser does not render page correctly, please read the page content below
FY21 WORKING BUDGET MEMO

MAY 2020
San Francisco Bay Area
Rapid Transit District

Lateefah Simon, President, Board of Directors
Robert Powers, General Manager
i
SAN FRANCISCO BAY AREA RAPID TRANSIT DISTRICT
                                   ____________________________
                                           MEMORANDUM

TO:             Board of Directors                                          DATE:      May 26, 2020

FROM:           General Manager

SUBJECT:        Fiscal Year 2021 Working Budget Discussion

The Fiscal Year 2021 (FY21) budget development process has been unlike any other at BART, as the COVID-
19 pandemic has created unprecedented challenges and uncertainty for BART and transit systems across
the world. Prior to COVID-19, staff was prepared to deliver a cost-cutting budget that prioritized efforts
to rebuild off-peak ridership, enhance the customer experience, and deliver on priority capital projects.
The uncertainty of this historic time has forced us to reimage transit service and make budgeting decisions
that consider the need to provide safe and reliable service while prioritizing the safety of our employees
and riders and allow for social distancing.

The Bay Area and California have been at the forefront of the nation’s response to this crisis. State and
local elected leaders rose to the occasion in March to limit the spread of the coronavirus by issuing some
of the first stay-at-home orders in the country. Those decisions along with the actions of millions of people
in the Bay Area have helped to flatten the curve of infection to save lives and preserve our health care
system. However, the impact on public transportation ridership has been dramatic. For BART that has
meant a ridership decline of 94% to fewer than 25,000 trips per day, critically impacting BART’s bottom
line since fare revenues fund about 60% of operations.

Swift advocacy for emergency funding helped stabilize the budget and recover costs associated with
increased cleaning and purchasing of personal protective equipment. The Bay Area Congressional
Delegation, led by Speaker of the House Nancy Pelosi, helped to secure the historic $2 trillion federal
CARES Act relief package. In April, the Metropolitan Transportation Commission (MTC) approved
providing BART with $251.6 million (M) in federal CARES Act funding. The allocation is the first installment
of the $1.3 billion in support provided to Bay Area transit operators in response to the COVID-19
pandemic.

The FY21 Working Budget uses the federal emergency funding for its intended use to run service and avoid
transit worker lay-offs. BART is working with the MTC on future installments of CARES funds while
continuing to advocate for additional state and federal support. The hope is this aid will help BART to
weather the worst of the pandemic but there is much more work to be done.

Putting Riders First
While the District will continue to face financial difficulties in the months and years ahead, BART will play
a role in the region’s recovery. We must approach our service and budget planning in a way that allows
us to easily scale up when demand begins to grow again. We need to remain nimble and quickly adapt to
the changing needs of riders looking for assurance that public transit is a safe commute option as stay-at-
home orders are eased. We must also meet our obligation to transit dependent riders, seniors, people
with disabilities, and low-income communities who rely on BART to get to work and for other essential
travel needs. Finally, the FY21 Working Budget continues our commitment to implement our new Chief
of Police’s Vision for Safety and addressing rider concerns about quality of life issues.

                                                                                                                ii
Serving the Region in a Crisis, Planning for Uncertainty
It is not clear when the Bay Area’s stay-at-home orders will be fully eased. The COVID-19 pandemic has
already triggered a global economic slowdown that has begun a deep recession in California. A reduction
in economic activity combined with the continued prioritization of social distancing and an increase in
telecommuting could have a significant impact on BART’s ridership and revenue for not just months, but
years. BART funding sources such as fares as well as sales and gas taxes will all drop sharply. These
projected revenue reductions could reach $600M in just FY20 and FY21 alone. While the outlook beyond
FY21 is even more uncertain, BART is preparing for a future in which operating revenue could be well
below prior expectations for multiple years. Even as revenue has collapsed, responding to the pandemic
has created new demands on resources. These resource constraints have driven the budget process,
forcing difficult decisions around expenditure levels, with more difficult decisions to come. Despite these
challenges, BART continues to move forward, most notably by expanding into a fifth Bay Area county with
the inauguration of the Silicon Valley Berryessa Extension (SVBX) service on June 13 th with two new
stations and 10 miles of track.
Budget Cuts
Prior to the COVID-19 pandemic, staff had identified approximately $17M in budget cuts and redirection
of resources to address projected budget shortfalls. The FY21 budget of $915M is nominally $32M lower
than in FY20 but includes significant increases in expense due to SVBX and COVID-19 expenditures. Staff
cut $150M in planned expenditures to balance the FY21 budget. Reductions were made by inactivating
vacant positions, reducing non-labor expenses, and scaling back operating allocations, which primarily
fund capital projects. As we learn more about ridership, the economy, and public health guidance over
the course of FY21, additional cuts may be necessary. We expect an extremely constrained financial
outlook for many years.
Continuing System Reinvestment
Before the pandemic took hold, there were more rebuilding projects happening in the BART system than
at any point in the District’s history. There was a total of 135 projects underway across BART’s 48 stations
and 122 route miles of track. The reduction in service hours in response to COVID-19 created an
opportunity to accelerate several critical rebuilding projects. A priority was placed on projects based on
how critical they are to the core mission of providing reliable train service. The additional wrench time is
boosting productivity dramatically and will allow for completion of many projects ahead of schedule.
Despite the difficult choices made around this budget, we believe it provides the service levels and safety
provisions necessary to meet the needs of our riders and the Bay Area as a whole.
_________________________
Robert Powers
cc: Board Appointed Officers
Deputy General Manager
Executive Staff
iiiCONTENTS
1. OVERVIEW .........................................................................................................................................6
1.1. COVID-19 PANDEMIC................................................................................................................ 6
1.2. EMERGENCY FUNDING SOURCES............................................................................................. 7
1.3. CAPITAL INVESTMENT .............................................................................................................. 7
1.4. QUALITY OF LIFE ON BART AND RIDER SAFETY...................................................................... 10
1.5. FY21 WORKING BUDGET ........................................................................................................ 11
2. FY21 DEFICIT REDUCTIONS ..............................................................................................................12
2.1. POSITION SAVINGS ................................................................................................................. 12
2.2. NON-LABOR REDUCTIONS ...................................................................................................... 13
2.3. ALLOCATIONS ......................................................................................................................... 13
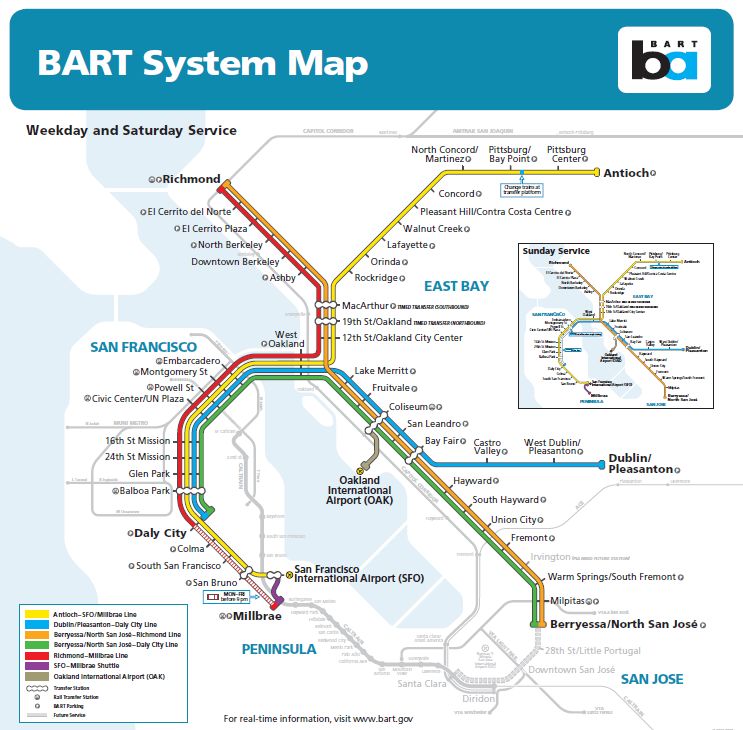
3. RIDERSHIP OUTLOOK .......................................................................................................................15
4. RAIL SERVICE PLAN ..........................................................................................................................18
4.1. NEW RAIL CARS....................................................................................................................... 19
4.2. OTHER SERVICE CHANGES ...................................................................................................... 19
5. WORKING INCOME STATEMENT .....................................................................................................20
6. OPERATING SOURCES ......................................................................................................................21
6.1. OPERATING REVENUE............................................................................................................. 22
6.1.1 PASSENGER REVENUE............................................................................................................. 22
6.1.2 PARKING FEE REVENUE .......................................................................................................... 22
6.1.3 OTHER OPERATING REVENUE ................................................................................................ 23
6.2. TAX AND FINANCIAL ASSISTANCE .......................................................................................... 23
6.2.1 SALES TAX REVENUE ............................................................................................................... 23
6.2.2 PROPERTY TAX REVENUE........................................................................................................ 24
6.2.3 SFO EXTENSION FINANCIAL ASSISTANCE ............................................................................... 24
6.2.4 VTA FINANCIAL ASSISTANCE................................................................................................... 24
6.2.5 MTC FINANCIAL ASSISTANCE FOR MEANS-BASED FARE DISCOUNT PILOT PROGRAM ........ 25
6.2.6 STATE TRANSIT ASSISTANCE ................................................................................................... 25
6.2.7 LOW CARBON TRANSIT OPERATIONS PROGRAM .................................................................. 25
6.2.8 LOW CARBON FUEL STANDARD PROGRAM........................................................................... 25
6.2.9 OTHER ASSISTANCE ................................................................................................................ 26
6.3. EMERGENCY ASSISTANCE ....................................................................................................... 26
6.3.1 CARES ACT ASSISTANCE .......................................................................................................... 26
6.3.2 FEMA REIMBURSEMENT ........................................................................................................ 27
iv6.3.3 DEFERMENT OF FY20 RAIL CAR ALLOCATION ........................................................................ 27
7. OPERATING USES .............................................................................................................................28
7.1. LABOR: WAGES AND BENEFITS .............................................................................................. 29
7.1.1 CALPERS PENSION .................................................................................................................. 30
7.1.2 OTHER PENSION BENEFITS ..................................................................................................... 32
7.1.3 ACTIVE EMPLOYEE MEDICAL INSURANCE .............................................................................. 33
7.1.4 RETIREE MEDICAL ................................................................................................................... 34
7.1.5 WORKERS’ COMPENSATION .................................................................................................. 34
7.2. NON-LABOR ............................................................................................................................ 34
7.3. DEBT SERVICE.......................................................................................................................... 35
7.4. OPERATING ALLOCATIONS TO CAPITAL PROJECTS AND OTHER PROGRAMS ....................... 36
8. CAPITAL SOURCES AND USES...........................................................................................................37
8.1. CAPITAL BUDGET .................................................................................................................... 37
8.2. CAPITAL SOURCES................................................................................................................... 37
8.2.1 ANTICIPATED CAPITAL SOURCES ............................................................................................ 38
8.3. CAPITAL USES .......................................................................................................................... 39
9. ATTACHMENTS ................................................................................................................................42
9.1. SUMMARY OF ATTACHMENTS ............................................................................................... 42
9.1.1 ATTACHMENT A: ORGANIZATION CHART .............................................................................. 43
9.1.2 ATTACHMENT B: DEPARTMENT DESCRIPTIONS .................................................................... 44
9.1.3 ATTACHMENT C: POSITION SUMMARY SCHEDULE ............................................................... 49
v1. OVERVIEW
The Fiscal Year 2021 (FY21) Working Budget faces extraordinary new challenges due to the COVID-19
pandemic, in addition to the continuing challenges BART faced in FY20: declining ridership and fare
revenue, aging infrastructure and increased operating expenses, while BART continues major structural
system reinvestments and Quality of Life improvements. The FY21 Working Budget supports BART’s
commitment to deliver safe, reliable, clean, quality transit service with limited financial resources. Key
features of the FY21 budget include:
• Addressing the COVID-19 impact: keeping customers and employees safe; adapting service levels
and expenses
• Utilizing emergency funding sources
• Continuing capital investment
• Addressing Quality of Life on BART
In the face of these added challenges, staff have worked to balance the needs of riders, employees, and
BART’s financial stability – both near and long term. This budget supports comprehensive plans to
optimize operations, prioritize funding needs and direct resources to only the most critical aspects of
operations as outlined in the sections below.
1.1. COVID-19 PANDEMIC
The COVID-19 pandemic threatens both lives and livelihoods in the Bay Area. To date, the region has
responded to the imperative to save lives by imposing shelter-in-place orders that have ‘flattened the
curve.’ The pandemic and the response to it have, however, put pressure on livelihoods and exacerbated
existing inequities. Job loss has been particularly acute in households that were in precarious economic
situations prior to COVID-19. Further, and particularly relevant for BART, essential workers still need to
travel – and in many cases have no option other than public transit.
Within the scope of the BART system, the precipitous drop in ridership has been the most impactful in
BART’s history. Prior to the pandemic, the system had an average of about 405,000 weekday riders. Over
the weeks since the shelter-in-place order, the system has averaged about 25,000 weekday riders. This
represents a ~94% decrease in ridership – compared with a ~6% drop at the deepest trough of the Great
Recession.
The precipitous decline in ridership and economic activity puts additional pressure and injects
extraordinary uncertainty into the coming year. BART anticipates a decline in fare revenue and nearly all
other revenue sources. Further, staff is budgeting for additional COVID-19-related costs. It is not clear
when ridership will return and if ridership will reach pre-COVID levels.
At the same time, BART has a crucial role in supporting the economic recovery in the Bay Area. Before
COVID-19, more than 2/3 of our riders were commuters, including essential workers. Continuing to
provide safe and reliable service to our passengers is more important than ever.
We therefore are taking a series of steps to adapt. These include:
• Continually updating BART’s scenario-planning outlook. BART has developed a scenario-
planning outlook with a range of outcomes. BART will continually refresh underlying indicators
that could signal a given outcome. Indicators include the Bay Area benchmarks for re-opening
6(cases, hospitals, testing, tracing, and personal protective equipment (PPE)), the development of
therapeutics and vaccines, state and county economic forecasts, surveys of passenger confidence,
and work-from-home behavior. This is further described in the Ridership section.
• Budgeting for a range of COVID-19 operating measures. BART believes it is critical for public
transit systems to put in place interventions that increase passenger confidence and safeguard
customers and staff. This is further described in the Quality of Life section.
• Providing a rail service plan that enables physical distancing where possible. The California
“COVID-19 Industry Guidance: Public Transit and Intercity Passenger Rail” and CDC Guidelines for
Re-Opening include physical distancing as a key prevention practice. BART has provided a rail
service plan that is designed to enable this where possible. This is further described in the Rail
Service Plan section.
1.2. EMERGENCY FUNDING SOURCES
On March 27th, 2020, the president signed into law the Coronavirus Aid, Relief, and Economic Security
Act (The CARES Act), which provides $2 trillion across a host of domestic funding and relief programs to
support efforts to respond to and prepare for recovery from the COVID-19 pandemic. The bill appropriates
$25 billion in supplemental Federal Transit Administration (FTA) Urbanized Area Formula (Section 5307)
and Rural Area Formula (Section 5311) program fund apportionments to support transit agency responses
to the pandemic.
Through these apportionments, approximately $1.3 billion in funding is being provided to the Bay Area.
This funding addresses operating losses as a result of the pandemic, including reduced funding sources
and increased costs. It may be used for operating expenses related to COVID-19, including reimbursement
for operating costs and lost revenue, the purchase of personal protective equipment, and paying the
administrative leave of operations personnel due to reductions in service. Additionally, such funding is
eligible for up to a 100% federal share (compared to a typical 50% maximum federal share for operating
assistance and 80% for capital projects).
The Metropolitan Transportation Commission (MTC) is responsible for programming the region’s FTA
Section 5307 program funds and for working with Caltrans for programming of regional Section 5311
program funds. On April 22, 2020, MTC’s Commission approved staff’s recommendation to program
approximately $780M or 61% of the supplemental funding and to allow operators to access funding as
soon as possible. The remainder of the funding will be programmed in future months as further transit
revenue impacts become clearer. The formula used to determine the allocation of future tranches has
yet to be determined and it may not be the same formula used for the first tranche. This uncertainty
creates risks in determining the level of potential funding to BART that can be assumed in the FY21 budget.
1.3. CAPITAL INVESTMENT
Opportunities to Accelerate System Reinvestment
BART is continuing its capital investment program in FY21, focusing on key projects such as rail car
replacement and fleet expansion, the Core Capacity Program (CCP), Measure RR projects, a New Transbay
Rail Crossing, next generation fare gates, and the planned move to a new headquarters located at 2150
Webster Street in downtown Oakland. Despite the challenges presented by COVID-19, these projects are
primarily funded by secured, restricted funding sources, allowing them to move forward on schedule.
As BART reduced service levels beginning in March, staff started to take advantage of increased system
downtime to accelerate system reinvestment projects. For example, before BART moved the end of
service to 9 pm, workers were replacing 100 feet of running rail a night. With the earlier closing time they
7are now replacing 500 feet of rail per night. The earlier closing time has also allowed for downtown San
Francisco electrical cable replacement work to start at 7 pm on some weeknights. For every six weeks
BART single tracks beginning at 7 pm, six months of Sunday single tracking are eliminated. This
accelerated work ensures that when riders return to the system, it will be in better shape than when they
last used it. Station modernization, escalator replacement, and construction of canopies at the entrances
of downtown San Francisco stations continue to be funded and work is progressing during FY21. As service
levels change in response to ridership levels, staff will continue to strategically accelerate work wherever
possible.
New Rail Cars
BART is replacing its aging legacy rail car fleet and expanding from 669 to 775 new rail cars through its
initial contract with Bombardier. As part of the CCP, BART intends to purchase 306 additional rail cars and
may, in the future, expand the fleet up to 1,200 rail cars upon implementation of the Silicon Valley Rapid
Transit Project, Phase 2, to meet increasing travel demand through the Transbay Corridor.
This new fleet will improve reliability, decrease maintenance costs, relieve crowding, improve the
customer experience, and help meet growing demand associated with regional population growth and
system expansions. Production of rail cars will continue to ramp up in FY21, and final delivery of the last
of the 775 rail cars is scheduled for 2023.
Core Capacity Program (CCP)
The CCP is a system wide undertaking to increase frequency and capacity in the Transbay Corridor during
peak service, and includes the following elements:
• Train Control Modernization Program (TCMP): Install communication-based train control (CBTC)
system wide to enable higher frequency service
• Rail Cars: Purchase 306 additional rail cars to provide more frequent and longer trains
• Hayward Maintenance Complex (HMC) Phase 2: Construct a new east-side storage yard for up
to 250 rail cars and install new traction power substation at the Hayward Maintenance Complex
to support the expanded fleet
• Traction Power Substations (TPSS): Install five new substation facilities to provide the additional
power needed to support increased service levels
A critical initial segment of the CCP, referred to as the Transbay Corridor Core Capacity Project (TCCCP), is
in the final stages of securing a $1.169B grant through the Federal Transit Administration’s (FTA) Capital
Investment Grant (CIG) Program The Core Capacity Program will also be funded through state, regional
and local sources.
The goal of the Core Capacity Program is to reduce the level of crowding between the East Bay and San
Francisco and allow for continued ridership growth. When the project is implemented, BART will be able
to increase its throughput from a current maximum of 23 ten-car trains to 30 ten-car trains per hour (TPH)
in the peak direction through the Transbay Corridor.
BART Safety, Reliability, and Traffic Relief Program (Measure RR)
In November 2016, BART District voters approved Measure RR. The measure authorizes the sale of $3.5
billion in general obligation bonds to fund high priority capital projects. Ninety percent of Measure RR
funding will go toward projects to repair and replace critical safety infrastructure, including renewing
track; renewing power cables and substations; repairing tunnels and structures; renewing mechanical
8systems; and replacing train control and vital communication systems. Ten percent of Measure RR
funding will support projects to renew stations, expand safe access to stations and relieve crowding.
Measure RR-funded projects will continue in FY21, focusing on rail replacement; traction power cable and
substation replacement; downtown San Francisco escalator replacements; and station access
improvements.
New Transbay Rail Crossing
BART and Capitol Corridor are co-leading early planning efforts on the New Transbay Rail Crossing
Program, which includes a suite of projects across the 21-county Northern California megaregion that
will transform the megaregion’s rail network. One of the main projects is a new San Francisco Bay rail
crossing between Oakland and the East Bay that will double BART’s capacity for transbay service. The
project will also create a direct regional rail link that connects the East Bay, Central Valley, and
Sacramento with the San Francisco Peninsula.
The New Transbay Rail Crossing Program is the most transformative project in Northern California. It is
a once-in-a-lifetime opportunity that will benefit many generations to come. The Program will improve
quality of life, protect the environment, and support economic vitality and competitiveness. Among
many benefits, the Program will:
• Promote equity and prosperity by bridging the gap between affordable housing and high-quality
jobs
• Improve traveler experience by enabling fast, frequent, reliable, and comfortable transit service
• Improve air quality by creating an integrated transit network that provides an attractive and
viable alternative to driving, thereby reducing greenhouse gas emissions and reliance on fossil
fuels
• Connect transit hubs and enable one-seat train rides between many Northern California
locations, such as Sacramento and San Francisco, Berkeley and Palo Alto, and Stockton and San
Francisco International Airport
• Meet growing travel demand as Northern California’s population continues to increase
Staff will be performing a market analysis and evaluating future demand for rail trips to determine how a
new transbay rail crossing can best serve the region. Important considerations will include evaluating the
benefits to the public, the economic costs and benefits, the financial viability, and what it will take to
deliver and operate the project.
The engagement effort will run through the timeline of the project and will involve the numerous
stakeholders of the Northern California megaregion, with a strong focus on equity. FY21 efforts will
include advertising and awarding contracts for Engagement, Technical Support for Project Development,
and Environmental Review services.
Next Generation Fare Gates
In the Fall of 2019, BART initiated design for Next Generation Fare Gates. The objective for the new
design is to improve reliability and maintainability of the fare gates, while also reducing fare evasion and
enhancing security. BART is currently working on a funding plan to advance the procurement and
installation of the new fare gates once design is complete.
9Silicon Valley Berryessa Extension (SVBX)
The two-station, 10-mile extension into Santa Clara County connects to the Warm Springs/South Fremont
Station in southern Alameda County. Passenger service will begin on June 13, and the FY21 Working
Budget assumes a full year of SVBX service.
Construction of the project was managed by the Santa Clara Valley Transportation Authority (VTA), in
cooperation with BART. VTA funded all construction costs of the project and will reimburse BART for all
costs associated with rail service, including operations, maintenance, core system impacts, and funding of
a share of core system capital expenses.
New BART Headquarters – 2150 Webster Street
In December 2019, BART purchased a building for its new headquarters site at 2150 Webster in Oakland
which the District plans to occupy by July 1, 2021. The District issued Series 2019A bonds in the amount
of $223M to finance the transaction, applying the proceeds primarily to the $142M acquisition and
$85M in tenant improvements for the building. Compared to lease extension options available to BART
at its current headquarters location, BART looks to save $211M dollars over a 25-year period on a
nominal basis with the building purchase.
1.4. QUALITY OF LIFE ON BART AND RIDER SAFETY
BART intends to ramp up initiatives responding to concerns related to homelessness, fare evasion, and
security. These efforts already showed progress in FY20 and moving into FY21 they complement the
District’s comprehensive plan to respond to the coronavirus pandemic. The initiatives are a direct
response to challenges identified by riders in the bi-annual 2018 Customer Satisfaction Survey.
COVID-19 Operating Measures
BART believes it is critical for public transit systems to put in place interventions that increase passenger
confidence and safeguard customers and staff.
Across the world, there are widely varying sets of health policy guidelines, alongside differing levels of
enforcement, for operating measures that address COVID-19. Mitigation measures continue to develop
and respond to the needs of individual systems, though increased cleaning is the most widely
implemented.
BART continues to develop and implement COVID-19 operating measures with a focus on customer and
employee safety. Staff monitor the development of responses implemented in other systems across the
US and abroad, as well as guidance from public health professionals. Measures currently being
implemented across BART include:
• Enhanced cleaning of vehicles, stations, and facilities
• Longer trains to reduce crowding
• Deployment of PPE
• Reduced customer touchpoints in station areas
• Clear customer communication on new safety protocols
Homelessness
Homeless outreach will continue to be a priority with a focus on developing funding partnerships and
expanding efforts. Teams in Contra Costa County and San Francisco County continue to connect
individuals experiencing homelessness with services.
10In FY21, the District will expand the Outreach Team approach by strengthening connections at San
Francisco International Airport (SFO) and may also expand to services in Alameda and San Mateo counties,
depending on opportunities for funding partnerships. BART and the San Francisco Municipal
Transportation Agency (SFMTA) will continue to share costs between 2-4 downtown San Francisco
stations for the Elevator Attendant Program (the exact number to be determined in the next few weeks).
BART will continue participation in the San Francisco Pit Stop Program, which provides attended street-
level public restrooms adjacent to three underground BART stations.
Fare Evasion
The District has been hardening facilities by enclosing elevators, increasing the height of paid area railing,
and alarming emergency doors and swing gates and expanding the digital camera network. Additionally,
BART Police have implemented operations focused on preventing fare evasion such as focused
enforcements at BART’s busiest stations. The proof-of-payment team provides visual confirmation of
BART’s commitment to fairness and equity to all patrons.
Safety & Security
Recently bargained salary and benefit changes to the BART Police Officers’ Association contract continue
to show success in increasing the number of lateral transfers from other law enforcement agencies to
BART, and BART hopes such changes will also assist with retention. BART Police have undertaken
operations focused on crime prevention, increased visibility, and law enforcement when
necessary. These efforts resulted in a 34% drop in BART’s crime rate for in January-April of 2020
compared with the same four months in 2019.
1.5. FY21 WORKING BUDGET
The following sections begin with a discussion of the measures taken to address the significant budget
shortfalls due to COVID-19 impacts, followed by BART’s assessment of future Ridership and the
subsequent Rail Service Plan scenarios being considered in FY21. Operating and capital sources and uses
are shown together in a combined Income Statement to present a comprehensive picture of BART’s
financial situation. This is followed by descriptions of the FY21 Working Budget operating and capital
sources and uses.
112. FY21 DEFICIT REDUCTIONS
The FY21 Working Budget includes a series of cost reductions to bring expenditures in line with dramatic
downward revisions to revenue projections as a result of the COVID-19 pandemic. Though the budget
does not include layoffs, these reductions adversely impact BART’s service levels, staffing, and severely
curtails funding to allocations designed to ensure the system’s long-term operational and fiscal stability.
Overall, the planned FY21 budget expenditure level was reduced by approximately $150M. A further
$40M in savings was achieved by deferring a scheduled FY20 rail car payment and repurposing those funds
in FY21 to meet operating expenses. These reductions are partially offset by necessary expenditure
increases to run the SVBX extension and for enhanced COVID-19 related measures.
The reductions made in FY21 are deep and represent difficult decisions. They are, however, preferable to
laying off staff. It takes BART almost a full year to hire, train, and deploy frontline staff; reducing their
ranks now would hamper BART’s ability to scale back up once the pandemic is contained and ridership
rebounds. Reductions beyond what is included in the current FY21 Working Budget would likely entail
service cuts and layoffs.
All savings outlined below reflect changes from the planned FY21 Operating Budget prior to the COVID-
19 pandemic.
2.1. POSITION SAVINGS
The FY21 budget includes a reduction of 251.5 vacant operating full-time equivalent positions (FTEs), for
an estimated savings of approximately $32.3M. An additional 420.2 vacant capital/reimbursable positions
were also eliminated in the FY21 Working Budget. The elimination of capital positions will have a minimal
near-term financial impact on the operating budget, however their removal will help mitigate any future
risk of capital labor being absorbed by the operating budget. These reductions will not result in any layoffs
in FY21. Capital positions will be added back into the budget, when necessary, to support capital projects.
Additional labor savings are proposed by a District wide freeze of executive level staff salaries as well as
the removal of a budgeted incentive that would be paid to staff, per collective bargaining agreements, if
certain metrics were met for ridership.
Position Savings Op FTE Impact Cap/Re FTE Impact Operating Savings
COVID-19 Hiring Freeze (251.5) (420.2) $ (32.3M)
Labor Category Operating Savings
($ millions)
Wages & Benefits: COVID-19 Position Savings $ (32.3)
Executive Staff Wage Freeze (0.4)
Lump Sum Payment Removal Elimination (3.6)
Total COVID-19 Labor Savings (36.2)
COVID-19 Labor Set-aside 23.5
Net Labor Change Due to COVID-19 $ (12.7)
12These labor savings were offset by an additional $23.5M which will be budgeted for additional labor costs
that may be needed for BART to better respond to the COVID-19 pandemic such as increases in service,
disinfecting and cleaning cars, stations and BART facilities.
Though there are limited exemptions for essential workers, removing 251 positions will limit BART’s ability
to scale up service levels in the future, while limiting the ability of supporting departments (such as Human
Resources or Information Technology) to meet existing workload demands or respond to additional
needs.
2.2. NON-LABOR REDUCTIONS
In addition to labor reductions staff also worked to identify non-labor savings. The District’s travel budget
was eliminated while reduced service and ridership lowered projected costs for Power, Clipper Fees,
Purchased Transportation and ADA Paratransit. The FY21 budget includes $20.3M for anticipated
expenditures related to the COVID-19 pandemic such as materials needed for cleaning and disinfecting,
personal protective equipment and signage.
Non-Labor Category Operating Savings
($ millions)
Travel (0.5)
Clipper Fees (3.4)
Power (8.0)
Purchased Transportation (4.3)
ADA Paratransit (1.3)
Total COVID-19 Reductions (17.5)
COVID-19 Non-Labor Set-aside 20.3
Net Non-Labor Change Due to COVID-19 $ 1.5
2.3. ALLOCATIONS
The single largest source of FY21 reductions comes from planned Allocations. Allocations support critical
capital work, purchases of vehicles and supplies, and support long-term fiscal health for the District. They
are also one of BART’s few highly flexible spending categories. Allocations were reduced by $92M from
planned levels in FY21, with an additional $40M in savings effected through a deferral of an FY20 railcar
purchase allocation. The budget has been reduced to only required payments and local matching amounts
needed to leverage federal capital funding. The result is a suspension of contributions to BART’s unfunded
pension liability trust as well as reduced investments in state of good repair, vehicle procurement,
information technology infrastructure, and sustainability initiatives.
13Allocation Reduction
($ millions)
Capital Rehabilitation (6.2)
Priority Capital Projects/Programs (61.8)
Stations/Access Projects (2.0)
MET Building Repayment (3.2)
LCFS Sustainability Reserves (9.0)
Pension Liability (10.0)
Total COVID-19 Allocation Reductions $ (92.3)
143. RIDERSHIP OUTLOOK
California and the Bay Area in particular have played a leading role in the nation’s response to the
coronavirus pandemic. The health officers in all the Bay Area counties served by BART issued their first
shelter-in-place order on March 16th. BART ridership declined more than 50% in the week leading up to
that moment and fell even further after the order was implemented. After weeks of decline BART
ridership eventually leveled off in April at approximately 6% of budget levels, as shown in the chart below.
BART’s daily weekday ridership fell from an average of 405,000 trips to around 25,000. Despite that
decline, BART has continued to run long trains to enable essential workers who rely on the system to
engage in physical distancing. Rail service was modified in April to provide service at 30-minute headways
on each line, peak trains were cancelled, and service was truncated to end at 9:00 pm each day and start
at 8:00 am on Saturdays.
In this era of uncertainty, BART has made transparency a priority. BART is posting daily ridership totals on
its website along with the latest news about what the agency is doing to respond to the coronavirus.
Proactively providing this data is invaluable as it provides a gauge of the effectiveness of shelter-in-place
orders and reassures the public that BART is being open about its steep ridership decline as it develops
plans to adapt to the changing environment for transit.
The severity of BART’s ridership decline is consistent with that of other large transit agencies across the
U.S. The decline hits the District hard because it has one of the highest farebox recovery rates in the
country. What for years was a measure of BART’s efficiency now is a major risk. About 60% of operating
revenues come from fares, which means a steep and prolonged decline in ridership will have a dramatic
impact on BART’s ability to fund its reliable service.
This budget outlook is grounded in state and county guidance on re-opening. A key element is the
California Resilience Roadmap, which lays out four stages of recovery. Stage 1 represents Shelter-in-Place.
In Stage 2, lower risk workplaces re-open, including retail, manufacturing, offices where telework is not
15possible. In Stage 3, higher risk workplaces re-open: personal care, entertainment venues, in-person
religious services. Stage 4 represents the end of the stay-at-home order.
BART has developed two scenarios for ridership which relate to a range of epidemiological and economic
outcomes. In the “Faster Ramp” scenario, ridership in FY21 averages 50% of pre-COVID-19 levels. In the
“Slower Ramp” scenario, it average 15% of pre-COVID-19 levels. These scenarios depict different paths of
ramps up and to what degree it eventually recovers.
The “Faster Ramp” scenario reflects faster progression through the California Resilience Roadmap and
more significant recovery. In this scenario, the Bay Area reaches Stage 4 of the California Resilience
Roadmap by September of 2020. To make this possible, the Bay Area would achieve its targets on cases,
hospitals, testing, tracing, and PPE - as well as the development of therapeutics. This scenario also reflects
the recovery of ridership to an average of 50% of pre-COVID-19 levels in FY211. This scenario relies on
public health guidance that allows vulnerable populations to ride public transit, economic impacts no
bigger than the Great Recession, and the return of passenger confidence.
The “Slower Ramp” scenario reflects slower progression through the Resilience Roadmap and significantly
decreased ridership. In this scenario, the Bay Area reaches Stage 4 of the California Resilience Roadmap
in June of 2021. This could occur if a viral resurgence returns the region to Stage 2 of the Recovery
Roadmap in the fall. This scenario reflects a limited recovery in ridership to an average of 15% of pre-
COVID-19 levels in FY21, driven by guidance for vulnerable populations to avoid public transit,
unemployment nearly as high as the Great Depression, and a durable reduction in passenger confidence.
Key Timing Assumptions by Scenario2
Fast ramp Slow ramp
Event Underlying indicators
scenario scenario
Anticipated end of Stage 1 May 2020 Jul 2020 Bay Area County Checklist
• Cases
• Hospitals
Entry to California Stage 2 Jun 2020 Aug 2020
• Testing
• Tracing
Entry to California Stage 3 Jul 2020 Sep 2020 • PPE
Bay Area County Checklist stable
Entry to California Stage 4 Sep 2020 Jun 2021
Development of therapeutics
Impact of possible viral Return to Return to
resurgence Stage 3 Stage 1
1Source: BART FY2021 monthly ridership forecasts, BART rider segmentation survey data, BART historical monthly ridership,
Oxford Economics unemployment projections, Bureau of Labor Statistics historical unemployment, BART ridership data,
Consumer Survey April 2020, Oxford economics jobs by industry in Bay Area counties, Slack HQ, Gartner, KFF
2
Source: SF.gov, San Francisco public health department and the California Department of Public Health, SF Chronicle,
pharmaceutical company press releases, Center for Disease Control, New York State press coverage, FDA guidance, White
House press conferences, World Health Organization
16FY21 Ridership Scenarios (Faster Ramp and Slower Ramp)
The budget assumes that monthly ridership will come in at the midpoint between the Slow Ramp and Fast
Ramp scenarios. The aggregate result is a total of approximately 36 million trips for FY21, 30% of the
baseline (pre-COVID-19) forecast. This annual total is comprised of a range of ridership levels throughout
the year: approximately 93,000 average weekday trips in the lowest months and 245,000 average
weekday trips in the highest month. The resulting average weekday ridership for FY21 is approximately
122,000.
174. RAIL SERVICE PLAN
The rail service plan for FY21 balances extraordinary uncertainty, guidance for physical distancing on the
system, and BART’s crucial role supporting the economic recovery of the Bay Area. As described above,
staff anticipates that ridership could recover to as high as an average of 50% of pre-COVID-19 levels
through FY21. At the same time, following state guidance to enable physical distancing will require
significantly more service to carry the same number of people.
Four potential BART service plans for FY21 are summarized in the table below. BART’s FY21 staffing level
and the basis for the FY21 Working Budget is the service plan labelled ‘Reduced Peak and Early Close.’
That staffing plan allows for 15-minute peak headways on five lines (without additional peak period
trains), with service until 9 PM on weekdays.
The actual service provided over the course of the fiscal year will vary in response to demand as follows:
• BART will begin FY21 with 30-minute base headways on each line, with additional trains added in
the schedule where required to maintain social distancing standards. As demand increases, we
expect to scale up service incrementally, adding trains to move toward full 15-minute frequencies
by line (Reduced Peak and Early Close)
• If demand is high and funding is available, later in FY21 BART could move toward restoring rush
trains and extending service hours (Normal Pre-COVID-19 Schedule), and ultimately extend the
duration of peak period service to spread peak demand and promote physical distancing
(Enhanced Pre-COVID-19 Schedule). Note that the time to hire and train operations staff will be a
constraint on how quickly service can be enhanced.
• If required to maintain fiscal stability, BART is also prepared to cut back service to ‘Half Pre-COVID-
19 Schedule,’ which offers 30-minute headways on each line and 9 PM close. Such a reduction
would require reduction of staff.
Service Plans
Basis of Working
Half Normal Enhanced
Budget:
Pre-COVID-19 Pre-COVID-19 Pre-COVID-19
Reduced peak and
Schedule Schedule Schedule
early close
Headways 30 15 15 15
Rush Trains None None Yes Yes - Additional
Hours of Service 5am-9pm 5am-9pm 5am-12am 5am-12am
Peak Cars 431 609 709 709
Peak Trains 44 62 72 72
Average Weekday Car Miles 148,981 272,179 304,615 318,439
Total Car Miles (M) 45.0 82.3 92.1 95.6
Starting on June 13th, BART will open the San José extension to Berryessa with two-route service to San
Francisco and Richmond. The train schedule will continue to operate at 30-minute line headways, without
18peak trains, and closing at 9:00 pm. BART will monitor ridership and will add additional trains during
commute hours in the 15-minute slots when warranted to ensure safe passenger distancing. This solution
of adding or omitting the 15-minute commute trains allows BART to scale service up and down in response
to demand.
Starting in September, the strategy is to allow the gradual expansion of evening service. BART is planning
a train schedule based upon 30-minute line headways seven days a week, with 15-minute commute
service weekdays and Saturdays, and service extended to 11:00 pm from Monday through Saturday. BART
will balance staffing levels between the priorities of supporting the commute period and adding evening
service. Like the June-to-September service, this solution enables adding or omitting the 15-minute
commute trains to scale up and down with demand. This strategy will yield the greatest level of service
that BART can provide without hiring and training more train operators and maintenance personnel.
February 2021 service will reflect need based on ridership data. This could mean a gradual return to pre-
COVID-19 service levels. This would likely include 15-minute base line headways on weekdays and 30-
minute headways on weekends, with 15-minute peak service on Saturdays, and service until midnight.
Expanded service would require a decision be made with sufficient time to allow for hiring and training of
staff prior to a crew bid.
4.1. NEW RAIL CARS
As of mid-May 2020, BART has accepted 206 new rail cars, 11 of these conditionally accepted, and has
placed 195 into revenue service with an additional five used for training. Another 5 cars are anticipated
to be delivered prior to the end May 2020. By the end of FY20, BART anticipates having 13 new trains in
service and running 10-car trains on all Transbay routes at 15-minute base headways. During FY21, BART
intends to use the increasing inventory of new cars to gravitate the fleet spare ratio toward the industry
standard of 20% and retire the least reliable of the legacy fleet.
4.2. OTHER SERVICE CHANGES
In addition to upcoming service changes, a set of changes that took effect in February 2020 will continue
to affect BART service in FY21. Schedules were refined to improve single tracking for the evening and
overnight BART Transbay Tube Earthquake Retrofit project (Sunday – Thursday nights) and the M Line
(San Francisco and West Bay) 34.5KV Cable Project on Sundays. Smaller schedule changes are anticipated
in FY21 to react to long-term construction and address 2021 construction needs, such as track work along
the A line (Lake Merritt to Warm Springs).
195. WORKING INCOME STATEMENT
Income Statement Budget Change
($ millions) FY20 FY21
$ %
Adopted Working
Rail Passenger Revenue $ 479.4 150.7 (328.6) -69%
ADA Passenger Revenue 0.9 0.3 (0.6) -72%
Parking Revenue 36.5 10.5 (26.1) -71%
Other Operating Revenue 28.7 23.7 (5.1) -18%
Subtotal - Operating Revenue 545.5 185.1 (360.4) -66%
Sales Tax Proceeds 277.0 239.0 (38.0) -14%
Property Tax Proceeds 50.6 50.6 0.0 0%
SFO Ext Financial Assistance 5.8 41.7 35.9 618%
VTA Financial Assistance - 28.4 28.4 -
MTC Financial Assistance MBF Discount Program - 1.6 1.6 -
Local & Other Assistance 6.4 6.0 (0.5) -7%
State Transit Assistance 39.4 28.5 (10.9) -28%
Low Carbon Transit Operations Program 8.4 8.5 0.2 2%
Low Carbon Fuel Standard Program 14.1 14.4 0.3 2%
Subtotal - Financial Assistance 401.8 418.8 17.0 4%
CARES Act (Round 1 – FY20 Remainder) - 87.0 87.0 -
CARES Act (Round 2 - Targeted) - 164.0 164.0 -
FEMA Reimbursement (COVID-19 Expenses) - 20.0 20.0 -
Deferment of FY20 Rail Car Allocation - 40.0 40.0 -
Subtotal - Emergency Funding - 311.0 311.0 -
SUBTOTAL - OPERATING SOURCES 947.3 914.9 (32.4) -3%
SUBTOTAL - CAPITAL SOURCES 1,419.9 1,506.7 86.7 6%
TOTAL SOURCES 2,367.2 2,421.5 54.3 2%
Labor & Benefits 591.6 600.9 9.3 2%
COVID-19 Labor Set-Aside - 23.5 23.5 -
ADA Paratransit 16.9 16.1 (0.8) -5%
Purchased Transportation 14.6 11.4 (3.3) -22%
Power 45.6 48.1 2.5 5%
COVID-19 Non-Labor Set-Aside - 20.3 20.3 -
Other Non-Labor 131.0 130.6 (0.4) -0%
Subtotal - Operating Expense 799.8 850.9 51.1 6%
Bond Debt Service 47.2 47.4 0.2 0%
Allocations 100.3 16.6 (83.7) -83%
Subtotal - Debt Service & Allocations 147.5 64.0 (83.5) -57%
TOTAL - OPERATING EXPENSE 947.3 914.9 (32.4) -3%
System Reinvestment 983.0 1,142.8 159.8 16%
Safety & Security 74.0 65.4 (8.5) -12%
Earthquake Safety 167.1 67.3 (99.8) -60%
Service Capacity & Enhancement 158.2 177.5 19.3 12%
System Expansion 30.2 46.0 15.8 52%
Reimbursable/Other 7.5 7.6 0.1 1%
TOTAL - CAPITAL EXPENSE 1,419.9 1,506.7 86.7 6%
TOTAL USES 2,367.2 2,421.5 54.3 2%
NET OPERATING RESULT - - $ - -
206. OPERATING SOURCES
The below table summarizes the operating sources for the FY20 Adopted Budget and the FY21 Working
Budget. Each line item is described in further detail in the subsequent sections.
Operating Sources Budget Change
($ millions) FY20 FY21
$ %
Adopted Working
Revenue
Rail Passenger Revenue $479.4 150.7 (328.6) -69%
ADA Passenger Revenue 0.9 0.3 (0.6) -72%
Parking Revenue 36.5 10.5 (26.1) -71%
Advertising 10.1 6.8 (3.3) -33%
Telecommunications 8.1 9.5 1.4 18%
Parking Citations 3.7 1.1 (2.6) -69%
Building and Ground Leases 1.8 1.6 (0.2) -13%
Transit Oriented Development 1.0 1.5 0.5 54%
Other 4.1 3.2 (0.9) -22%
Total Operating Revenue 545.5 185.1 (360.4) -66%
Financial Assistance
Sales Tax Revenue 277.0 239.0 (38.0) -14%
Property Tax 50.6 50.6 0.0 0%
SFO Extension Financial Assistance 5.8 41.7 35.9 618%
VTA Financial Assistance - 28.4 28.4 -
MTC - Means-Based Fare Discount Prog - 1.6 1.6 -
State Transit Assistance (STA) 39.4 28.5 (10.9) -28%
Low Carbon Transit Operations Program 8.4 8.5 0.2 2%
Low Carbon Fuel Standard Program 14.1 14.4 0.3 2%
Local & Other Assistance 6.4 6.0 (0.5) -7%
Total Financial Assistance 401.8 418.8 17.0 4%
Emergency Funding
CARES Act (Round 1 – FY20 Remainder) - 87.0 87.0 -
CARES Act (Round 2 - Targeted) - 164.0 164.0 -
FEMA Reimbursement (COVID-19 Expenses) - 20.0 20.0 -
Deferment of FY20 Rail Car Allocation - 40.0 40.0 -
Total Emergency Funding - 311.0 311.0 -
OPERATING SOURCES, TOTAL 947.3 914.9 (32.4) -3%
216.1. OPERATING REVENUE
6.1.1 Passenger Revenue
Passenger Revenue
Fare revenue for FY21 is budgeted at just $151M, down nearly 69%, or $329M from the FY20 budget. This
budget assumes that total annual trips on the core BART system (exclusive of the SVBX extension) reflects
the midpoint between the Slow Ramp and Faster Ramp ridership scenarios described and illustrated in
Section 3 (Ridership Outlook). It also assumes that average fare is 5% lower than the pre-pandemic FY20
level.
It is important to note that prior to the pandemic and shelter in place orders, ridership and fare revenue
were both tracking slightly above budget. In addition, with the precipitous decline in ridership between
March and June, fare revenue in FY20 is now expected to be approximately $140M below budget.
The fare revenue forecast also includes:
• Fare revenue generated by new SVBX trips, which is used to help offset VTA’s operating cost of
the SVBX extension. Per the VTA O&M Agreement, VTA will be responsible for any operating costs
for the SVBX extension which is not covered by SVBX fare revenue.
• BART participation in MTC’s Regional Means-Based Fare Discount Pilot Program, Clipper START,
along with Caltrain, Golden Gate Transit and the San Francisco Municipal Transportation Agency.
The pilot is expected to begin this summer, with a discount available to adult riders earning 200%
or less of the federal poverty level. BART will offer a 20% discount per trip.
• Total passenger revenue also includes $0.3M in fares paid by Americans with Disabilities Act (ADA)
paratransit customers.
In addition, BART is moving toward eliminating magnetic stripe paper tickets and using Clipper for all fare
payment. Beginning in fall 2019, the District piloted Clipper-only sales at four stations, after which staff
conducted and the Board approved a Title VI analysis for discontinuance of paper ticket sales. The SFO
Airport station will move to Clipper only in June 2020. The $0.50 surcharge and Clipper-only pilots have
been successful—since implementation of the surcharge, paper ticket usage rates have declined by
approximately 75%.
6.1.2 Parking Fee Revenue
BART generates revenue from permit and daily fee parking at its 36 stations with parking facilities. The
daily fee at all stations is currently capped at $3.00, except at South Hayward ($2.00) and North
Concord/Martinez ($2.50), in addition West Oakland ($10.50) does not have a cap. The monthly permit
price at all stations is also capped at $105.00, except for South Hayward ($84.00), North Concord/Martinez
($94.50), and West Oakland ($262.50). Beginning in July 2020, patrons using the six Oakland stations will
begin to pay an 18.5% tax due to implementation of a parking tax imposed by the City of Oakland. BART
will collect the tax and remit net revenues to Oakland.
The FY21 parking revenue budget is $10M to reflect BART’s expected decline in ridership and decreased
parking demand. Parking revenue generated at stations on the SVBX extension will be collected by VTA
and will not be budgeted by BART.
Under the current parking fee program approved by the Board in 2013, incremental revenue raised from
the demand-based parking fee program is dedicated to investments in station access, station
rehabilitation, and station modernization. No incremental revenue is expected in FY21.
22BART staff is advancing a series of parking modernization efforts to improve the customer experience,
effectively manage parking resources, and enhance access to stations. This includes releasing new Carpool
and Daily Fee parking payment features through the BART mobile app. Staff expect to make these
features available to all stations in FY21 to provide customers with a safe and convenient “touchless”
method of parking payment.
6.1.3 Other Operating Revenue
BART also generates operating revenue from non-passenger sources, nearly all of which already have
been or will be affected by the pandemic and associated ridership declines. Total other operating revenue
is now budgeted at $23.7M in FY21. The two largest sources are the Commercial Communications
Revenue Program (CCRP) and advertising. Smaller revenue sources include fines and forfeitures,
investments, building and ground leases, concessions, and other miscellaneous revenues.
The CCRP, managed by the Office of the Chief Information Officer (OCIO), generates revenue through
commercial fiber and wireless telecommunications. In January 2020, the BART Board approved the Digital
Railway Project with Mobilitie Services, LLC, which has the potential to substantially increase fiber optic
and wireless revenue over time. CCRP is estimated to generate $7.1M in FY20, and $9.5 in FY21 while
focusing primarily on constructing new revenue generating assets with Mobilitie.
BART has an advertising franchise agreement with OUTFRONT Media (the Franchisee), which manages
the sales and posting of advertising on BART’s behalf. In FY21, BART anticipates receiving $6.8M in
advertising revenue. Due to the sudden and unexpected reduction in ad sales caused by COVID-19, BART
staff are reviewing the advertising contract to consider revenue payment adjustments requested by
OUTFRONT Media. Staff continues to work with OUTFRONT toward installation of digital advertising
screens taking into account limitations related to COVID-19.
Parking citation revenue is expected to decrease with ridership demand and is budgeted at $1.1M in
FY21.
Building and ground lease revenue is received from leasing vacant parcels and office space in the Joseph
P. Bort MetroCenter (MET) building, and from Special Entrance Agreements at Powell Street Station that
provide access from the station to the Westfield shopping center entrance. The budget for FY21 is $1.6M.
Transit Oriented Development (TOD) revenue includes ground leases at West Dublin/Pleasanton, Pleasant
Hill/Contra Costa Centre, Millbrae, Castro Valley, MacArthur and Coliseum stations, and transit benefit
fees at West Dublin/Pleasanton and South Hayward and is budgeted at $1.5M in FY21.
“Other” revenue, budgeted at $3.2M in FY21, includes investments income; public telephones;
concessions; special fees and permits; the Capitol Corridor Joint Powers Authority’s overhead recovery;
and other miscellaneous sources.
6.2. TAX AND FINANCIAL ASSISTANCE
6.2.1 Sales Tax Revenue
A dedicated 75% share of a one-half cent sales tax levied in the three BART District counties (San Francisco,
Alameda and Contra Costa) is BART’s second largest source of revenue after passenger fares. The
remaining 25% is split equally between AC Transit and the SFMTA. BART’s sales tax base is diverse, and
data from the California Department of Tax and Fee Administration indicates that the largest economic
23You can also read