Gallagher Re Natural Catastrophe Report of 2022 - Expert analysis and insurance implications
←
→
Page content transcription
If your browser does not render page correctly, please read the page content below
Gallagher Re
Natural Catastrophe
Report of 2022
Expert analysis and insurance implications

                           JANUARY 2023
TABLE OF CONTENTS

                                EXECUTIVE FOREWORD

                                GLOBAL NATURAL CATASTROPHE OVERVIEW
                                   5      Global Overview
                                   8      Global Natural Hazard Overview
                                   9      Global Natural Catastrophe Event Summary

                                IN FOCUS
                                   13     Hurricane Ian Impact and Takeaways
                                   16     Inflation/Social Inflation
                                   19     ENSO/La Niña
                                   22 Drought
                                   25 Capital

                                NATURAL CATASTROPHE SUMMARIES BY REGION
                                   30 Asia-Pacific (APAC)
                                   34 Europe, Middle East, Africa (EMEA)
                                   39 United States (US)
                                   43 Latin America and Canada

                                APPENDIX

                                AUTHORS

All data and graphics sourced to Gallagher Re unless specified otherwise.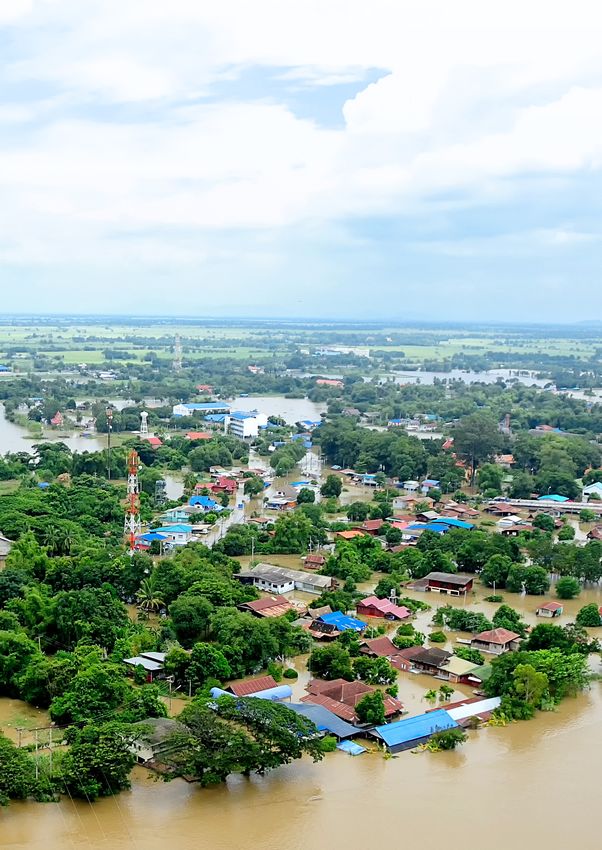
EXECUTIVE
                                                                                                                IN FOCUS
                                                                                                                     FOREWORD

Welcome to the Gallagher Re
Natural Catastrophe Review of 2022.
During 2022, the world saw another year of impactful natural
catastrophe events that once again emphasized the need to better
account for the growing risks that these hazards bring.

Total insured losses were estimated at USD 140bn, of which
USD 125bn was covered by private insurers and USD 15bn by public
insurance entities (example: US National Flood Insurance Program).
Gallagher Re notes that 2022 became the fifth year since 2017 to
cross the USD 100bn threshold.

The increase in severity and in some cases frequency of events—              Readers of this report can expect to:
particularly when focusing on secondary perils—presents                        • Explore global and regional catastrophe hazard
reinsurers with a multifaceted and complicated challenge when it                 and loss drivers
comes to risk protection and mitigation.
                                                                               • Learn which regions have undergone higher
In this report, we summarize the major catastrophe events that                   annual losses
occurred in each region around the globe in 2022, detailing the                • Better understand climate change influence on
financial loss, fatalities, and other major considerations for our               individual event behavior and impacts
clients and beyond. A summary of major global events can be
                                                                             At Gallagher Re, we provide dedicated analytical, product and
found in the appendix. All data estimates are from Gallagher Re,
                                                                             practice support to help our clients quantify, understand and
unless stated otherwise.
                                                                             more thoughtfully develop strategies to better assess their natural
This report also aims to help readers give greater thought to how            catastrophe risk. This includes developing partnerships and
topics such as climate change, inflation and social inflation, and the       collaborations with institutions via our Gallagher Research Centre.
macroeconomic environment are driving new and emerging types                 We thank you for your support and look forward to helping you
of risk. The risk profile faced by the private sector, governmental          navigate your way through whatever challenges Mother Nature
entities and beyond continues to evolve as new challenges arise.             may bring in 2023.

                           Steve Bowen
                           Chief Science Officer
                           Gallagher Re

                                                                         3
GLOBAL NATURAL
CATASTROPHE
OVERVIEW

GLOBAL NAT CAT OVERVIEW

Ian Dominates in Complicated
Catastrophe Year
Natural hazard mitigation and adaptation needs amplify as annual cat losses
show continued growth

2022 was a year marked by costly, consequential and historic
natural catastrophe events around the world. The estimated                        “A prolific late December winter storm
economic cost of natural hazards was listed at USD 360bn.                         and extreme cold snap led to significant
Private and public insurance entities covered USD 140bn, meaning                  societal disruption via power outages and
61% of global disaster losses were not covered by insurance,                      impacted crops across a huge swath of the
demonstrating the protection gap.                                                 lower 48 states.”
It was also another year where climate change, exposure growth
and social inflation were the clear primary driving forces of loss.
                                                                            Storm (SCS) outbreaks resulted in a multibillion-dollar insured
The fingerprints of climate change were visible on virtually every          loss, with 2022 marking the 15th consecutive year with aggregate
major weather and climate event in 2022, once again highlighting            insured SCS losses topping USD 10bn and the 8th year since 2010
the urgency to implement proper planning and investment                     that such losses have topped USD 20bn. A prolific late December
strategies that will limit the risk to life and property.                   winter storm and extreme cold snap led to significant societal
                                                                            disruption via power outages and impacted crops across a huge
How we collectively bring together financial institutions (insurance,
                                                                            swath of the lower 48 states. This put a further spotlight on losses
asset managers, real estate, banking), governmental entities,
                                                                            associated with secondary perils.
academia, and emergency management to identify risk and
implement actionable plans to improve our resilience, mitigation,           Historic and Consequential Global Events
and adaptation readiness will have hugely positive impacts on
                                                                            The costliest event and one of the most consequential from a
trying to slow the rate of annual catastrophe loss growth.
                                                                            humanitarian perspective outside the US was the prolific seasonal
US Dominates Loss Costs                                                     monsoon flooding in Pakistan. A report from the World Bank cited a
                                                                            USD 15bn direct physical damage economic loss, while the country’s
The US endured several large-scale and impactful events in 2022,
                                                                            National Disaster Management Authority cited 1,739 fatalities,
led by Hurricane Ian. The storm was poised to result in at least
                                                                            2.3 million homes damaged and 33 million people affected across
USD 55bn loss for public and private insurance entities, and an
                                                                            90 districts. Historic flooding also impacted several regions of Africa,
overall economic loss of USD 112bn in the US alone. This marked
                                                                            notably in Nigeria where the country’s insurance industry faced its
one of the costliest natural disaster events ever recorded globally.
                                                                            most expensive natural catastrophe on record. The effects of a third
The country also endured a prolific drought that was expected
                                                                            consecutive La Niña occurrence were quite pronounced in Australia:
to result in USD 9bn in indemnity payouts via the United States
                                                                            the Insurance Council of Australia stated weather-related events had
Department of Agriculture (USDA) Risk Management Agency
                                                                            resulted in nearly USD 5bn in payouts alone, primarily from a historic
(RMA) crop insurance program. At least three Severe Convective
                                                                            flood event in late February and March.

                                                                        5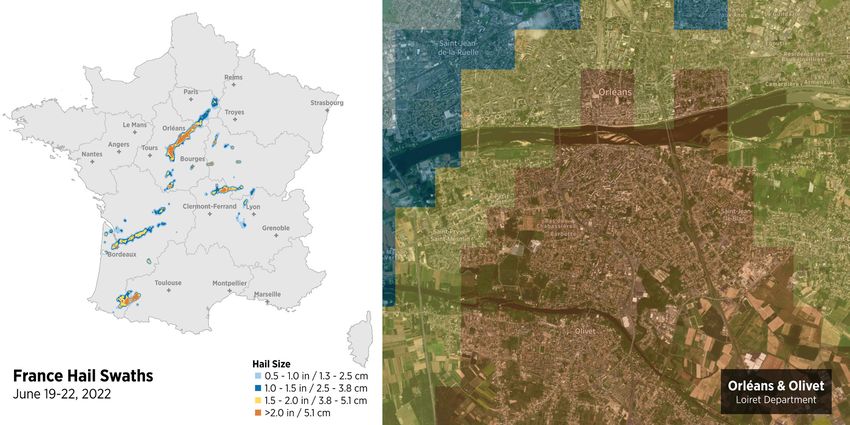
GLOBAL NAT CAT OVERVIEW

Other notable events included a series of record summer heat                          Most focus in the general public has typically been on event
waves in Europe that led to excess mortality totals into the tens of                  frequency. While it is expected that some perils may see an
thousands; a powerful March offshore earthquake in Japan; record-                     increased frequency of occurrence, the reality is that most global
setting SCS activity in France; extensive drought conditions across                   hazard event data sets do not show any obvious upward trends
South America, Europe and parts of Asia; typhoon landfalls in Japan                   beyond anomalous years that may be more influenced by the phase
and the Philippines; Hurricane Fiona landfalls in Puerto Rico and                     of El Nino Southern Oscillation (ENSO). Where climate change is
Canada; multiple strong European windstorm vents to wrap the                          currently most evident is in the behavior or intensity of individual
2021–2022 season; and an intense May derecho in Canada.                               events. This includes but is not limited to:

Role of Climate Change                                                                   • Higher percentage of tropical cyclones reaching Category 3,
The implications of climate change on daily weather and climate                            4 or 5 on the Saffir-Simpson Hurricane Wind Scale
events continues to become better understood. However, it                                • Heavier precipitation (rain/snow) per event
remains a lengthy journey in defining how confident we are in our                        • More intense and prolonged droughts
comprehension of what climate change will look like in its influence
                                                                                         • Larger, faster-moving wildfires
on individual events. New research from the academic realm has
                                                                                         • Greater extreme temperature events (hot/cold) as the
further identified how climate change is affecting the behavior
                                                                                           jet stream becomes more undulated or blocked
of individual events, but it is not a linear interpretation. There are
distinct differences on a per-peril and per-region basis. .                           Following a year in 2022 where virtually every continent on Earth
                                                                                      was exposed to some type of record-breaking weather or climate
The following graphic attempts to simplify the current confidence
                                                                                      activity, it grows more important by the day to account for the
levels in scientific research regarding how climate change is
                                                                                      physical and nonphysical risks posed by climate change. Such risks
influencing individual perils. Temperature- and precipitation-focused
                                                                                      are no longer hypothetical. They are already here.
perils are most confidently understood, but SCSs remain at the
bottom of academia’s current understanding.                                           It is also worth mentioning that there is a growing focus from
                                                                                      private financial industries on how to more effectively build
Lowest Confidence                         THUNDERSTORM                                climate change into their climate and environmental, social, and
                                                                                      governance (CESG) strategies. With the regulatory market around

                                          EXTRATROPICAL                               the world putting more emphasis on climate-related financial

                                          CYCLONE                                     disclosures or rating agencies beginning to score companies based
                                                                                      on their CESG performance, there is a growing need for financial
                                          WILDFIRE                                    firms to meet the growing demands on portfolio decarbonization
                                                                                      and carbon accounting.
                                          TROPICAL CYCLONE
                                                                                      At Gallagher Re, there is a strong emphasis to invest internally
                                                                                      and externally to build solutions that target three specific types of
Medium Confidence                         SNOW/ICE
                                                                                      CESG risk: 1) physical risk, 2) transition risk and 3) liability risk. Each
                                                                                      type of risk is a critical component within the broader CESG story,
                                          DROUGHT
                                                                                      and the time to deliver innovative solutions with these risks is now.

                                          RAIN/FLOOD

                                          EXTREME
Highest Confidence                        TEMPERATURE

Figure 1: Current confidence in climate change attribution to individual perils
Source: Attribution of Extreme Weather Events in the Context of Climate Change

                                                                                  6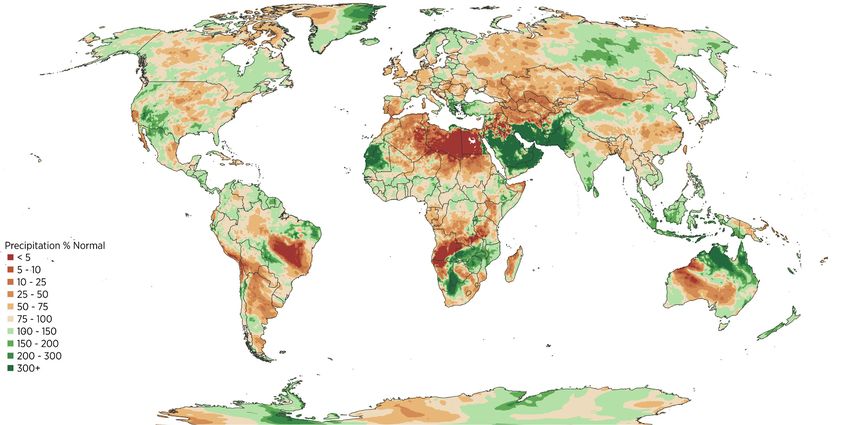
GLOBAL NAT CAT OVERVIEW

Takeaways From IPCC AR6 and COP27                                         Why Policy Reform Matters
2022 marked an important year that featured the final two                 The biggest challenge in today’s news cycle is maintaining
Working Group releases of the Sixth Assessment Report of the              positive momentum on enacting meaningful policy reforms that
United Nations Intergovernmental Panel on Climate Change (IPCC            put the world on a more environmentally friendly and socially
AR6) and a November meeting of the 27th Conference of the                 acceptable path forward. The European Union has been among
Parties to the United Nations Framework Convention on Climate             the most proactive from a policy standpoint. It notably released
Change (COP27). The aim of these high-profile facilities primarily        the European Green Deal in 2020 that legally binds countries to
focused on beginning to shift away from the identification of risk        collectively cut GHG emissions by 55% compared to 1990 levels as
to actual implementation of policy recommendations that are vital         of 2030 and achieve net-zero carbon emissions by 2050. The US,
to limit carbon emissions and subsequent temperature rises. The           the world’s No. 2 carbon emitter, passed the Inflation Reduction
sense of urgency grows as the effects of climate change become            Act in 2022, which included USD 370bn in climate change-related
more visible.                                                             funding. The US Department of Energy noted this investment
                                                                          would bring GHG emissions to 40% of 2005 levels by 2030 and
IPCC AR6: Working Group II and III Key Takeaways
                                                                          would also position the country to the goal of the goal of 50% to
  • Climate change impacts are occurring at a faster pace than            52% of 2005 GHG emissions by 2030.
     initially anticipated
                                                                          While these are merely two examples of recent policy reform, they
  • Adaptation processes are underway, but severe gaps exist
                                                                          are important to highlight. It will be key for the rest of the world’s
     between developed and less affluent economies
                                                                          largest carbon emitters to adopt similar reforms. The science is
  • Declining greenhouse gas (GHG) emissions and carbon
                                                                          clear that a warming atmosphere and oceans will bring more
     reduction policies are reducing the chance of worst-case-
                                                                          intense, impactful and costly disasters than we saw in 2022. We
     scenario warming
                                                                          will never be able to reduce the risk to life and property to zero, but
  • Climate financing and targeted funding capital will be critical       can make meaningful steps to limit it.
     to initiate meaningful mitigation/resilience efforts

COP27 Key Takeaways
  • International agreement signed to finance loss and damage
                                                                                “The US, the world’s No. 2 carbon
     initiative that requires higher greenhouse gas (GHG)-emitting              emitter, passed the Inflation Reduction
     countries to subsidize lower-income nations most affected by               Act in 2022, which included USD 370bn
     climate change despite emitting the least GHGs                             in climate change-related funding. The
  • Greater focus on accountability for goverments and private                  US Department of Energy noted this
     institutions that do not meet stated carbon goals                          investment would bring GHG emissions
  • Time to translate planning exercises into actual                            to 40% of 2005 levels by 2030 and would
     implementation of carbon reduction and climate investment                  also better position the country to achieve
                                                                                the goal of 50% to 52% of 2005 GHG
                                                                                emissions by 2030.”

                                                                      7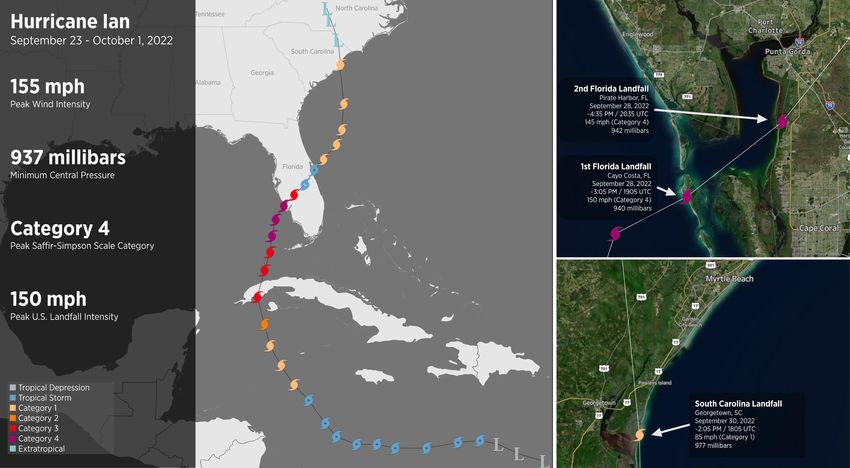
GLOBAL NAT CAT OVERVIEW

Global Natural Hazard: Notable Statistics in 2022
                                                                                                                     Europe
                                                                                                                     Per data from Copernicus, the European
                                                                                                                     continent experienced its hottest
                                                                                                                     summer on record, breaking the record
                                                                                                                     by 0.4°C (0.7°F)

                                                                                                                                                                      Pakistan Floods
                                                                                                                                                                      33 million people affected; 1,739
                                                                                                                                                                      fatalities; 2.3 million homes damaged

                                                                                                                                                                                                                                       China
                                                                                                                                                                                                                                       China Meteorological Administration
                    Hurricane Ian
                                                                                                                                                                                                                                       (CMA) noted the hottest summer on
                    150 mph (240 kph) winds at US landfall;
                                                                                                                                                                                                                                       record dating to 1961; 265 weather
                    fifth-strongest US mainland hurricane on
                                                                                                                                                                                                                                       stations set all-time heat records in
                    record based on wind speed
                                                                                                                                                                                                                                       August alone

                                                                                                                           Africa
                                                                                                                           Seasonal and annual flood-related
                                                                                                                                                                                         Sydney, Australia
                                                                                                                           death toll topped 2,000, including
                                                                                                                                                                                         2,530 millimeters (99.61 inches);
                                                                                                                           612 alone in Nigeria
                                                                                                                                                                                         wettest year on record dating to 1859

NOAA: Sixth-warmest year on record for global land and ocean       NOAA: New daily carbon dioxide (CO2) record of 422.06 parts                    US wildfires: Hermits Peak & Calf Canyon Fires combined to                     Horn of Africa: 50 million people facing food insecurity following
temperatures; 0.86°C (1.55°F) above the 20th century average       per million (PPM) on April 26, 2022, at NOAA’s Mauna Loa                       become New Mexico’s largest and most destructive fire on record;               the worst drought in decades
                                                                   Atmospheric Baseline Observatory in Hawaii                                     341,471 acres (138,188 ha); 903 structures destroyed
UK: All-time heat record of 40.3°C (104.5°F) set on July 19 in                                                                                                                                                                   India: India Meteorological Department (IMD) noted that it was the
Coningsby, Lincolnshire; previous UK record was 38.7°C (101.7°F)   Hurricane Fiona: Made landfall in Nova Scotia with a central                   May 21 Canada derecho: Traveled 1,000+ kilometers (620+ miles)                 hottest March in 122 years
in 2019                                                            pressure of 931 millibars, the lowest for a Canadian landfalling               across southeast Canada’s most populous corridor
                                                                                                                                                                                                                                 Japan: Japan Meteorological Administration (JMA) cited the
                                                                   storm on record; became the costliest hurricane in the history of
CMA: Yangtze River, the world’s third longest, reached its                                                                                        US: 236 tornadoes in March; highest number of March tornadoes                  hottest summer ever recorded dating to 1875; Tokyo recorded a
                                                                   Canada’s insurance industry
lowest summer/peak monsoon season water height in 150 years                                                                                       on record                                                                      record nine consecutive days with 35°C (95°F) temperatures
of record-keeping                                                  Hunga Tonga/Hunga Ha’apai volcano: January 15 eruption sent
                                                                   atmospheric shock waves around the globe and volcanic plume
                                                                   debris reached as high as 58 kilometers (36 miles) into the air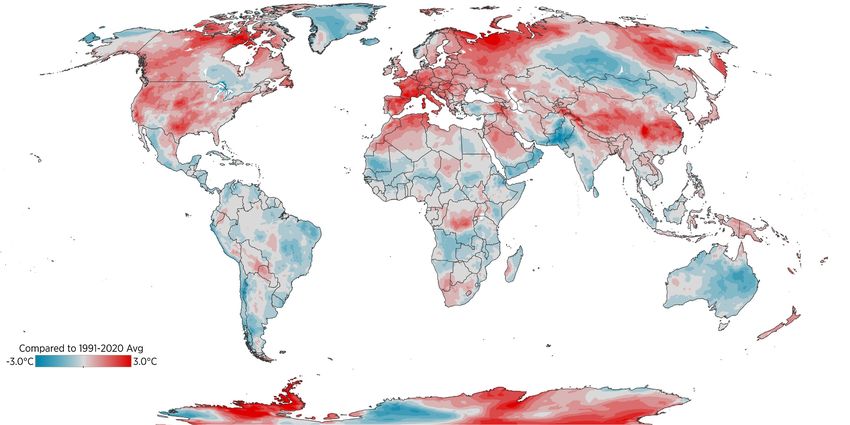
GLOBAL NAT CAT OVERVIEW

Global Natural Catastrophe Event Summary

2022 was a year marked by one exceptionally large catastrophic loss
event and many moderately large events that aggregated to high
economic and insured loss totals. Highlighting the enormity of the
event, Hurricane Ian’s economic and insured losses represented 32% and
39%, respectively, of the globe’s entire annual total. The following table
highlights the 11 events that resulted in a multibillion-dollar insured loss.

                                                                                                                                Economic Loss            Insured Loss
 Event                                          Date(s)                       Region                   Fatalities
                                                                                                                                (USD)*                   (USD)*

 Hurricane Ian                                  Sept. 27–Oct. 1               US and Cuba              137                      115bn                    55bn

 US Drought                                     Annual                        US                       N/A                      21bn                     9.0bn

 Windstorms Dudley,
                                                Feb. 16–31                    Europe                   31                       5.9bn                    4.3bn
 Eunice, Franklin

 Eastern Australia Floods                       Feb.–March                    Oceania                  22                       6.8bn                    4.0bn

 France Drought/Subsidence                      Annual                        Europe                   N/A                      8.0bn                    3.3bn

 North America Winter Weather                   Dec. 21–26                    US and Canada            91                       4.5bn                    3.1bn

 Japan Earthquake                               March 16                      Asia                     3                        8.5bn                    2.8bn

 US Severe Convective Storms                    June 11–17                    US                       3                        3.6bn                    2.8bn

 US Severe Convective Storms                    April 10–14                   US                       1                        2.8bn                    2.3bn

 US May Derecho                                 May 11–12                     US                       5                        2.7bn                    2.2bn

 Storms Petra and Qiara                         June 19–24                    Europe                   3                        2.6bn                    2.1bn

                  ~50,000                                                USD 360bn                                                   USD 140bn
            Estimated Fatalities                                           Economic Loss                                                Insured Loss

*Estimates are subject to change. Insured loss totals include private and public insurance entities (such as the U.S. National Flood Insurance Program or the USDA’s RMA Crop
Insurance Program).

Figure 2: Natural Catastrophe Event Summary | Source: Gallagher Re

                                                                                       9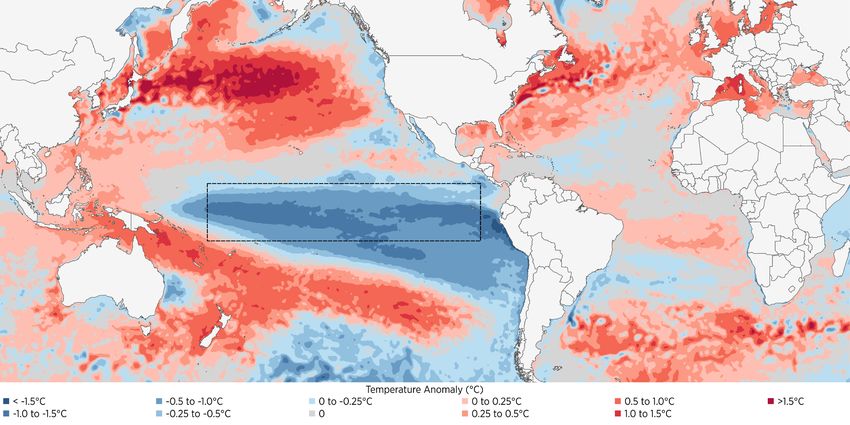
GLOBAL NAT CAT OVERVIEW

Figure 3: The last 10 years (2013-2022) of global insured losses index to today’s dollars | Source: Gallagher Re

The topic of primary versus secondary perils has taken on                                    Additional year-end natural catastrophe statistics include:
heightened significance in recent years as these so-called
                                                                                              • Top three costliest perils (economic): tropical cyclone
secondary perils—marked by higher-frequency/lower-cost
                                                                                                (USD 130bn); drought (USD 77bn); flood (USD 65bn)
events—have shown accelerating loss growth and often aggregate
to higher annual totals. Secondary perils were again the most                                 • Top three costliest perils (insured): tropical cyclone

expensive on an economic basis and exceeded those on the                                        (USD 59bn); SCS (USD 39bn); drought (USD 15bn)

insured loss side.                                                                            • Billion-dollar natural catastrophe events (economic):
                                                                                                43 (all)/42 (weather only)
 • Primary perils (Economic/Insured): USD 149bn (41%)/USD
                                                                                              • Billion-dollar natural catastrophe events (insured):
    67bn (48%)
                                                                                                20 (all)/19 (weather only)
 • Secondary perils (Economic/Insured): USD 211bn (59%)/USD
    73bn (52%)                                                                               The main drivers of large weather events in 2022 were multi-
                                                                                             faceted. The most important influencing factor on the year’s
The US accounted for 53% of global economic losses and 74%
                                                                                             weather events came from a prolonged La Niña cycle that brought
of insured losses. The country boasts the most robust insurance
                                                                                             more intense flooding and drought conditions to many parts of
market in the world and it is typically the predominant annual
                                                                                             the world. As the year ended, La Niña conditions remained active,
driver in insured losses given its regular frequency of high-dollar
                                                                                             and it was forecast to extend into a third consecutive annual cycle
catastrophe events.
                                                                                             through the first months of 2023 before transitioning to ENSO-
                                                                                             neutral and possibly to El Niño later in 2023.

Figure 4: A regional and peril breakout of global insured losses during 2022 | Source: Gallagher Re

                                                                                        10
GLOBAL NAT CAT OVERVIEW
US/Americas Record-breaking flooding swept across several regions of Africa
The largest insured loss from a single event came from and resulted in at least 2,000 fatalities. Historic flood-related
September’s landfall of Hurricane Ian. The estimated USD 55bn in insurance losses were generated in Nigeria and South Africa. On
wind- and water-/flood-related losses that were prolific across the the opposite extreme, the worst drought in decades left more
state of Florida. Ian ranked as the second-costliest natural hazard than 30 million people facing food insecurity challenges in the
event on record regardless of peril from an insurance perspective. Horn of Africa.
The only other hurricane to make landfall during the 2022
APAC
Atlantic hurricane season was Hurricane Fiona. That storm led to
Historic flooding in Pakistan led to USD 15bn in direct physical
catastrophic flooding in Puerto Rico before tracking northward
damage, with additional losses to GDP estimated at another USD
and striking the Canadian Maritimes as a strong extratropical
15bn and a societal disruption to 33 million people. Extremely
cyclone. Overall, the Atlantic hurricane season was near-average,
limited insurance takeup meant most damage was uninsured.
with 14 named storms, eight hurricanes and two major hurricanes
Flooding also led to billions (USD) in damage across parts of India,
(Category 3+).
China, South Korea and Thailand. A subdued Western North Pacific
SCS events were again considerable in the US and Canada. There typhoon season saw manageable damage impacts. The most
were at least seven SCS outbreaks (six in the US and one in notable were Nanmadol and Talas in Japan, Hinnamnor in South
Canada) resulted in at least USD 1bn in insured losses. A significant Korea, and Nalgae in the Philippines. The continent’s costliest non-
portion of the losses were due to large hail and damaging winds weather disaster was an offshore Japan earthquake on March 16
(including multiple North American derechos). Data from NOAA that led to an estimated USD 8.5bn in economic damage.
showed that the US preliminarily recorded roughly 1,200 tornadoes
Australia weathered the impacts of La Niña bringing incessant
in 2022—a near-normal tally—though a March record of 236
rainfall to the country’s east coast. One prolific event in late
tornadoes occurred. Exceptional drought conditions continued to
February and March led to an estimated USD 4.0bn in insured
affect large swaths of North and South America. Total combined
losses across parts of New South Wales and Queensland.
economic losses were estimated in excess of USD 43bn, mostly in
the US and Brazil. Extreme winter weather engulfed the US and
Canada in late December.
“During the summer months, significant
EMEA
and highly damaging hailstorms resulted
Several major weather catastrophes affected the European in more than USD 5bn in insured losses
continent, though the most deadly arose from a series of from more than one million filed claims in
intense heat waves in June, July and August that led to tens of
France alone.”
thousands of fatalities. The three months marked the hottest
summer ever recorded for Europe and exacerbated major
drought conditions that led to widespread agricultural impacts.
The year originally saw a series of windstorms in February
(Dudley/Ylenia, Eunice/Zeynep, Franklin/Antonia) that resulted
in USD 4.3bn in insured losses. The full 2022 calendar year saw
European windstorm loss exceed USD 5bn for insurers. During
the summer months, significant and highly damaging hailstorms
resulted in more than USD 5.0bn in insured losses from more
than one million filed claims in France alone.
11IN FOCUS
IN FOCUS

Hurricane Ian:
What Was Learned and What Happens Next
Hurricane Ian will long be remembered as one of the most                                     Ian became one of Florida’s costliest hurricanes on record, even
consequential hurricanes on record for the global insurance                                  after attempting to account for today’s population, exposure
industry and local residents in southwest Florida. The high-end                              (building stock), construction quality and other miscellaneous
Category 4 storm made landfall on September 28, with 150 mph                                 wealth metrics. It was also yet another tropical cyclone that
(240 kph) winds and brought upward of 15 feet (4.6 meters) of                                underwent a period of rapid intensification so near to the point of
storm surge in areas from Cape Coral to Fort Myers, Florida. Ian                             landfall. Such behavior aligns with ample peer-reviewed scientific
later crossed the Florida Peninsula and briefly emerged in the                               literature that attempts to identify a climate change signal in
Atlantic Ocean before making a final landfall as a Category 1 storm                          tropical cyclones.
with 85 mph (135 kph) winds in South Carolina.
                                                                                             For a full recap on Hurricane Ian’s meteorological background,
The economic toll from Ian was USD 112bn in the US alone and                                 historical context, findings from Gallagher Re’s on-the-ground
marked one of the costliest tropical cyclones ever recorded                                  damage survey, the role of climate change and financial
globally, regardless of peril. Public and private insurance entities                         implications, please click here.
noted that as much as USD 55bn was insured. This marked just
the second event in the insurance industry’s history to reach USD
50bn on a nominal or inflation-adjusted threshold, second only to
Hurricane Katrina (USD 99bn in 2022 terms).

                                                                                  Hurricane Ian
                                      Wind Field                                                                          Florida Rainfall

Figure 5: Track of Hurricane Ian showing its full wind field and rainfall across Florida | Source: NOAA

                                                                                        13
IN FOCUS
Ian Losses: It Could Have Been Worse
The scope of Ian’s damage footprint was extensive across the
Florida peninsula and into parts of South Carolina and elsewhere
in the US southeast/Mid-Atlantic. The prominent nature of
wind- and water-related impacts in Florida alone served as the
latest reminder of how consequential tropical cyclones can be.
This is also true in areas that are known to be most vulnerable
to this type of risk and are considered best prepared to handle
the highest-intensity events. While the damage from Ian was
considerable in Florida, it is worth noting that the loss costs and
associated damage could have been even more severe if not for a
variety of factors.
Figure 6: Comparison of old versus new roof construction on Fort Myers Beach,
Florida | Source: Arthur J. Gallagher & Co.
A ground assessment by Gallagher Re colleagues a week after
Ian’s landfall worked to determine engineering success stories
and where opportunities existed to better build in southwest
Florida. Unsurprisingly from a wind perspective, the most damage
was associated with older constructed properties prior to the
enactment of updated building codes during the past 10–15 years.
However, much of the Florida peninsula has seen anywhere from
25% to 50% of its entire housing unit stock built since 2000.
This reason alone meant that a higher percentage of homes and
commercial properties in southwest Florida were built to modern
building construction mandates required by the state to withstand
wind speeds topping 150 mph (240 kph) near the coast during Ian.
Like other recent Florida hurricanes (Michael and Irma), the wind-
related portion of damage costs from Ian will result from a high Figure 7: Higher quality construction in mid- and high-rises showed minimal wind
damage during Ian | Source: Arthur J. Gallagher & Co.
volume of minor damage that aggregates to a high number.
The photos on this page from the Gallagher Re damage survey Perhaps the biggest what-if scenario that would have resulted in
show wind-related success stories of modern construction. even higher loss costs was a landfall path into the Tampa Bay area.
Original forecasts had Ian taking such a path. Had Ian tracked 100
Another reason for Ian losses being lower centered on the speed
miles (160 km) further to the north, this would have resulted in
at which hurricane-force winds began to decay while traveling
the first major hurricane landfall for the Tampa metro area since
inland. There were considerable initial concerns that Ian would
October 1921.
maintain hurricane winds far inland and potentially impact the
Tampa or Orlando metropolitan regions. An even larger wind This part of Florida is considered one of the most vulnerable areas
field could have led to further impacts in the Miami tricounty area for tropical cyclone impacts in the world given unique underwater
(Miami-Dade, Broward, Palm Beach) as well. But in reality, Ian’s top topography (bathymetry) that can maximize the storm surge
winds weakened and the hurricane-force wind field shrank prior potential and affect a highly concentrated area with of population
to reaching those areas. The lower wind speeds helped limit the and exposure. The lack of historical hurricane activity in this part
number of wind-damaged properties and subsequent filed claims. of Florida means a greater portion of homes built prior to modern
construction requirements. If Ian had struck the Tampa Bay area,
However, as successful as properties were at withstanding
the storm-related losses would have likely been much higher.
the winds, the water component to Ian was considerable and
consequential. Storm surge inundation exceeding 15 feet (4.6 Urgent Fix to Florida’s Insurance Industry
meters) left substantial coastal damage near the landfall location
Even prior to Hurricane Ian’s arrival, the Florida insurance industry
and pushed water well inland. Heavy rains left some rivers
was under serious distress. Years of increasing natural catastrophe
above major flood stage, causing even more damage to homes,
losses combined with accelerated costs tied to claims litigation
businesses and vehicles. A report by CARFAX indicated that as
and third-party assessments that forced more than a half-dozen
many as 358,000 vehicles were damaged by Ian alone.
Florida insurance carriers to file for bankruptcy. These factors led
to skyrocketing premiums for policyholders.
14IN FOCUS
An emergency legislative session was called in December 2022 What to Expect Next
that set out to address most of the main drivers that were There continues to be concrete evidence that proper building
challenging the state’s insurance market. A bill was quickly passed codes and enforcement can limit some wind-related risks from
and signed into law. A selection of the key components of the bill catastrophic tropical cyclone events. The challenge will be ensuring
included: that all residents are given access to the proper tools to either
retrofit their homes or build to a modernized set of construction
• Elimination of assignment of benefits (AOB) practices, a
codes that consider the storms of tomorrow. To give equitable
process that allowed a third party to assess and file a claim
opportunity for everyone, there will need to be work done by the
to an insurance company on the insureds’ behalf, and then
public and private sector to guarantee available funding to aid
directly receive payment from the policyholder’s insurer
lower-income residents in improving the structural integrity of
• Elimination of one-way attorney fees in lawsuits from
their homes.
residential or commerical property claims filings
• Requires property insurance carriers to accelerate claim There also needs to be a goal of lowering the protection gap
payments and closures for these events around the world. Even mature economies
like the US have a significant portion of tropical cyclone losses
• Created the Florida Optional Reinsurance Assistance Program,
remaining uninsured, given known challenges regarding limited
which is funded with USD 1bn in state revenue to supply
flood insurance takeup or underinsurance given inadequate
property insurers a chance to buy more reinsurance protection
maximum coverage levels. As scientific research continues to
at near-market rates
suggest slower-moving tropical cyclones and more precipitation
• More requirements to qualify for a Citizens Insurance policy,
accompanying these events, the water-related damage
including the purchase of flood insurance.
component is likely to accelerate.
It will take time to determine whether the bill will be effective
The insurance industry remains in a unique position to be able
in stabilizing the market. There are some concerns regarding
to bring together various governmental, academic, emergency
consumer protection and whether premiums will decline following
manager and financial institutions to collectively establish
two years of significant growth. The rising premiums were seen
insurance products or communication channels to identify,
as required to properly price the risk and ensure the solvency of
mitigate and adapt against future higher-impact events.
carriers. The increased difficulty for insureds to be able to file a
lawsuit against their insurer will also be an issue to monitor, to
determine whether any loopholes exist in the new law that may
not limit litigation costs as much as originally hoped.
15IN FOCUS
The Role of (Social) Inflation on
Natural Disaster Costs
Natural catastrophe losses have shown consistent annual growth Another contributing factor of global inflation has been the
in recent decades, with data showing that 2022 became the fifth multiyear rise in home and property values. Higher home prices
out of the last six years (2017, 2018, 2020, 2021, 2022) to result in combined with elevated prices for construction materials and other
at least USD 100bn in insured losses. Gallagher Re cites the 2022 commodities mean the cost to repair or replace a home is much
insured loss tally at USD 140bn. The primary driver of the increase greater than it was even five years ago.
has been well documented in peer-reviewed research as being tied
The US Census Bureau noted that the average single-family home
to significant population and exposure (property) growth in highly
sale price was USD 425,000 in January 2017 but had increased
vulnerable regions around the world. This means that losses are
33% to USD 565,000 in July 2022. In an effort to cool this growth,
typically location driven, and natural catastrophes cause the most
government financial entities around the world raised interest
damage when they impact developed or heavily urbanized areas.
rates, which in turn caused mortgage rates to spike throughout
When combining exposure concerns with the reality of more 2022. These actions did ease the rate of monthly home value
intense weather events due to climate change enhancing the growth. But the fact remains that the higher cost of home and
behavior of individual events, it only further adds to the resultant other property values alone has aided, in some cases, a double-
damage and subsequent physical or indirect nonphysical digit percent increase to an individual paid insurance claim.
financial losses. These higher losses are adding notable strain
Similar issues surround the automotive market, where a lack of
to governmental entities, residential and commercial property
inventory due to prolonged microchip shortages and factory
owners, the insurance industry, and beyond.
part availability led to skyrocketing costs. The part shortages not
Inflation and social inflation are also notable factors adding to only resulted in a backlog of new car orders, but huge spikes in
these increased natural disaster costs, and are now driving a the global average cost of used vehicles. The US Bureau of Labor
non-negligible portion of catastrophe losses annually. The focus Statistics highlighted a 57% increase in the consumer price index
of this piece will be primarily on the insurance industry and for used cars and trucks between June 2020 and January 2022 in
insured losses, but the broader points are applicable to the overall the US alone. As global inflation levels began to ease in November
economic cost of individual events. and December 2022, the cost of used cars also declined slightly,
but remained historically high.
Inflation
The impact of inflation dominated headlines around the world Inflationary pressure has not only put strain on primary insurance
in 2022. There were many variables driving some of the highest carriers through higher claims costs, but also the reinsurance
inflation in decades for most regions of the globe, including but sector. Reinsurers cited elevated costs associated with access to
not limited to the residual impacts of COVID-19, supply chain capital, which in turn fueled one of the hardest contract renewal
disruption and energy implications from the conflict in Ukraine. cycles on January 1, 2023, in many years. The cyclical nature of a
All of this coincided with elevated natural catastrophe activity. For hard reinsurance market due to more expensive and higher-volume
the insurance industry, all these variables contributed to driving up claims payouts from natural disasters, geopolitical tensions,
the overall cost of filed and processed claims. While supply chain inflation, etc., means that premiums at the policyholder level also
concerns and the cost of labor supplies were declining by the faced a price reevaluation to ensure insurance carrier solvency and
end of 2022, they were still juxtaposed by increased costs—due the health of the broader market.
to a lack of available labor—and higher supply prices, driven by
increased demand.
16IN FOCUS
Data from the International Monetary Fund to the right highlights Global Inflation (Annual % Growth)
the annual growth rates of inflation on a global level. It shows By Economy Type
the continued differences of inflation depending on whether a
market economy is more advanced, emerging or developing, and
unfortunately indicates that the most vulnerable populations to
natural catastrophe and climate change risk are also those with the
most fragile economies.
Social Inflation
The acceleration of natural catastrophe loss costs can also be
attributed to the concept of social inflation. This can broadly be
defined in the insurance industry as the rise of claims costs for
reasons beyond general inflationary parameters. Primary examples
would involve claims litigation, third-party claims designations
(assignment of benefits) or other liability issues. These factors have
taken on enhanced influence in recent years, which has greatly
added to final claims values. Many of these litigation cases involve
fraudulent claims filings.
By Region
Issues surrounding the greater percentage of insurance claims
being taken to court not only bring greater financial burden, but it
prolongs the loss development of individual events. In the case of
Hurricane Irma, which made landfall in Florida in September 2017,
lawsuits were still in active trial phase more than five years later.
Florida is a unique example since it has driven an outsize portion
of claims litigation in the US. Such litigation exceeded USD 3bn in
the state during 2019 alone. A recent commentary by Fitch Ratings
noted that “[c]laims inflation has yet to be pushed up by social
inflation or general inflation but we expect this to change in 2023,
with negative implications for underwriting margins and reserves.
Underestimating claims inflation for liability lines is one of the most
significant risks for reinsurers.” This could have particular influence
on global underwriting performance and reinsurer earnings.
The following graphics show how the state of Florida has driven
a significant portion of claims litigation in the US, which has in
turn led to significantly increased homeowner premium rises Figure 8: Annual rate (%) of global inflation by economy type and region of the world
as insurers have been forced to filter these costs down to the Source: International Monetary Fund
policyholder. This also shows that despite accounting for just 9%
of homeowner claim filings, the state makes up nearly 80% of all
lawsuits in the US.
Figure 9: Various data points highlighting Florida’s notable lead in US claims litigation and premium costs | Source: Florida Office of Insurance Regulation; National Association
of Insurance Commissioners; Insurance Information Institute
17IN FOCUS
What Comes Next? The diversification or divestment of portfolios, in addition to
The challenge is how the reinsurance industry balances the determining the insurability for various perils in different parts of
continued effects of inflation, social inflation, elevated supply the world, will need to be an essential piece to strategic planning
costs, and other variables today and in the future. There will for the insurance industry and other financial institutions. The
inevitably be market adjustments to ensure solvency for the nonphysical piece of climate risk can feature losses from business
broader industry and individual companies as the quest for interruption or costs associated with transitioning away from a
affordable capital takes on more urgency. The risks and costs fossil-fuel-driven balance sheet. Reputational risk from doing the
associated with litigation and liability will only become more bare minimum is also an important metric to keep in mind.
pronounced if more steps are not taken to add more protections
With a rapidly evolving regulatory environment and an
for the industry and its consumers. The state of Florida has
increasing push for climate-related disclosures, there are
already enacted some meaningful reform; and more details can
growing mandates that will push global and regional insurers to
be found in the Hurricane Ian focus section of this report.
take better account of how future climate scenarios will affect
The overarching near- and long-term risk will inevitably come their bottom lines. Solvency is key. Rating agencies are also
in the form of climate change. Scientific consensus continues to beginning to score how financial institutions are implementing
show how the behavior of weather and climate-related events are CESG into their business operations.
growing more intense and, with some perils, more frequent. While
There will inevitably be new variables that test how we handle
most current focus is on the physical risk aspect to climate change,
the increased cost of natural catastrophes. Inflation is the biggest
the impacts extend well beyond whether or not an event leads to
challenge today. How we implement our lessons learned from
direct damage. As companies seek to better understand the future
today’s environment will be critical to how we handle the next
implications to their portfolios—as well as meet established carbon
hurdle tomorrow.
emission reduction goals—it will be critical to fully quantify and
qualify risk.
18IN FOCUS
La Niña’s Impact on Natural Catastrophes
A “triple-dip” La Niña marked the end of 2022. This unusual
event meant that cooler than average sea surface temperatures What is ENSO?
(SST) were present in the equatorial Pacific Ocean during three The El Niño-Southern Oscillation (ENSO) is a pivotal
consecutive Northern Hemispheric cold seasons (December seasonal climate phenomenon as it affects large-scale
to March). This was the third such occurrence of a triple-dip La atmospheric and ocean circulations that influence global
Niña in the National Oceanic and Atmospheric Administration’s temperature and precipitation patterns. ENSO is a
(NOAA) 73-year record. Since September 2020, La Niña recurring oscillation involving changes in the temperature
conditions have modified global atmospheric and oceanic of waters in the central and eastern equatorial Pacific
patterns, with short interruptions toward an ENSO neutral phase. Ocean (170°W to 120°W longitude and 5°N to 5°S
While no two La Niña cycles are exactly alike, these conditions are latitude). Warming periods are noted as El Niño cycles,
associated with amplified regional extremes of temperature and while cooling periods are known as La Niña cycles. The
precipitation. La Niña years have historically generated elevated ENSO footprint historically had the greatest influence
losses for the reinsurance industry principally due to amplified during the Northern Hemispheric winter months
impacts in developed nations. These include a greater frequency (December to March). The Niño-3.4 Index, which measures
of Atlantic tropical cyclones, southern US SCSs and Australian the temperature of ocean waters in the tropical Pacific
floods, among others. Ocean, is used to determine ENSO phases and cycles. It is
important to note that to be considered in an ENSO phase,
NOAA requires five consecutive three-month running
mean averages of SST anomalies in the Niño-3.4 region to
be +0.5°C (El Niño) or -0.5°C (La Niña).
Niño 3.4 (5°N-5°S, 120°W-170°W)
Sea Surface Temperature Anomalies
Figure 10: Monthly sea surface temperature anomalies in the Pacific Ocean’s Niño-3.4 region dating to 1950 | Source: NOAA Climate Prediction Center
19IN FOCUS
La Niña Influence in 2022 Australia after incessant rains continued in October and November.
Large-scale atmospheric circulations associated with La Niña During this latter period, rainfall patterns were further affected by
include rising air in the western Pacific, which aids in increased the negative phase of the Indian Ocean Dipole (IOD), an oscillation
storminess and rainfall. In 2022, this had a marked influence of SSTs in the western Indian Ocean. A negative IOD likewise
on heavy rain and subsequent flooding in eastern Australia. enhances rain across much of Australia and southern Africa. The
Catastrophic inundation in late February and March resulted in an IOD typically peaks in intensity between the months of October
industry loss of at least USD 4.0bn. Additional significant events to December. According to data from the Australian Bureau of
and catastrophes were declared by the Insurance Council of Meteorology (ABOM), in 2022 Sydney saw its wettest calendar
year since records began in 1859.
Figure 11: (Left) Total aggregated rainfall across Australia in 2022; (Right) Daily rainfall totals at Sydney and showing a new annual record for the city
Source: Bureau of Meteorology
Concurrently, last year was marked by wetter than usual episodes, upper levels of the atmosphere). According to the United States
augmented by La Niña, in regions of northern South America and Drought Monitor, in July 2022 the western US saw the most
Southern Africa, in tandem with more persistent monsoonal rainfall expansive percentage of land affected by the highest category
in southeast Asia. In Africa, despite exceedingly low insurance (“Exceptional Drought”) since data collection began in 2000.
penetration in Nigeria, seasonal flooding damage in Q3 alone Severe drought conditions continued to impact vast regions of the
was expected to minimally reach USD 4.5bn, a significant loss West throughout 2022, while expanding in the Southern Plains and
for the national economy. Across southern Africa, research has Mississippi Valley. Elsewhere, severe drought persisted in the Horn
demonstrated the duration of the rainy season is extended in La of Africa and southern South America, notably in Brazil’s southern
Niña years and shortened in El Niño years. Flooding in parts of growing regions.
Africa was further exacerbated by expanding urban populations
and inadequate infrastructure.
In Asia, Pakistan was deluged by the most severe flooding in recent
history between July and October. The Pakistan floods, most
impactful in the provinces of Sindh and Balochistan, generated
physical damage losses of nearly USD 15bn, and resulted in a
humanitarian emergency. The situation was worsened by above-
average temperatures and melting glaciers.
La Niña tends to be a component of sustained drier and milder
Figure 12: Visualization showing ocean and atmospheric circulation patterns during
conditions across the southwest US. This occurs due to a westward La Niña | Source: NOAA
and northern shift in the jet stream (a band of strong wind in the
20IN FOCUS
Figure 13: SST anomalies for January–December 2022 (°C) compared to the 1991–2020 averages. | Source: Copernicus/ECMWF/ERA5
In the tropics, La Niña can result in weaker vertical wind shear Looking ahead, models are trending toward a transition to ENSO
and trade winds in the Caribbean and eastern Atlantic. This has neutral and perhaps El Niño conditions by Q2 and Q3 of 2023. If
the potential to enhance basinwide tropical cyclone activity. realized, the redevelopment of El Niño would increase concern
Simultaneously, tropical cyclone activity can be suppressed in regarding heat and bushfires in Australia, and tropical cyclones
the Pacific. However, intra-seasonal variability and other drivers, in the Western North Pacific. While not always the case, a rapid
such as the Madden Julian Oscillation, an eastward progression swing from La Niña to El Niño can be troubling as regional
of enhanced and surpressed tropical rainfall, play a crucial role in weather patterns abruptly change from one extreme to another.
tropical cyclone development and forecasting. Overall, the mean climate of the tropical Pacific is anticipated to
continue changing in the coming century as a consequence of
Higher catastrophe risk during La Niña years, especially in
GHG emissions, peer-reviewed research showed an increased
established markets, is anticipated to build demand for reinsurance
likelihood in the frequency of extreme El Niño events and a
offerings and could boost interest in nonconventional structures,
higher overall frequency of La Niña events.
such as parametrics triggers and covers.
21IN FOCUS
Heat and Drought:
The Underestimated Perils of 2022
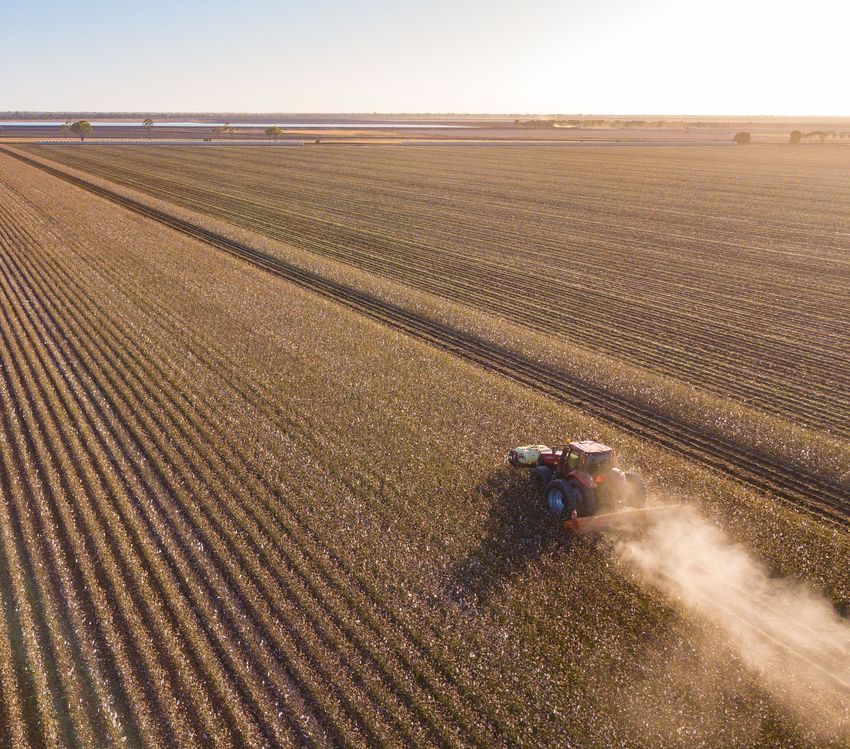
Prolonged and record-breaking heat waves in tandem with below- Drought and heat were critical components in increased supply
average precipitation resulted in regionally elevated drought chain challenges, electrical grid stress, escalating food insecurity,
conditions around the globe in 2022, with notable events occurring business and shipping disruptions, and enhancing humanitarian
across Europe, western North America, southern South America, crises, particularly in less developed nations. High temperatures
Mexico and China, among other locations. The total economic cost and abnormally dry conditions were anticipated to remain costly
of global drought events approached USD 80bn, with some of natural hazards for the reinsurance industry in the coming decades,
the most consequential totals seen in the US, Brazil and France. enhanced amid continued GHG emissions.
Figure 14: Average temperature comparison during June/July/August 2022 versus the 1991–2020 climatological norm | Source: Copernicus/ECMWF/ERA5
Drought was markedly concerning in Europe, as successive heat 2019. Preliminary estimates based on Gallagher Re analysis of
waves built across the continent between June and August. The country-level excess mortality statistics, which determined totals
relentless heat and dry conditions resulted in financial impacts by subtracting from recent decadal averages and COVID-19 spikes,
to agriculture, infrastructure and commerce. According to the suggested that as many as or more than 40,000 excess deaths
Intergovernmental Panel on Climate Change, there is high may be attributed to the extreme heat across the continent during
confidence that elevated agriculture production losses, compared the summer months. Heat wave mortality was amplified in urban
to the long-term average, will continue across much of Europe areas and locally exacerbated by lack of sufficient cooling systems,
throughout the 21st century due to influences from heat and especially at higher latitudes.
subsequent drought. These losses will be further amplified under a
Wildfires, fueled by dry conditions, were ignited amongst many
warming climate.
regions of Europe and the Mediterranean, with notable events
Amid a multitude of felled high temperature records, the UK set an in France, Greece, Portugal and Spain. In Italy, water levels along
all-time heat record of 40.3°C (104.5°F) on July 19 in Lincolnshire, spans of the Po River, the country’s longest river, ran several
beating the previous country record of 38.7°C (101.7°F) set in feet below hydrometric zero, stressing regional crops and
drinking water.
22IN FOCUS
In China, data collected by the Beijing Climate Center showed In the Pantanal, the world’s largest tropical wetland, which spans
that heat events in the summer of 2022 were the strongest since parts of Brazil, Bolivia and Paraguay, a marked increase in wildlife
reliable records began in 1961, metrics were calculated in terms activity in recent years considerably influenced the abundant
of intensity, impacts and duration of heat. Hundreds of recording biodiversity of animal and plant species. The out-of-control
stations, primarily in Hebei, Shaanxi, Sichuan, Hubei, Jiangsu, fires, fueled by abnormally dry conditions and above-average
Zhejiang, Fujian, Guangdong and Qinghai, reached or exceeded temperatures, were primarily of anthropogenic origin and intended
their historical maximum temperature. The prolonged drought to clear land for agriculture.
conditions had widespread impacts on agriculture, energy
In North America, expanses of the US, principally in the West and
and provincial supply chains. Amplified stress on the country’s
Southern Plains, continued to endure intense drought conditions
electrical grid prompted power curbs across the most affected
in 2022. The US government’s NOAA agency noted that drought-/
regions, closing factories and leaving residents temporarily in the
heat-related economic losses were at least USD 21bn. In Q3,
dark, notably in and near Shanghai.
drought spread across the US Mississippi Valley. By October 22,
In South America, a multiyear drought centered on the La Plata the river gage along the Mississippi River at Memphis, Tennessee,
Basin continued in 2022. In terms of economic losses, Brazil’s reached a record low of -10.76 feet (-3.28 meters), falling below the
Rio Grande do Sul state experienced one of the worst droughts previous low record from 1988 (meaning the gage dropped below
in at least the last century, according to the state secretary of an agreed-upon zero level).
agriculture. More than 85% of municipalities in the state declared a
Dry conditions concurrently impacted western Canada and
state of emergency due to drought by September. The Rio Grande
northern Mexico. In Mexico, a peak 55% of the country experienced
do Sul government cited that economic damage in the state alone
drought conditions simultaneously by the beginning of May,
was USD 7.5bn. Nationwide, 2022 was a challenging year for the
according to data from the North American Drought Monitor. The
industry in Brazil due to the severity of the drought and large
drought was an important driver in severe water shortages in the
volume of agribusiness claims.
city of Monterey and surrounding localities.
Figure 15: Precipitation totals in June/July/August 2022 as compared to the 1991–2020 climatological norm | Source: Copernicus/ECMWF/ERA5
23IN FOCUS
Consistent with the Intergovernmental Panel on Climate Change For example, innovative at-scale and country level-based
findings, without near-term adaptation, reduced overall yields insurance schemes are being applied across the African
in crops and livestock production are projected to persist continent to strengthen financial resilience in the face of
across North America in coming decades, when compared accelerated drought-driven agriculture and crop losses, as well
to historical averages. This will be amplified in drought-prone as complex political environments.
and rain-dependent regions and not expected to be offset by
Drought and the closely related heat wave and wildfire perils will
favorable long-term conditions in parts of the US Great Plains
continue to present amplified challenges to the global reinsurance
and Northwest.
industry, with an emphasis on crop insurance, business interruption
Agriculture producers should be proactive in mitigating risk coverage, and life and health insurance. In recent years, drought
by being mindful of soil health, employing water conservation alone generated an increasingly larger percentage of global
practices, making smart crop choices and enrolling in agriculture or insured losses than was represented in longer-term averages.
crop reinsurance programs. At Gallagher Re, our global agriculture
team offers specialist expertise, custom technology and local
knowledge, which can aid insurers to better understand their
exposures and manage volatility.
24IN FOCUS
The Capital Challenge in Natural Catastrophe
While there was sufficient capacity to meet the reinsurance needs While Gallagher Re does not have data detailing the capital
of cedants at 1.1, it is also true that the amount of reinsurance allocation to natural catastrophe coverage, our einsurance
capital being deployed was diminished in 2022. Cedants were, by market report, published twice a year, demonstrated a clear drop
and large, able to secure their required limit, but it came at a price. in total reinsurance dedicated capital for half-year 2022 (Figure
16) and illustrated the contribution of cat losses to the combined
There was a clear desire from reinsurers to force change onto
ratio for the subset of reinsurers which provide that disclosure
the market at the most recent renewals: pushing retentions up
(Figure 17).
and restructuring programs to improve profitability for 2023
and beyond. However, the drivers of the drop in capital go beyond the runrate
of losses from natural perils, and include macroeconomic factors,
the impact of the reinsurance hard market, regional considerations
and a greater scrutiny of models by reinsurers.
Total Industry Capital Decreased by 11% in HY 2022
Total Reinsurance Dedicated Capital (USD billions)
Figure 16: Total annual reinsurance capital (2015-2021) and HY 2022 | Source: Gallagher Re
25You can also read