Gauging U.S. Recession Risk - Equifax Investor ...
←
→
Page content transcription
If your browser does not render page correctly, please read the page content below

ECONOMIC TRENDS COMMENTARY

Gauging U.S. Recession Risk

Amy Crews Cutts                We are frequently asked when the U.S. might enter into a recession. In fact,
SVP-Chief Economist            we spent a good bit of time recently considering how we could tell whether a
Gunnar Blix                    recession might be imminent, something more than a gut feeling that it must
Deputy Chief Economist         be time for one. Though turning points are hard to know with any confidence,
                               in this study we will walk through some of the concerns surrounding the timing
                               of recessions, and what Equifax Credit Trends data might tell us about
AUGUST 2017
                               whether current conditions warrant worry.

                               Up and Down Cycles
                               Recessions — or, more broadly, business cycles — seem to occur on a somewhat
                               regular cycle. Except that they don’t. The National Bureau of Economic Research
                               (NBER) is responsible for determining the start and end dates of U.S. recessions.
                               NBER1 has recognized that since 1854 there have been 33 recessions, with an
                               average length of 17.5 months of contraction. The average expansion (the period
                               between the end of one recession and the start of the next) has been 38.7 months,

                               1   This report has hyperlinks to cited data and studies for easy reference. The NBER recession data are
                                   available at http://www.nber.org/cycles/cyclesmain.html (accessed June 13, 2017)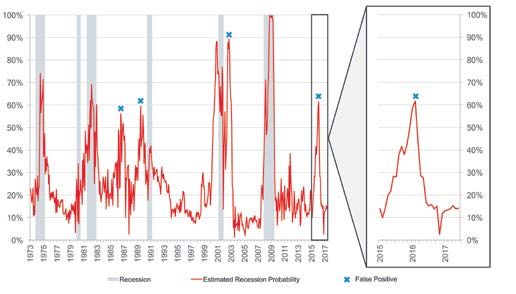
or just over three years. More recently, in the post WWII era, recessions have
shortened to an average 11.1 months and expansions have lengthened to an
average of 58.4 months. And, since 1982, the three recessions have averaged 11.3
months, including the Great Recession, and the four expansions, inclusive of the
current one, have averaged more than 96 months and counting.

Chart 1 shows the recessions and expansions recorded by the NBER. The era of the
Federal Reserve System (the Fed) started in December 1913. The dual mandate of
the Fed is to maximize employment and to stabilize prices (moderate inflation). The
first mandate has resulted in much longer expansions prior to recessions and, with
the exception of the Great Depression from 1929-1933, much shorter contractions.

CHART 1

Length of U.S. Business Cycle Expansions and Contractions Since 1854

Source:
Equifax, National Bureau of Economic Research, Federal Reserve Board of Governors. The Federal Reserve System was created in December 1913.
Data reported as of July 2017.

                                                                           2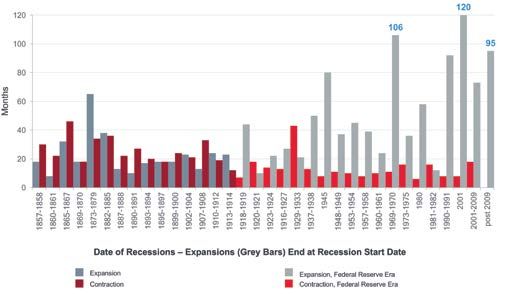
The economic growth rate during expansions, however, is slowing. Chart 2 shows
our calculations on the average annual growth in real GDP for the post WWII period2.
Notably, the current expansion and the one that ended with the start of the Great
Recession both had growth rates below 3.2 percent, the average annualized growth
rate from the post war period, including recessions. We may be in the eighth year of
the expansion, but it hasn’t felt like the economy is on firm footing. Two-point-one
percent growth is hardly worth getting excited about.

CHART 2

Real GDP Cumulative Annualized Growth Rate for Post-WWII U.S. Economic Expansions

Source:
Equifax, Bureau of Economic Analysis, National Bureau of Economic Research; Data as of July 2017.

Consumers Doing Their Part
Many people have stated, “We’re due for a recession,” based solely on the fact that we haven’t had one in a while. But that really
isn’t how recessions work. Economic growth, as measured using gross domestic product, is the sum of:

Y=C+I+G+X-M
GDP = Consumption + Investment + Government Spending + Net Exports (exports minus imports)

2   Data on real GDP and its component parts used in Charts 2 and 3 are from U.S. Bureau of Economic Analysis, “Table 1.1.6. Real Gross Domestic Product,
    Chained Dollars,” https://www.bea.gov/iTable/iTable.cfm?ReqID=9&step=1#reqid=9&step=3&isuri=1&903=3 (accessed July 17, 2017)

                                                                              3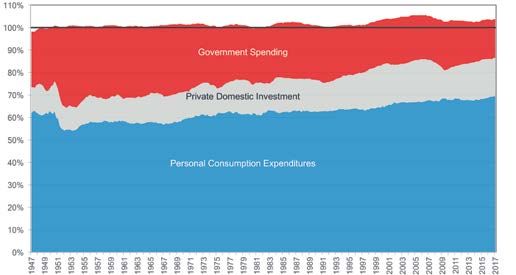
C – Personal Consumption Expenditures – What consumers spend on goods
and services. Consumption currently makes up 69% of real GDP, so the consumer
sector is the most important element. This is the blue segment in chart 3.

I – Private Domestic Investment – What consumers and businesses invest in new
assets like factories, mines, homes, software, equipment, etc. It does not include the
exchange of existing assets or investment in stocks and bonds. Private investment
represents 17% of real GDP today, shown in gray in chart 3.

G – Government Spending – What federal, state and local governments spend on
goods and services, not including transfer payments such as social security benefits
or unemployment benefits. Government spending also represents roughly 17% of
real GDP. Government spending is shown in red.

X-M – Net Exports – Goods and services produced in the U.S. and sold in other
countries, less goods and services imported into the U.S. Currently the U.S. is
importing more goods and services than it exports, with net exports representing a
negative 3%. This is shown in chart 3 as the portion above the line at 100% when
exports are less than imports.

CHART 3

Major Segment Contributions to Real GDP

Source:
Equifax, Bureau of Economic Analysis. Deviations around 100% represent the contributions of net exports. Data as of July 2017.

                                                                               4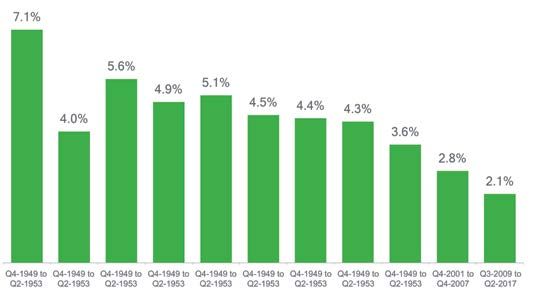
When economists speak of “real” GDP they mean the current dollar value of GDP
— the so-called nominal GDP, divided by the GDP price deflator index — which
removes the effects of aggregate price inflation from the picture.

Recessions occur when the aggregate real growth rate is negative for two or more
consecutive quarters, taking into account other economic conditions used by the
NBER Recession dating committee. That means either consumers must modestly
cut back, or investment or government spending has to decline markedly.

The recent downturn in energy and metal commodities temporarily impacted
investments in mining equipment, and dented private investment overall, but they
both have since rebounded. Government spending is down relative to where it
was during the end of the recession and the early part of the recovery, but as
property values rise, so too does local government spending, and federal spending
cuts have ceased for the moment. Unlike 2005-2008, there do not seem to be
speculative bubbles forming in any large asset classes. So we can conclude from a
data standpoint that there is little indication that the major contributors to real GDP
might be at risk today.

Okay, But Do Expansions Die of “Old Age?”
Researchers at the Federal Reserve Bank of San Francisco (FRBSF)3 looked at
this question and concluded that, no, recessions don’t have a higher likelihood of
occurring simply because it has been “a while.” To put this in context, we might think
of a repeated game, like a coin toss (a 50% chance per side) or a die being thrown
(1/6 chance of any side being on the topside). With each toss, the probability that
the coin comes up heads, H, is the same regardless of how many times the coin has
been tossed in the past, and similarly the likelihood that a 6 appears on of top of the
die is the same with each toss.

But what about the chances of getting no tails on the coin in the next four tosses?
That is H-H-H-H? That probability falls to just 6% from 50% on each individual toss,
calculated as 0.5*0.5*0.5*0.5 = 0.0625. It works the same for the die. What if you
roll the die four times and never get a 6? With the chance of a 6 coming up on top
at 17% for each roll, the chance for any other side is 83%. So the likelihood of not
seeing a 6 in four tosses is 0.83*0.83*0.83*0.83 = 0.48, a 48% probability.

What about recessions? Absent any particular event that might make a recession
more imminent, the probability of a recession over the next 12 months was put at
23% by the FRBSF economists, meaning we have a 77% likelihood of continued
expansion for the next year. Each year is like a new coin toss. The FRBSF
researchers would place the chance of surviving two rounds of recession roulette
at 59% (0.77*0.77), just 46% after three, falling to 36% after four spins.

3   Rudebusch, Glenn D. (2016) “Will the Economic Recovery Die of Old Age?” FRBSF Economic Letter (2016-03, February 4, 2016)
    http://www.frbsf.org/economic-research/publications/economic-letter/2016/february/will-economic-recovery-die-of-old-age/ accessed July 14, 2017

                                                                             5
Each month, the Wall Street Journal conducts a survey of leading corporate and
academic economists, and in it asks respondents to predict the likelihood of the
U.S. entering a recession in the next 12 months. In chart 4 we show how these
forecasts have evolved over the past 16 months. In the July 2017 survey4 average
probability is 16%, down a bit from the probability estimated by the FRBNY
researchers almost two years ago.
CHART 4
The Wall Street Journal’s Economic Survey Recession Probability Forecasts
Source:
Equifax, Wall Street Journal.
But What About Leading Indicators?
Leading indicators can give some warning that a turning point is coming. These
are measures correlated with economic performance that react earlier than the
overall economy to changing conditions. Corporate bond spreads and the slope
of the Treasury yield curve (that is, the term spread) are two financial indicators
that are especially informative about the likelihood of an economic downturn over a
medium-term horizon. One reason for this purely statistical result is that those yield
spreads — like all financial asset prices — are forward-looking variables, and thus
they contain important information about the real economy. For example, the term
spread is a useful summary of the current stance of monetary policy (relative to
long-run expectations), which, of course, has an important effect on macroeconomic
4 Economic Forecasting Survey, Wall Street Journal , http://projects.wsj.com/econforecast/#ind=gdp&r=20, accessed July 17, 2017
6outcomes. Credit spreads, on the other hand, may anticipate future economic
activity because they incorporate investors’ expectations of future corporate
defaults, which affect the business sector’s profits, employment, and investment.
A recently introduced (in 2012) measure for predicting the likelihood of an
NBER-dated recession occurring over the next 12 months is investor sentiment
or risk appetite in the corporate bond market — the so-called excess bond premium
(EBP). The measure is complicated to estimate, but is well described in this Federal
Reserve FEDS Note5 and this FEDS Note Update 6. Luckily for us, the interpretation is
rather straightforward as a straight-up probability. Chart 5 plots the EBP from
1973 through June 20177.
CHART 5
Excess Bond Premium Method of Estimated Probability of Recession
Source:
Equifax, Board of Governors of the Federal Reserve System; Data through June 2017.
In early 2016 the EBP probability of recession spiked to over 60% based on weak
corporate profits reports in January and February. It has since fallen, landing at
a fairly steady 12% since September of last year, indicating the model produced
a false positive indicator of recession, as it has on three previous occasions.
Importantly, the model does reflect the heightened market volatility since the end
of the Great Recession.
5 Favara, Giovanni, Simon Gilchrist, Kurt F. Lewis, and Egon Zakrajsek (2016). “Recession Risk and the Excess Bond Premium,” FEDS Notes. Washington: Board
of Governors of the Federal Reserve System, April 8, 2016, http://dx.doi.org/10.17016/2380-7172.1739 (accessed July 17, 2017)
6 Favara, Giovanni, Simon Gilchrist, Kurt F. Lewis, Egon Zakrajšek (2016). “Updating the Recession Risk and the Excess Bond Premium,” FEDS Notes.
Washington: Board of Governors of the Federal Reserve System, October 6, 2016, https://doi.org/10.17016/2380-7172.1836 (accessed July 17, 2017)
7 Data for the EBP series are updated monthly and made available by Fed staff at
https://www.federalreserve.gov/econresdata/notes/feds-notes/2016/files/ebp_csv.csv (accessed July 17, 2017)
7Two interpretations of this measure are offered by the FEDS notes cited above. One
possible mechanism linking investor sentiment and the real economy is related to
the way investors update their beliefs in light of incoming data. In particular, investors
may over-react to the most recent news and thus assign excessive weight to future
outcomes that have become more likely in view of recent data. For example, after
a few years of economic expansion, investors may become complacent about
default risk, an attitude leading to a compression in credit spreads, a loosening
of other credit terms and standards, and a surge of issuance of credit to very risky
borrowers. In such an environment, the sudden arrival of a string of unfavorable
economic news may lead investors to revise disproportionally their assessment of
recession risk, thus amplifying the widening in credit spreads. This reasoning implies
that investor psychology can itself be a cause of volatility in credit and investment,
even in the absence of significant changes in economic fundamentals.
Another possible mechanism linking fluctuations in credit market sentiment to
economic outcomes is related to changes in the supply of credit. Large unlevered
institutions such as mutual funds, insurance companies, and pension funds have
become in recent years the main domestic investors in the corporate bond market
and account for 50 percent of outstanding issues. Foreign investors make up
another 40 percent8. These institutions effectively act as a marginal investor in a
wide range of financial markets. To the extent that real and financial disturbances
affect their willingness or ability to fund the provision of new credit, the resulting
tighter financial conditions may exert a significant drag on future economic
growth, dynamics consistent with the standard financial accelerator mechanisms
emphasized by former Fed Chairman Bernanke and others.
So, the EBP may respond to demand dynamics and investor over-reaction or to supply
dynamics. For the moment, the measure is reassuring that recession risk has ebbed.
What Does Equifax Credit Data Indicate About
Recession Risk?
Because it is so hard to recognize turning points as they happen, looking at more
types of data can be helpful in forming a conclusion. One indicator of possible
We conclude that today
weakness is lowering of credit standards, a sort of race to the bottom in the hopes there is no indication of
of capturing greater market share. One metric to consider is the trend in credit
scores of newly originated loans. With the recent overhaul of the Credit Trends a meaningful weakening
database9, we can look at the VantageScore ® 3.0 credit score10 distributions for
various tradelines. In charts 6A through 6H, we plotted the 10th and 25th percentile
of credit standards with
VantageScores for each major tradeline type covered by Credit Trends: Auto loans, respect to credit scores.
credit cards, consumer finance, mortgage, home equity and student loans. The data
span July 2005 through June 2017. We conclude that today there is no indication of
a meaningful weakening of credit standards with respect to credit scores. Moreover,
for some tradelines, credit standards are getting tougher.
8 See Verma, Sid, “There’s Basically No Alternative to U.S. Corporate Bonds Right Now,” August 25, 2016, Exhibit 2
https://www.bloomberg.com/news/articles/2016-08-25/there-s-basically-no-alternative-to-u-s-corporate-bonds-right-now (accessed July 17, 2017)
9 More information on the Credit Trends database can be found at www.equifax.com/business/credit-trends
10 VantageScore is a trademark of VantageScore Solutions, LLC. More information can be found at www.vantagescore.com
8CHART 6
10th and 25th Percentiles for Origination VantageScore® 3.0 Credit Scores
by Tradeline Type
Source:
Equifax Credit Trends. Data are not seasonally adjusted. Percentiles based on numbers of accounts. Data are through June 2017.
9We then plotted severe delinquency rates for these tradeline types in charts 7A through 7H, based on the number of accounts
outstanding and the dollar balances outstanding. Here, the results are mixed. Auto loans, bankcard and private label credit cards are
clearly showing rising delinquency rates, but they remain relatively low. Mortgage, home equity installment loans, home equity lines
of credit (HELOCs), and student loans are all showing declining incidence of delinquency. Consumer finance loan performance is
essentially unchanged.
CHART 7
Severe Delinquency Rates by Tradeline Type
Source:
Equifax Credit Trends. Not seasonally adjusted. Severe delinquency rate defined as accounts 60+ days past due for charts 7A-7D; defined as 90+ days past due, in
bankruptcy or, for mortgage-related trades, in foreclosure. Data are through June 2017.
10Deeper dives into auto lending in other research we’ve recently completed11 indicate
that most lenders (banks, credit unions and captive auto finance companies) have
maintained very tight lending standards and have great performance to show for
it, while independent, monoline and dealer finance companies12 have been more
aggressive and show worsening performance. The majority of auto loans are
doing very well.
The weakening credit card performance may be indicative of turning tides, but the
delinquency rates are still quite low. We will continue to watch their performance.
Parting Thoughts
The focus of this study is recession risk from normal ebbs and flows of consumption
and investment, and what we might learn from recent trends in credit markets.
Policy risk, whether domestic or foreign, is impossible to gauge. Domestic fiscal
stimulus, for example from comprehensive infrastructure spending, would be
a boost to growth, but it isn’t free. Depending on how the money is raised to
pay for it, such spending could create greater recession risk on net rather than
less. Foreign events could also create economic stress at home and are nearly
always unexpected.
We occasionally get asked where to find timely originations data. We publish this
information in the Quarterly U.S. Consumer Credit Trends on the Equifax website in
the Investor Relations section: https://investor.equifax.com/news-and-events/events-
and-presentations (past events section) on a quarterly basis after Equifax releases
its earnings results. Additionally, more detailed monthly reports are available to
Equifax Credit Trends and Moody’s Analytics Credit Forecast 5.0 subscribers. If you
are interested in these reports please contact your Equifax sales representative.
The opinions, estimates and forecasts presented herein are for general information use only. This material is based upon information that we consider to be
reliable, but we do not represent that it is accurate or complete. No person should consider distribution of this material as making any representation or
warranty with respect to such material and should not rely upon it as such. Equifax does not assume any liability for any loss that may result from the reliance
by any person upon any such information or opinions. Such information and opinions are subject to change without notice. The opinions, estimates, forecasts,
and other views published by the Economic Insights group of Equifax represent the views of that group as of the date indicated and do not necessarily represent
the views of Equifax or its management.
11 Equifax infographic, “What’s Happening with Subprime Auto Loans?” http://www.visualcapitalist.com/subprime-auto-loans/ (accessed July 17, 2017)
12 Captive auto finance companies are associated with an auto manufacturer, independent finance companies offer auto and other loan types, while monoline
finance companies focus on auto loans through multiple dealers and platforms. Dealer finance companies are associated with dealerships or dealer networks
CONTACT US
wyatt.jefferies@equifax.com
O 404-885-8907
equifax.com/business
Copyright © 2017, Equifax Inc., Atlanta, Georgia. All rights reserved. Equifax and EFX are registered trademarks of Equifax Inc.
17-133502You can also read