GEF Country Portfolio Evaluation: South Africa (1994-2007) - Evaluation Office
←
→
Page content transcription
If your browser does not render page correctly, please read the page content below
GEF Country Portfolio Evaluation:
   South Africa (1994–2007)
           annexes i–M

                                         Evaluation
                                         Office
                               G LOBAL ENVIRONMENT FACILITY
Global Environment Facility
                                      Evaluation Office

                      GEF COUNTRY PORTFOLIO EVALUATION:
                         SOUTH AFRICA (1994–2007)

                                               ANNEXES I–M

ANNEX I: GLOBAL ENVIRONMENT BENEFIT ASSESSMENT ANALYSIS AND ENVIRONMENTAL
          LEGAL FRAMEWORK ANALYSIS ..................................................................................... 2
ANNEX J: PROJECT REVIEW PROTOCOL ....................................................................................... 67
ANNEX K: SUMMARY OF PROJECT RESULTS ................................................................................. 74
ANNEX L: SMALL GRANTS PROGRAMME PROJECTS ...................................................................... 91
ANNEX M: SCOPE OF REGIONAL/GLOBAL PROJECTS IN WHICH SOUTH AFRICA PARTICIPATES....... 95

Annexes I through M supplement the full report, GEF Country Portfolio Evaluation: South Africa (1994–
2007), Evaluation Report No. 43. The full version of this report is available in the Publications section of the
GEF Evaluation Office Web site, www.gefeo.org.

               GEF Country Portfolio Evaluation: South Africa (1994–2007): Annexes I–M
                                                  1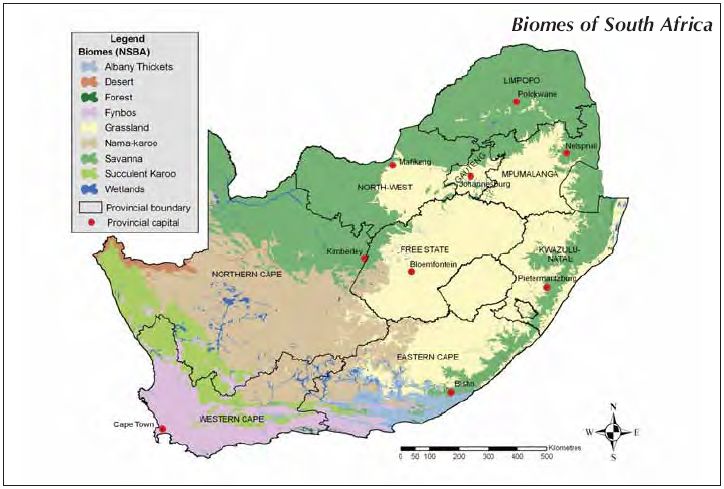
Annex I: Global Environment Benefit Assessment Analysis and Environmental Legal
         Framework Analysis

1.          GENERAL CONTEXT OF THE EVALUATION ................................................................ 3
      1.1.         OVERVIEW................................................................................................................................ 3
      1.2 SOUTH AFRICA, SADC & THE NEW PARTNERSHIP FOR AFRICAN DEVELOPMENT ........ 7
2.        OVERVIEW OF ENVIRONMENTAL RESOURCES IN KEY GEF FOCAL AREAS ................ 8
      2.1 BIODIVERSITY ................................................................................................................................. 8
      2.2 CONTRIBUTION TO CLIMATE CHANGE & VULNERABILITY TO CLIMATE CHANGE ......... 13
      2.3 LAND DEGRADATION .................................................................................................................. 22
      2.4 PERSISTENT ORGANIC POLLUTANTS...................................................................................... 28
      2.5 OZONE ........................................................................................................................................... 30
      2.6 INTERNATIONAL WATERS .......................................................................................................... 31
3         ENVIRONMENTAL LEGAL, OPERATIONAL & POLICY FRAMEWORK IN SOUTH AFRICA 34
      3.1 THE CONSTITUTION ..................................................................................................................... 35
      3.2 BROAD NATIONAL POLICY FRAMEWORK............................................................................... 36
      3.3 BIODIVERSITY ............................................................................................................................... 37
      3.4 CLIMATE CHANGE ....................................................................................................................... 41
      3.5 LAND DEGRADATION .................................................................................................................. 52
      3.6 PERSISTENT ORGANIC POLLUTANTS...................................................................................... 54
      3.7 OZONE DEPLETION ..................................................................................................................... 59
      3.8 INTERNATIONAL WATERS .......................................................................................................... 60
      3.9 RELEVANT INTERNATIONAL TREATIES & PROTOCOLS ....................................................... 63
      3.10 ODA ........................................................................................................................................ 64
4.       THE GEF & THE SOUTH AFRICAN FOCAL POINT MECHANISM................................. 65
      4.3 THE GEF FOCAL POINT MECHANISM IN SOUTH AFRICA ................................................... 66

              GEF Country Portfolio Evaluation: South Africa (1994–2007): Annexes I–M
                                                 2
1.      GENERAL CONTEXT OF THE EVALUATION

One of the three key dimensions of the GEF portfolio to be assessed in this evaluation is its
relevance to:
♦     South Africa’s sustainable development agenda, environmental priorities and national
      development needs and challenges
♦     South Africa’s national environmental policy priorities, legislation and strategies in each
      focal area
♦     The GEF mandate, through maximizing global environmental benefits, principles and to
      the objectives of each GEF focal area’s operational program and strategies.

This chapter outlines the broad country context, policy, legislative and strategy frameworks in
terms of which relevance will be assessed and provides an overview of the GEF, the focal areas
and the current GEF4 frameworks of objectives. The emphasis is on the biodiversity and climate
change focal areas as projects in these areas predominate in the GEF portfolio.

1.1.    OVERVIEW
SA is classified as a middle-income country, with a per capita GDP of approximately R35 970
(or US $5 321) and with an overall GDP of R1 725.828 billion (or US $255.3 billion) in 2006 and
                                            1
a population estimated at about 47 million . However, this classification will be highly misleading
if not supplemented by a detailed understanding of the enormous disparities in access to
secure, stable livelihoods, to land, jobs and other resources and in the distribution of population,
wealth, skills and opportunities. This context is essential to any understanding of the nature,
scale and scope of the challenges of sustainable development in South Africa. This section
provides a brief sketch of this context.

Table 1.1 General Profile for South Africa2
Surface area (km2)          1.2 million (roughly the equivalent of France, Germany and Italy combined)
Population growth rate      0.9% (2005 estimate)
Distribution by race          African (79.4%); Mixed race (8.8%); Indian/Asian (2.5%); White (9.3%)
Distribution by gender        Male (49.2%);
                                  Female (50.8%)
Distribution by province          Eastern Cape (15%); Free State (6.3%); Gauteng (19.2%);
                                  Kwazulu- Natal (20.6%); Limpopo (12%); Mpumalanga (6.9%);
                                  Northern Cape (1.9%); North West (8.2%); Western Cape (9.9%)
Major sectors, GDP                Finance, real estate & services 20%
(2004)                            Wholesale, retail, hotels & restaurants 14%
                                  Transport & communications 10%
                                  Manufacturing 20%
                                  Mining 7%
                                  Agriculture 3%
Social grants                     12 million people (3.2& of GDP)

By the end of the apartheid era, South Africa had an economy in crisis and one of the highest
levels of inequality in the world. The persistence of this legacy is evident in SA’s ranking as
116th most unequal in terms of the Gini coefficient out of 126 countries for which data was

11
   Source, South Africa’s MDG Mid-Term Report, 2007 p11 and using a mid-2006 exchange rate of R6,76 to the
US$
2
  EU / SA, Cooperation between the European Union and South Africa, Joint Country Strategy Paper 2007 — 2013

             GEF Country Portfolio Evaluation: South Africa (1994–2007): Annexes I–M
                                                3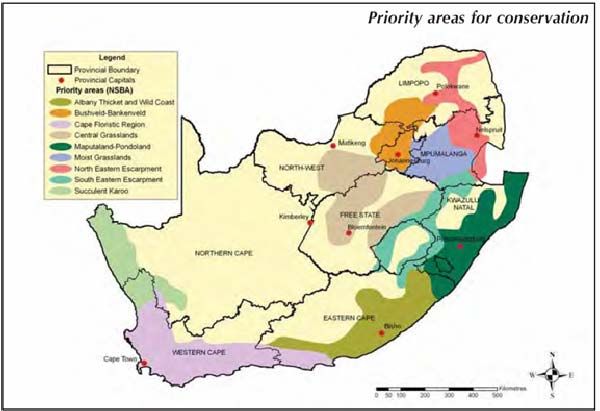
available in the UNDP’s 2006 Human Development Report3. SA also rates relatively low in
terms of the UNDP’s Human Development Index (HDI) (121st out of 177 countries)”4 and in
terms of the Gender Development Index (GDI) while, in terms of GDP per capita, SA would rank
56th.

Since 1994, economic growth has been positive, expenditure on social grants in the 2005/2006
                                           5
budget year amounted to ZAR 55 billion and significant gains have been made in redressing
the legacy of South Africa’s apartheid past. Table 1.2 indicates gains made but also the scale of
the challenge entailed by the continuing sharp disparities along racial and gender lines that are
still strongly evident and must be factored into any sustainable development agenda.

Table 1.2 Changes in Key Indicators 6
Population size                                      40,5 million in 1996         48,5 million in 2007
School attendance people aged 5–24                   63% in 1996                  74% in 2007
Adult Literacy rate (& female)                       69.6 in 1995 (67.2)          74.2 in 2005 (72.1)
Persons with no schooling                            19% in 1996                  10% in 2007
GDP Growth                                           3.2% in 1994                 5.0% in 2006
Per capita GDP growth                                1.1% in 1994                 3.6% in 2006
Unemployment – narrow definition7                    29.4% in Sept 2001           25.5% in Sept 06
Unemployment – broad definition                      40.6% in Sept 2001           37.3% in Sept 06
Per capita income: poorest 10% (%of total            R534 in 1993 (0.6%)          R734 in 2006 (0.6%)
income)
Per capita income: richest 10% (% of total           R48 412 in 1993 (54.8%)      R70 114 in 2006 (55.9%)
income)
Gini coefficient (measuring inequality)              0.672 in 1993                0.685 in 2006
% of population living below R3 000 per annum        50.1% in 1993                43.2% in 2006
Life expectancy (& female)                           54.6 years in 2001           50 in 2007 (48.4)
Households in formal dwellings                       64.4% in 1996                70.5% 2007
Households with access to flush toilets              49.1% in 1996                55.1% in 2007
Electricity for lighting                             58% in 1996                  80% in 2007
Electricity for cooking                              47% in 1996                  67% in 2007
Electricity for heating                              45% in 1996                  59% in 2007
HIV prevalence in antenatal surveys                  7.6% in 1994                 30.2% in 2005
Malaria cases                                        4 693 in 1991                12 322 in 2006
Tuberculosis cure rate                                                            56%
Motor vehicles registered compared to 1994           25% increase in 2004         29% increase in 2005
(4.9million)                                         (6.5million)                 (6.9million)
Economic contribution of tourism                     31.3% in 2000                55.8% in 2005
Surface area protected for biodiversity              5.9% in 1994/5               6.2% in 2003

This context is enormously significant for understanding the opportunities and challenges for the
environment in SA. Historically, the imperatives for social and economic development were
often seen to be in opposition to concerns regarding the state of the environment. Demands for
access to land, resources and services for SA’s majority were often characterized as ‘threats’ to

3 Winkler H & Marquard A, (2007) Energy development & climate change: Decarbonizing growth in SA, input to
Human Development Report 2007, Energy Research Centre, University of Cape Town
4
  UNDP, Human Development Report 2007 / 2008, Fact Sheet on South Africa
5
  Cooperation between the European Union and SA, Joint Country Strategy Paper 2007 — 2013
6 Sources: Statistics South Africa, (2007) Community Survey as well as The Presidency of SA, (2007),
Development Indicators; Mid-term Review
7 Definition provided by STATS SA: Narrow definition: Number of people seeking employment and could not find
any in last two weeks. Broad definition includes people who have been discouraged from seeking employment.

             GEF Country Portfolio Evaluation: South Africa (1994–2007): Annexes I–M
                                                4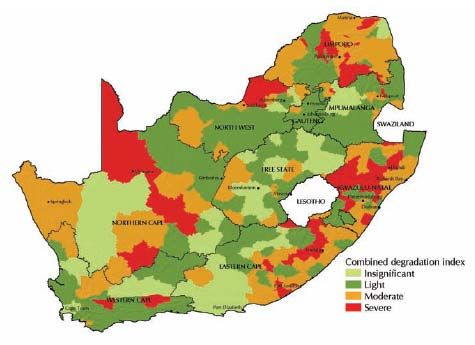
environmental conservation while concern for the environment was often perceived by the
majority as a preoccupation of a white elite involved in conservation for conservation’s sake.
While both of these positions continue to have residual currency, SA’s current policy reflects a
commitment to, and understanding of, sustainable development as entailing emphasis on all
three dimensions: social, economic and environmental. The following environmental ‘snapshot’
is from the Department of Environmental Affairs and Tourism’s (DEAT) report on the state of the
environment and provides an integrated picture of the state of the environment and the
environmental sustainability trends through a range of indicators:

    Table 1.3 Status & Trends, South Africa’s Environmental Sustainability Profile8
    Agricultural practices
    Food production per person                        DECREASING since 1975, notably for maize, the major crop
    Food productivity per unit land area             INCREASING, pointing to increased fertilizer use and technology
    Conservation tillage                    ☺        INCREASING, 500 000 hectares in 1975 to 1.5 million hectares in
                                            2005
    Air quality
    Air quality in general                           DECREASING, with high sulphur dioxide & particulate matter (PM10)
                                            levels
    Health problems due to air pollution             INCREASING at an estimated 20% over the next decade
    Vehicle exhaust emissions                     INCREASING, with various pollutants predicted to increase by 27% by
                                            2007 and up to 44% by 2011 (from 2002 levels) if emission controls are not in
                                            place
    Biodiversity
    Biodiversity loss                              INCREASING, almost 10% of birds & frogs & 20% of mammals
                                            threatened
    Ecosystem health                                 DECLINING in general, with aquatic ecosystems in worst condition
    Programmes to rehabilitate
    ecosystems
                                            ☺      INCREASING, including budget increase for invasive alien plant
                                            clearing program from R25 million in 1995/96 to R442 million in 2003/04
    Climate change
    Greenhouse gas emissions                         INCREASING, carbon dioxide concentration increasing by 0.6% per
                                            year
    Greenhouse gas emissions from                    INCREASING significantly, with a 38% increase between 1990 and
    road transport
                                            1994
    Greenhouse gas emissions per                   Disproportionately high due to reliance on coal and high energy
    person
                                            intensity of the economy
    Coastal development
    Uncontrolled coastal development                 INCREASING, leading to habitat change and degradation
    Blue flag beaches                       ☺        INCREASING, showing a commitment to coastal management
    Energy consumption and efficiency
    Energy consumption                               INCREASED by 23% since 1992
    Energy efficiency                                LOW, but slight improvement in recent years
    Environmental governance
    Role of South Africa in international
    environmental governance
                                            ☺    INCREASING, e.g., hosting the WSSD in 2002, 5th World Parks
                                            Congress in 2003, 27th Antarctic Treaty Consultative Meeting in 2004
    Access to environmental                          IMPROVING, but many citizens not aware of their environmental rights
    information
    Enforcement of environmental                     IMPROVING, but dedicated attention still needed

8
    DEAT, (2006), South African Environment Outlook

                  GEF Country Portfolio Evaluation: South Africa (1994–2007): Annexes I–M
                                                     5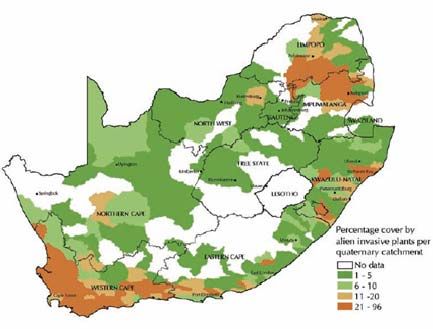
management legislation
Environmental data                            Quality and scope IMPROVING, but many gaps still remain
Freshwater resources
Use of available water resources            INCREASING, most exploitable sources tapped, freshwater flows
                                      decreasing
Water quality                                 VARIABLE, with overall DETERIORATION
Health of river ecosystems                  DECLINING, with effluent pollution continuing to grow Invasive alien
                                      species
Spread of alien invasive plants               INCREASING (faster than clearing programs can clear)
Land degradation
Extent of land degradation                    UNCERTAIN whether increased since 1999, lack of data
Land use
Availability of arable land                   DECLINED in 1990s due to expansion of settlements & other activities
Land restitution                              INCREASING, but majority of successful land claims are in the urban
                                      areas
Marine biodiversity and fish stocks
Threats to marine biodiversity             All threats, including extractive use, pollution, & mining, expected to
                                      INCREASE in the next ten years
Populations of abalone & line fish            Continue to DECLINE dramatically
Species listed as endangered or               INCREASING, for e.g. bird species affected by longline fishing
vulnerable
Sardine fishery                       ☺       RECOVERING after near collapse in late 1960s, currently healthy
Ozone depletion
Use of ozone-depleting substances     ☺       DECREASED significantly since 1990
Persistent organic pollutants
Concentrations of POPs                        UNKNOWN and needing to be quantified
Poverty and human development
Human Poverty Index                         INCREASED from 16.4% in 1995 to 31.7% in 2002, reflecting an
                                      increase of 1.7 million people living on less than US$1 per day
Human Development Index                       DECREASED after 1995, although increased investment in education
Renewable energy
Use of renewable energy                     INCREASING slowly, mainly solar water heating, experimental wind
                                      farms, some landfill gas projects, & testing of wave energy
Urbanization and housing
Urban sprawl                                  INCREASING, 58% of population living in urban areas, up from 53% in
                                      1996
Informal settlements                          EXPANDING rapidly, around urban centers and periurban areas
Housing backlogs                              INCREASING, from 1.5 million units in 1994 to 3 million units in 2000
Use of natural resources
Natural resources that support              RAPIDLY DECLINING, due to over-exploitation, particularly in forests,
livelihoods
                                      grasslands, KwaZulu-Natal coastal belt, Cape Floristic Region
Levels of abalone poaching                   INCREASING dramatically since 2000, threatening sustainability of
                                      fishery
Overall state of the environment: international indicators
Ecological footprint per person               Higher than the global average, and increased by 2% between 1991 &
                                      01
Environmental Sustainability Index.           DECLINING to an overall rank of 93 out of 146 countries in 2005

                GEF Country Portfolio Evaluation: South Africa (1994–2007): Annexes I–M
                                                   6
1.2     SOUTH AFRICA, SADC & THE NEW PARTNERSHIP FOR AFRICAN DEVELOPMENT
SA plays a key role in regional initiatives aligned to the objectives of the international
conventions through the Southern African Development Community (SADC), the New
Partnership for African Development (NEPAD) and the African Union, such as the Southern
African Botanical Diversity Network, State of the Environment Reporting Programme, and the
SADC Protocol on Shared Water Course Systems. The stated objectives of NEPAD are to
accelerate growth and sustainable development, eradicate widespread and severe poverty and
to halt the marginalisation of Africa in the globalisation process. The principles of NEPAD
include sustainable utilization of natural resources and environment. NEPAD includes a strategy
for sustainable environmental management and highlights biodiversity, desertification and
climate change as key issues in its Environmental Initiative Plan.9

Regional initiatives highlighted by DEAT10 are: NEPAD’s Environment Action Plan, Peer Review
Mechanism, Short Term Action Plan and Health Strategy; numerous SADC strategies, protocols
and plans such as the Protocols on Wildlife Conservation and Law Enforcement and Fisheries,
Subregional Action Programme to Combat Desertification, SADC Regional Indicative Strategic
Development Plan and Common Agenda; and a host of sector/locality specific agreements and
strategies such as the Incomaputo Agreement for Cooperation on the Protection and
Sustainable Utilisation of the Water Resources of the Incomati and Maputo Watercourses, the
two Conventions and associated protocols on Cooperation in the Protection and Development
of the Marine and Coastal Environment of the West, East and Central African Regions, the
African Union Maputo Declaration on Agriculture and Food Security, the Agriculture Strategy for
the Millennium Africa Programme, and Regional Biodiversity Strategy and Action Plan.

SA’s role in the region through these and other initiatives is substantial. A recent analysis by the
World Bank indicates that “SA contributes 40 percent of Sub-Saharan Africa’s GDP—its nine
largest cities alone account for about 24 percent of Africa’s GDP. Growth spillovers to the rest of
the continent are exceptionally large by international standards: an additional percentage point
of South African growth is associated with 0.5 to 0.75 percent GDP growth increases in the rest
of Africa, independent of common regional shocks.” The same report notes that “South Africa
accounted for 45% of the total power produced in all of Africa.11”
                                                            12
The UN report on NEPAD and the Environment provides a brief overview of progress,
indicating that subregional environment action plans are in the process of development and a
that a number of senior environmental experts are to be appointed to integrate environmental
issues into the development programs of the different regional economic communities. It also
notes the implementation of the “climate change adaptation in Africa” research and capacity-
building program, supported by the NEPAD secretariat, and financed by the Department for
International Development of the United Kingdom and the Canadian International Development
Research Centre. The program has just entered the implementation phase, with 12 projects
                                                                          13
addressing various capacity-development issues relating to climate change. ”

9
  DEAT UNDP (2004), National Capacity Self-Assessment for Global Environmental Management Project
Document p8
10
   DEAT (2006), Draft Strategic Framework for Sustainable Development in SA, Draft for Public Comment p65
11
   World Bank DME (2007), Renewable Energy Market Transformation Project Document , p 8
12 UN, (2007) Report of the Secretary-General, New Partnership for Africa’s Development: fifth consolidated
report on progress in implementation and international support p 8-9
13 UN, (2007) Report of the Secretary-General, New Partnership for Africa’s Development: fifth consolidated
report on progress in implementation and international support p 8-9

             GEF Country Portfolio Evaluation: South Africa (1994–2007): Annexes I–M
                                                7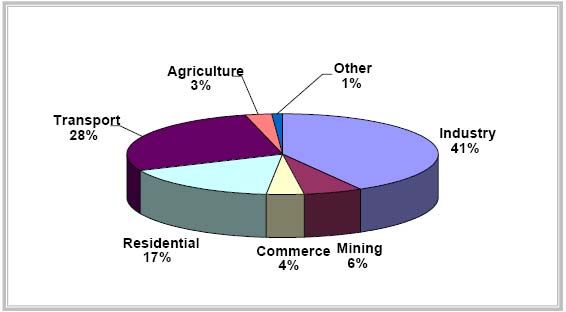
2.       OVERVIEW OF ENVIRONMENTAL RESOURCES IN KEY GEF FOCAL AREAS

2.1    BIODIVERSITY
Overview
South Africa is considered the third most biologically diverse country in the world, and is one
of the 17 identified “megadiversity countries. It includes three internationally recognized
biodiversity hotspots14: the Cape Floristic Region, Succulent Karoo (shared with Namibia is
one of only two arid biodiversity hotspots in the world, the other being the Horn of Africa),
and the Maputaland- Pondoland-Albany centre of endemism (shared with Mozambique and
Swaziland). South Africa is the only country in the world to have on of the six plant kingdom
of the world, the Cape Floral Kingdom entirely within its boundaries.

South Africa occupies only 2% of the world’s surface area but is home to nearly 10% of the
world’s plants (approximately 24 000 species), around 7% of the world’s vertebrate species, 6%
of the world’s mammal species, 8% of avifaunal species, 5% of the reptile species, 5.5% of the
world’s known insect species (only about half of the latter have been described). In terms of the
number of endemic species of mammals, birds, reptiles and amphibians, South Africa ranks as
the fifth richest country in Africa and the 24th richest in the world. Marine biological diversity is
also high. There are over 11 000 species found in South African waters, which is about 15% of
global species, with more than 25% of these marine species (or 3 496 species) being endemic
to South Africa. A high proportion of species are threatened, especially in river ecosystems
(82%) and estuaries (77%). Between 14 and 37% of the country’s fauna and flora are
considered under threat15. About 5.4% of the country’s land is protected to maintain biodiversity.

The following presents the status and protection of terrestrial, aquatic and marine biodiversity in
South Africa as determined by South Africa’s National Spatial Biodiversity Assessment (Driver
et al 2005a)16 as presented in the Country Study for South Africa’s National Biodiversity
Strategy and Action Plan and summarized in Driver et al (2005b)17 and the State of Environment
Report for 200618.

Terrestrial Biodiversity
Ecosystems
Biomes found in South Africa are desert, fynbos, succulent Karoo, Nama Karoo, grassland,
savanna, Albany thicket and forest. The vegetation of the country has also been classified at a
fine scale with 447 vegetation types mapped at a scale of 1:250 000. The NSBA 2004 found
                                                                         19
that 34% of South Africa’s terrestrial ecosystems are threatened . Of these, 5% are
critically endangered, 13% endangered, and 16% vulnerable. Most threatened ecosystems are
in the grasslands, fynbos and forest biomes. However, this is seen as a conservative
estimate, as it is based on                                o the 1996 National Land Cover and

14
   areas with especially high concentrations of biodiversity, which are under serious threat
15
   http://www.cbd.int/countries/profile.shtml?country=za, accessed 10 December 2007
16
   Driver, A, Maze, K, Rouget, M, Lombard, AT, Nel, J, Turpie, JK, Cowling, RM, Desmet, P, Goodman, P, Harris, J,
Jonas, Z, Reyers, B, Sink, K & Strauss, T. 2005. National Spatial Biodiversity Assessment 2004: Priorities for Biodiversity
Conservation in South Africa. Strelitzia 17. Pretoria: South African National Biodiversity Institute. http://bgis.sanbi.org
17
   Driver, Specialist Review Paper on Biodiversity, for the National Strategy for Sustainable Development Mandy Driver,
Tammy Smith and Kristal Maze South African National Biodiversity Institute November 2005.
18
   ,DEAT 2006, South African Environment Outlook.

               GEF Country Portfolio Evaluation: South Africa (1994–2007): Annexes I–M
                                                  8
some parts of the country such as Kwa-Zulu-Natal, which saw the amount of natural habitat lost
increase from 26% of the province’s area in 1994 to 36% in 2000.
The Biodiversity Intactness Index (BII), is an overall indicator of the state of terrestrial biodiversity
2021
(BII) recently proposed by Scholes and Biggs (2005) . South Africa’s BII is 80%, compared with
84% for Southern Africa. The grassland, fynbos and forest biomes have the lowest BII within South
Africa, aligning with the NSBA finding that these biomes have the highest numbers of threatened
ecosystems.
Figure 2.1: Biomes of South Africa (After DEAT, 2006)
Species
A number of assessments of species (e.g. Red Lists) have been conducted, namely for mammals,
birds, plants (currently being updated) and frogs. Other species assessments currently being
conducted include those for reptiles and butterflies. The Red Data Book of Mammals of South Africa
indicates that of the 295 species and subspecies of South African mammals evaluated, 57 (19%) are
considered threatened (Critically Endangered, Endangered or Vulnerable), while a further 38 (13%)
are Near Threatened. An assessment of the status of birds in southern Africa (South Africa,
Swaziland, Lesotho, Namibia, Botswana, and Zimbabwe) indicates that two species are extinct in the
region, while 59 species are threatened and 64 are Near Threatened. The Atlas and Red Data Book
of the Frogs of South Africa, Lesotho and Swaziland indicates that 20 of the 115 recorded species of
frogs (17%) are threatened and a further five species are Near Threatened. The Red Data List for
plants is being revised but based on a 2004 assessment there are 1262 (more than 10% of the total)
threatened plant species in South Africa (181 Critically Endangered, 241 Endangered, and 840
Vulnerable) and 449 Near Threatened (SANBI, 2005b).
20 The BII synthesizes information on land use, ecosystem extent, species richness and population abundance, using
an expert assessment approach.
21
Scholes R. J. and Biggs R. 2005. A Biodiversity Intactness Index. Nature 434, 45–49.
GEF Country Portfolio Evaluation: South Africa (1994–2007): Annexes I–M
9Table 2.1: Status of species in South Africa (after DEAT 2006)
Taxonomic group % Endemism Critically endangered Endangered species Vulnerable species
species
Mammals 16 4 9 27
Birds 8 5 11 42
Amphibians 56 4 5 2
Reptiles 36 1 6 12
Freshwater fish ? 7 6 9
Marine fish 13 5 2 11
Plants 60 175 216 814
Alien Invasive Species
There are about 180 species of invasive alien plants already infesting the equivalent of 10 million ha
(8%) of South Africa’s surface area. This area is constantly expanding. Woody invasive alien species
are estimated to use 7% of the annual flow of South Africa’s rivers, the net present cost of which is
Acacia mearnsii
Programme is the key national intervention aimed at addressing this threat. The cost to clear alien
plant invasions in South Africa is estimated to be around R12 billion, or roughly R600 million per year
for the estimated 20 years that it would take to deal with the problem.
Figure 2.2: Extent and cover of invasive alien plants (After DEAT 2006)
Protection
types are adequately conserved (in relation to their biodiversity targets): 22 types
of fynbos, 18 types of savanna, and 7 types of forest. No grassland types are adequately
conserved (see table 2.2 below).
South Africa’s conservation areas include the formal statutory protected areas (PAs) (Type I);
the less formal PAs, such as mountain catchment areas and state forests of the Department of
Water Affairs and Forestry (DWAF) (Type II) and informal landowner activities such as game
farms and conservancies (Type III). Currently, 5.4% % of land in South Africa is formally
protected in Type 1 and Type 2 PAs. The conservation estate consists of 479 Type 1 PAs
(representing 77% of the total protected area in Types 1–3) and 471 Type 2 PAs. Only a few
GEF Country Portfolio Evaluation: South Africa (1994–2007): Annexes I–M
10PAs are greater than 100 000 hectares (ha) in area, and most of them cover between 1 000 and
10 000 ha.
Table 2.2: Habitat transformation and protection of biomes in formal protected areas (After
DEAT 2006)
Biome Area (km2) % of total area of the % remaining % protected
Country
Desert 8 548 0.7 93.4 12.5
Succulent karoo 85 207 6.7 96.5 3.1
Fynbos 84 580 6.7 70.2 11.0
Nama karoo 250 069 19.7 98.4 0.6
Grassland 373 984 29.5 70.8 1.9
Savanna 412 753 32.6 86.1 8.9
Albany thicket 30 256 2.4 91.9 6.3
Forest 4 730 0.4 94.7 39.6
Wetlands 16 790 1.3 92.1 4.6
Box 2.1: South Africa’s TFCAs, Biosphere Reserves and World Heritage Sites:
Six Transfrontier Conservation Areas have been identified: Ais-Ais/Richtersveld Transfrontier Conservation Park;
Kgalagadi Transfrontier Park; Limpopo-Sashe TFCA; Great Limpopo Transfrontier Park; Lubombo Transfrontier
Conservation and Resource Area; Maloti-Drakensberg Transfrontier Conservation and Development Area.
South Africa has four Biosphere Reserves (MAB): Kogelberg Biosphere Reserve (listed in 1998); Cape West Coast
Biosphere Reserve (listed in 2000 and covering 376 900 ha including a number of threatened vegetation types and
important bird-breeding sites. Waterberg Biosphere Reserve in Limpopo (listed in 2001, covering 1,4 million ha,
including the Marakele National Park and the Nylsvlei Ramsar Site; Kruger-to-Canyons Biosphere Reserve (listed
2001 and covering more than 3,3 million ha).
South Africa has seven World Heritage Sites in South Africa (UNESCO): Robben Island; Greater St. Lucia Wetland
Park; The Cradle of Humankind; uKhahlamba Drakensberg Park; Mapungubwe Cultural Landscape; Cape Floristic
Region; and, The Vredefort Dome.
2.3: Priority Areas for Conservation (after DEAT 2006)
GEF Country Portfolio Evaluation: South Africa (1994–2007): Annexes I–M
11Freshwater Biodiversity
Ecosystems
82% of
South Africa’s main-stem river ecosystems are threatened
established. Up to 60% of threatened endemic freshwater fish may be threatened by introduced
fish species. Invasive alien plant species use 7% of the available surface water in South Africa
Protection
Rivers in particular are poorly conserved and even where they are included in a protected area,
they are not adequately protected.
Marine and Estuarine Biodiversity
Ecosystems
GEF Country Portfolio Evaluation: South Africa (1994–2007): Annexes I–M
1265% of South Africa’s marine biozones are threatened
exploited and/or collapsed.
There are currently no active control programs for invasive alien species in South Africa’s
marine environment, although a prevention program aimed at ship’s ballast water is being
developed.
Status
2.2 CONTRIBUTION TO CLIMATE CHANGE & VULNERABILITY TO CLIMATE CHANGE
Greenhouse Gas Emissions
The most recent inventory of Greenhouse Gases for South Africa was for the years 1990 -1994
and formed the basis for the Initial National Communication22 (INC) prepared by DEAT in 2004
in terms of the United Nations Framework Convention on Climate Change. Work is currently
underway to design a process and approach for preparation of an updated Greenhouse Gas
Inventory (GGI) for South Africa. Responsibility for preparation of this inventory lies with DEAT.
Summary results from the GGI are as follows:
♦ The total greenhouse gas emissions for 1990 were 347,346 Gg CO2 equivalents
♦ The total greenhouse gas emissions for 1994 were 379,842 Gg CO2 equivalents.
22
This section draws directly or indirectly from the DEAT, (2003). Initial National Communication under the United
Nations Framework Convention on Climate Change & DEAT website:
http://www.environment.gov.za/ClimateChange2005/National_Greenhouse_Gas_Inventory.htm
GEF Country Portfolio Evaluation: South Africa (1994–2007): Annexes I–M
13Government estimates of future trends in GHG emissions “indicate a rise from just over 300 Mt
CO2 in 2001 to around 600 Mt in 2025, given an expansion in the energy system based on
similar energy resources.”23
Contribution Relative to Other Countries
South Africa is by far the largest emitter of GHGs in Africa and one of the most carbon
emission-intensive countries in the world, annually emitting some 7 tonnes of carbon dioxide per
capita due to the energy intensive economy and high dependence on coal for primary energy.24
SA’s emissions are disproportionately high. Although high income OECD countries are
responsible for the vast majority of emissions (“With 15% of the world’s population, they account
for almost half of all emissions…emitting 6 times our sustainable carbon budget”), SA’s
emissions are proportionately far higher (“With 0.7% of the world's population, South Africa
accounts for 1.5% of global emissions… If all countries in the world were to emit CO2 at levels
similar to SA's, we would exceed our sustainable carbon budget by approximately 340%”).25
Highly Uneven Contributions from Different Social Groups
One of the most intense challenges SA faces is how to establish greater equality in access to
services, secure livelihoods and a decent quality of life while ensuring sustainability in terms of
impact on natural resources. The dramatic inequalities in SA society are mirrored in the
differential consumption patterns and impact on the environment in general. In one depiction,
although SA’s overall ‘ecological footprint’ is double the sustainable level, some sections have a
footprint that is 14 times the sustainable level while the footprint of the majority is about half
what is regarded as sustainable. The draft Strategic Framework for Sustainable Development
notes, “It is highly unlikely that there are sufficient resources to eradicate poverty by increasing
the footprint of the poor if the footprint of the rich remains so large.26”
Sectors That Are Primary Contributors27
The pie charts below illustrate how the different sectors in South Africa contributed to these
totals. (The total emissions were calculated as carbon dioxide equivalents).
♦ Carbon dioxide is the most significant greenhouse gas for South Africa.
♦ It contributed more than 80% of the total of the three main greenhouse gas emissions
(carbon dioxide, methane and nitrous oxide) for both 1990 and 1994.
23
Winkler H & Marquard A, (2007) Energy development and climate change: decarbonizing growth in South
Africa, input to Human Development Report 2007, Energy Research Centre, University of Cape Town p 11
24
Department of Minerals and Energy (2004), Renewable Energy Policy of South Africa White Paper p9
25
UNDP, Human Development Report 2007 / 2008, Fact Sheet on South Africa
26
DEAT (2006), A Strategic Framework for Sustainable Development in SA, draft for public discussion p20
27
RSA (2003) Initial National Communication under the United Nations Framework Convention on Climate
Change
GEF Country Portfolio Evaluation: South Africa (1994–2007): Annexes I–M
14♦ The main source of CO2 is the energy sector which generated 89.7% of the total CO2
emissions in 1990 and 91.1% of the total in 1994.
The high levels of emissions from the energy sector relate to the high energy intensity of the
South African economy, which is dependent on large scale primary extraction and processing,
particularly in the mining and minerals beneficiation industries. The only significant sink for
carbon dioxide in South Africa is through afforestation, and at present South Africa is
undergoing net afforestation. The net uptake of carbon dioxide through afforestation activities
has increased from 16 983 Gg in 1990 to 18616 Gg in 1994.
Methane emissions from agriculture, energy fugitive emissions and waste amounted to 2 053
Gg in 1990 and 2 057 Gg in 1994. Enteric fermentation emissions from livestock were the
largest contributor to methane emissions, contributing 40% of the total methane emissions. The
waste sector contribution increased from 33.5% in 1990 to 36% in 1994 due to extension of
waste services to sectors of the population that were previously not serviced.
The total nitrous oxide emissions were 75 Gg and 67 Gg for the years 1990 and 1994
respectively. The main contributor was the agricultural sector, which generated 77% in 1990
and 80% in 1994 – of the total nitrous oxide emissions. Road transportation contributed to more
than half of the transport sector emissions, which increased by about 36% between 1990 and
1994.
Energy28
The total primary energy supply to SA increased from 3,924PJ in 1993 to 4,295PJ in 2000, an
increase of 9.5%. In 2000 coal contributed 79% of the total national primary energy supply.
Figure 2.4: 2000 Primary Energy Supply
Sectoral Usage 29
The final end-user energy usage in 2000 was 2,193PJ. The largest energy consuming sectors
were industry (including mining, 47%), residential (16.4%) and transport (27%, 97% of which is
from petroleum). Although the remaining sectors accounted for less than 10% of final energy
demand in 2000, 3.5% of this is in commercial and public buildings.
28
This section is drawn from Department of Minerals & Energy (2005), Energy Efficiency Strategy of the Republic
of South Africa p8
29 Drawn from DME (2005), Energy Efficiency Strategy of the Republic of South Africa pp 28, 30, 32, 34
GEF Country Portfolio Evaluation: South Africa (1994–2007): Annexes I–M
15The extension of services has resulted in significant increases in household electricity use.30.
However, contrary to conventional wisdom, it would appear that the impact of extending
electrification to the majority of the population since 1990 (from an estimated 30% in 1990 to a
current estimated rate of 75%) has had relatively little impact on electricity consumption. The
result of gaining around three million new (primarily low-income) residential customers between
1990 and 2004 only increased Eskom’s sales by around, whereas growth in Eskom’s industrial
sales in the same period added 17% to energy consumption based on the 1990 total.”31 Hot
water heating represents around 30% of all household electricity use32. Figure 2.5 depicts the
sectoral split of final energy use, and excludes “non-energy use” carriers, such as solvents and
lubricants.
Figure 2.5 Final Energy Use by Sector
Key Features of the Main Energy Using Sectors33
Industry and Mining Sector
♦ Industrial energy usage is dominated by a small number of energy intensive industries
including ferrous and non-ferrous metals processing, mining, pulp and paper, and the
petrochemical industry;
♦ The energy intensities in these industrial sectors are typically higher than those of other
first world countries.
Residential Sector
♦ A key energy source is still biomass in the rural areas, but electricity use is increasing;
♦ Savings can be made in thermal energy; in incorporation of energy efficiency measures
(thermal insulation) in new housing, in implementation of appliance labelling and
standards and through massive education and awareness campaigns.
Transport Sector
♦ Road transport of passengers and freight represents 84% of energy use;
♦ Transport fuels represent a significant portion of the country’s imports into the economy.
Commercial and Public Buildings Sector
♦ The Commercial sector is undergoing significant growth which presents the opportunity to
capture energy efficiency at the design stage of new stock.
30
This section is drawn from Statistics South Africa, (2007) Community Survey
31
Winkler H & Marquard A, (2007) p6
32
Interview: Harald Winkler, Energy Research Centre, University of Cape Town
33
Drawn from Department of Minerals & Energy (2005), Energy Efficiency Strategy of the Republic of South
Africa pp 28, 30, 32, 34
GEF Country Portfolio Evaluation: South Africa (1994–2007): Annexes I–M
16Mitigation: Options
A central issue for mitigation options is that “given the challenges of development to meet basic
needs, mitigation policies and measures have to be integrated with development goals.”34 The
South African government’s policy on Renewable Energy notes that “emission constraints could
have a significant impact on the South African economy and trade.”35
The analysis of the feasibility, potential cost, practicability and likely impact of various mitigation
options is the subject of ongoing and heated debate. The following is based on the work of the
Energy Research Centre at the University of Cape Town, which in turn draws on a wide range
of other research. We have also tried to reflect some key divergent views where possible and
relevant but will not have been able to cover the full spectrum of research based analyses and
projections.
The Energy Research Centre divides South Africa’s mitigation options into three broad
categories36:
♦ energy efficiency (which reduces demand for energy, or uses it more efficiently for the
same service) and can be implemented in the short term and where the cost implications
are well understood;
♦ changing the fuel mix (moving to lower or non carbon-emitting energy sources) which
would require a longer time frame linked to the life span of refineries and power stations;
and
♦ structural changes to the economy made over the long term, which lower the energy
intensity of the economy as a whole by shifting economic activity and investment to less
energy-intensive sectors, or taking other measures to reduce the need for energy
services, such as changing urban planning practices to reduce transport requirements.
The Centre points out that, even if the energy efficiency based options and the options for
changing the fuel mix outlined below were all implemented, this “would reduce CO2 emissions
likely to occur by 143 Mt (24%), but these would still be 30% higher than the 2000 level.”37 Only
significant changes to the structure of the energy system and, therefore, of the economy, as
outlined below, will significantly change this result.
Energy Efficiency (EE) Mitigation Options38
♦ Industry: improvements in industry, could save around 770 Mt of CO2 over the 25-year
period, reduce emissions by 44 Mt, and save a net R18 billion (2000 Rands). The energy
efficiency program would aim at a reduction of 12% from the reference case by 2014.39
♦ Commercial: (also with a target of 12% by 2014) is also a significant option, with a net
saving of around R13 billion, and a reduction in CO2 emissions in 2025 of 12 Mt of CO2
interventions consist primarily of improved building design and improved HVAC efficiency
34
Winkler H & Marquard A, (2007) Energy p1
35
DME (2003), White Paper on Renewable Energy, p8
36
Winkler H & Marquard A, (2007) p18
37
Winkler H & Marquard A, (2007) p19
38
This and the following sections on mitigation options draws directly on the modeled scenarios outlined in Winkler
H & Marquard A, (2007) p 17
39
A target of 12% by 2014 was used for the scenario-modelling. These figures are very close to the government’s
2005 National Energy Efficiency Strategy targets (12% by 2015), and those additionally specified in the National
Energy Efficiency Accord (15% by 2015 for mining and industry), but not identical.
GEF Country Portfolio Evaluation: South Africa (1994–2007): Annexes I–M
17♦ Residential: a combination of ‘cleaner and more efficient residential energy’ measures
would save around R1 billion, and reduce CO2 emissions in 2025 by 4 Mt. Implementation
of these scenarios would require ‘significant policy intervention.
♦ Transport: there are significant efficiency gains to be made in the transport sector in South
Africa through motor efficiency improvements, mode-switching (particularly road and air to
rail), and the development of integrated urban transport networks.
Lowering the Carbon Content of the Energy Mix40
♦ Gas: increased use of imported gas primarily as fuel for combined-cycle turbines for
electricity generation would cost a little more than R95 million but save around 200 Mt
CO2 over the study period, with a reduction of 12 Mt in 2025.
♦ Hydroelectricity: two sources potentially available, construction of a new plant of around
1300MW and/or at the Inga Falls on the Congo River in the Democratic Republic of
Congo, which could potentially provide from 40 000 to 100 000 MW of capacity and save
R11 billion, as well as save 167 Mt of CO2 emissions, as well as 17 Mt in 2025.
♦ Nuclear: the deployment of Eskom’s indigenous nuclear reactor concept, the Pebble Bed
Modular Reactor (PMBR), assuming that the technological challenges are successfully
met, around 4500MW of baseload nuclear capacity would be added to the electricity,
adding R4.6 billion to existing costs and avoiding 246 Mt of CO2 including avoiding 32 Mt
CO2 emissions in 2025, “subject to the usual complications and constraints of nuclear
power”.
♦ Electricity-generating renewable technologies: (a combination of biomass, solar thermal
technologies and wind energy), adding R4.5 billion in costs and avoiding 180 Mt of CO2
emissions, and cutting CO2 emissions in 2025 by 15 Mt
♦ Biofuels: could provide around 8% of liquid fuels by 2025, cost R2 billion more than
current modes, and would save 31 Mt of CO2 over the period, and around 5 Mt in 2025.
♦ Supply-side options: are new coal technologies, including fluidized-bed combustion and
others, as well as carbon capture and storage combined with coal gasification (many of
which are being researched by Sasol and Eskom).
Renewable Energy Potential
The Energy research Centre notes that the “extent of renewable energy deployment in these
scenarios (outlined above) is relatively modest. The electricity target is in line with the state’s
target of achieving 10 000 GWh of generated electricity by 2014 (see above), but current
thinking in government is that ¾ of this target will now be met through biofuels.”41
A further estimate of the potential of renewable energy in SA indicates that there are sufficient
renewable energy resources in South Africa to provide for about 13 percent of the electrical
demand by 2020, and easily 70 percent or more by 2050 using a conservative estimate and,
with a rapid shift, renewables could provide up to 20% of electricity by 2020, and more than
60% of the total energy demand by 205042. The project document for the Renewable Energy
Market Transformation Project uses the analysis of the potential and cost of various renewable
sources provided in Figure 2.6 to show the relative cost-effectiveness of solar energy in the
commercial sector as it is not much more expensive than other options but has the potential to
provide significant energy.43
40
Winkler H & Marquard A, (2007) p19
41
Winkler H & Marquard A, (2007) p19
42
Banks, D and Schäffler , J (2005), The potential contribution of renewable energy in SA, commissioned by
Sustainable Energy & Climate Change Project (SECCP), Project of Earthlife Africa Johannesburg p53
43
World Bank (2007), Renewable Energy Market Transformation Project Document p 11
GEF Country Portfolio Evaluation: South Africa (1994–2007): Annexes I–M
18Figure 2.6: Renewable Energy Supply Curve—The First 10,000 GWh
0.4
Solar Residential: Low-Income Households
Hydro: Large—RoR—LH
Hydro: Large—Inter-Basin Transfer
0.3
Sugar Bagasse: Including High Tops & Trash
Sugar Bagasse: Reduced Process Steam
Solar Commercial: Office & Banking Space, Pulp & Paper Mill 2
Rand/kWh
Sugar Bagasse: Including High-Pressure Boilers
0.2 Landfill Gas: Small
Landfill Gas: Medium
Landfill Gas: Large
Hydro: Large—Refurbishment
0.1
Biomass Pulp & Paper: Mill 1
0
0 2 4 6 8 10 12
Cumulative energy, 1,000 GWh
Source: Conningarth Economists, June 2004.
Structural Changes to the Economy44
♦ Adjust state incentives (including industrial incentive programs and special dispensations
on low electricity prices) to avoid attracting further energy-intensive investments on terms
which would severely restrict future mitigation options, and shift these incentives to lower
carbon industries.
♦ Application of a much more rigorous mitigation program to the non-energy-intensive45
section of the economy, since the international competitiveness of this part of the
economy would not be significantly affected by higher energy prices, which would be
ameliorated by energy efficiency improvements in the medium term. An exception would
be low-income households – policy would have to ensure that safe and adequate energy
services were delivered at an affordable cost, which might include state (or other agency)
subsidized energy efficiency measures.
♦ Investment and enabling local alternatives: Encourage a shift to another area of
competitive advantage with low-carbon characteristics, which makes use of local
resources. One of the best prospects is a solar thermal energy industry, since South
Africa has some of the best solar resources in the world. South Africa could become a
world leader in solar thermal technology, with the right supporting measures. These would
be a combination of measures, including the creation of a local market (commitment by
Eskom and IPPs to commission a certain number of plants), state incentives and support
(including technology support and public investment), and risk-sharing with international
partners, either from the private sector, or through multilateral agencies.
44
Winkler H & Marquard A, (2007) p 19 - 20
45
Energy-intensive industries could be identified by the percentage of their costs spent on energy.
GEF Country Portfolio Evaluation: South Africa (1994–2007): Annexes I–M
19♦ Reform the energy-intensive sector itself, by gradually reducing its energy intensity while
protecting employment and existing investment.
♦ Tax on energy use: a tax equivalent to R50/ton of coal would mitigate 28 Mt of CO2 over a
20-year period and add a mere R23 million in cost.
Barriers to Renewable Energy Implementation
Many commentators have noted that, unlike many developing countries, South Africa does not
suffer from lack of technological capacity, in terms of skills and expertise, or lack of access to
finance46. The key constraints, according to the Energy Research Centre and DME are47::
♦ low energy prices, which are probably the most fundamental constraints to more extensive
RE and EE programs and, while they are set to increase to fund new plant development,
are predicted to remain below marginal cost of production for a number of years making it
difficult for a renewables market to develop and not incentivizing efficiency in use;
♦ technological capacity largely limited to specific areas of energy efficiency and renewable
energy technologies; and
♦ constraints arising from current structures of institutions and policy domains.
♦ Lack of consumer awareness on benefits and opportunities of renewable energy.
♦ Centralisation of electricity generation, gas supplies and liquid fuel provision - Eskom, the
vertically integrated state-owned utility controls the generation, transmission and largely
the distribution of power.
♦ Financial, legal, regulatory and organisational barriers to implementation of renewable
energy technologies and the development of markets.
♦ Lack of non-discriminatory open access to key energy infrastructure such as the national
electricity grid, certain liquid fuels and gas infrastructure.
♦ Market power of utilities
The whole area of alternative energy is the subject of vigorous debate and many of the barriers
to renewables identified are contested. A study conducted in 2005, for example, concludes that
an analysis of cost data undertaken “indicates that costs of power from renewables are already
less than those from conventional resources in some selected cases.”48
Current Energy Crisis
SA is currently experiencing power shortages and load shedding, as generation capacity has not
increased over the past ten years, despite a steady growth in demand for electricity. “Increasing
power shortages in South Africa could pose a serious threat to sustained economic growth and
international competitiveness. Eskom is currently planning to build 1,500 MW of power capacity each
year over the next five years to meet the growing demand.49”
The power shortages could pose both an opportunity and a threat. Various measures mooted by
government to create an enabling environment for improved efficiency and mix in terms of
energy have come strongly back onto the agenda, such as the adoption of a mandatory feed-in
tariff and a voluntary green electricity trading scheme to promote renewable energy
development. Eskom has begun an aggressive solar water heater program to mitigate the
power shortage. The REMT project document notes that “solar water heaters have a large
46
Winkler H & Marquard A, (2007) Energy development and climate change: Decarbonizing growth in South
Africa, input to Human Development Report 2007, Energy Research Centre, University of Cape Town p24 & 25
47
DME (2003), White Paper on Renewable Energy, p10
48
Banks, D and Schäffler , J (2005), The potential contribution of renewable energy in SA, commissioned by
Sustainable Energy & Climate Change Project (SECCP), Project of Earthlife Africa Johannesburg p 54
49
World Bank DME (2007), Renewable Energy Market Transformation Project Document (REMT), p 8
GEF Country Portfolio Evaluation: South Africa (1994–2007): Annexes I–M
20replication potential to reduce greenhouse gases by replacing fossil fuel combustion.
Furthermore, the power tariff for newly built power plants has increased to 3.6–4.3 U.S.
cents/kWh, according to the National Energy Regulator of South Africa (NERSA). With
additional revenue streams from carbon financing, some renewable energy technologies can be
financially viable at this tariff level.”
The shortages also pose threats, however, as government seeks to expand power generation
as fast as possible, with the potential that RE and EE technologies with a potentially longer
lead-in time, but important from a long term sustainability perspective, may be put aside once
again.
Vulnerability50
Potential changes to the South African climate over the next 50 years identified in the INC pose
significant threats and include: a warming of between 1°C and 3°C; a potential reduction of
approximately 5 to 10% of current rainfall; increased daily maximum temperatures in summer
and autumn in the western half of the country; increased incidents of flood and drought; and,
enhanced temperature inversions exacerbating air pollution problems.”51 These changes are
likely to impact most negatively on those already made vulnerable by poverty. The South
African Country Studies Programme identified the health sector, maize production, plant and
animal biodiversity, water resources, and rangelands as areas of highest vulnerability to climate
change, and proposed suitable adaptation measures to offset adverse consequences.
Health impacts include problems related to sun exposure and indirect health impacts such as an
increase in the incidence of water-borne diseases and vector-borne diseases such as malaria.
The modelling predicted that the area of the country potentially prone to malaria will more than
double in 50 years, and that 7.8 million people will be at risk, with 5.2 million of these people not
previously resident in malaria risk areas.
Water resources, South Africa’s rainfall is already highly variable in spatial distribution and
unpredictable, both within and between years. Much of the country is already arid or semi-arid
and the whole country is subject to droughts and flood and desertification is already a problem
in South Africa.
Rangelands, 70% of the land surface of South Africa consists of natural and semi-natural
ecosystems which provide rangelands for large herbivore species. Modelling suggests a general
aridification of this type of land and increased fire outbreaks.
Maize production, About 70% of total grain production in South Africa consists of maize. Crop
yield modelling predicts that, under a hotter drier climate, maize production will decrease by up
to 20%, mostly in the drier western regions. In addition, an increase in pests, diseases and
invasive plants would also have a detrimental effect on the agricultural sector.
Biodiversity is important for South Africa because of its key role in maintaining ecosystem
functioning, its proven economic value for tourism and its role in supporting subsistence
lifestyles. Climate change modelling suggests a reduction of the area covered by the current
biomes by up to 55% in the next 50 years. The largest losses are predicted to occur in the
western, central and northern parts of the country. Species composition is expected to change,
which may also lead to significant changes in the vegetation structure in some biomes, and, in
50 DEAT (2004), A National Climate Change Response Strategy for South Africa
51
RSA (2003) Initial National Communication under the UN Framework Convention on Climate Changep4
GEF Country Portfolio Evaluation: South Africa (1994–2007): Annexes I–M
21You can also read