Global Economic Outlook: Q1 2023 - On the precipice abrdn Research Institute
←
→
Page content transcription
If your browser does not render page correctly, please read the page content below
Global Economic Outlook: Q1 2023
On the precipice

abrdn Research Institute

                                   Q1 2023
Contents Page
Executive Summary .............................................................................................................................................................. 2
Global forecast summary ..................................................................................................................................................... 4
abrdn Research Institute key calls ...................................................................................................................................... 5
Scenario overview ................................................................................................................................................................. 6
Quantitative Indicators ......................................................................................................................................................... 7
Box 1: How bad could the housing downturn become? ................................................................................................... 8
Inflation .................................................................................................................................................................................. 9
Monetary policy ................................................................................................................................................................... 10
Box 2: A Natural Language tool to assess Fed communication .................................................................................... 12
Politics .................................................................................................................................................................................. 13
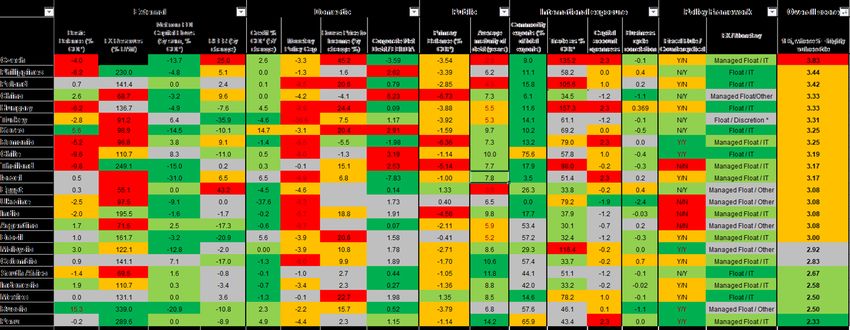
Box 3: COP27- have the gaps been bridged? .................................................................................................................. 15
United States ....................................................................................................................................................................... 16
China .................................................................................................................................................................................... 17
Box 4: Chinese whispers .................................................................................................................................................... 18
Eurozone .............................................................................................................................................................................. 19
Box 5: European gas scenarios......................................................................................................................................... 20
Japan .................................................................................................................................................................................... 21
United Kingdom................................................................................................................................................................... 22
India ...................................................................................................................................................................................... 23
Brazil ..................................................................................................................................................................................... 24
Russia-Ukraine War ............................................................................................................................................................ 25
Emerging Markets Overview .............................................................................................................................................. 26
Box 6: Where are EM vulnerabilities greatest? ................................................................................................................ 27
Australia, Canada, Sweden ................................................................................................................................................ 28
Scenario: Sticky inflation ................................................................................................................................................... 29
Scenario: Fed walks the tightrope..................................................................................................................................... 30
Scenario: Supply side recovery......................................................................................................................................... 31
Scenario: Demand side resilience ..................................................................................................................................... 33
Scenario: Stagflationary shock ......................................................................................................................................... 32
Scenario: Eurozone political and sovereign crisis .......................................................................................................... 33
Scenario: China stress and slowdown ............................................................................................................................. 35
Scenario: Total vaccine escape ......................................................................................................................................... 36
1 | abrdn.com
Executive Summary
On the precipice
The global economy is on the precipice of recession.            likely to see further disruption to activity over the next 6
Aggressive monetary tightening led by the US                    months as the government periodically tightens
Federal Reserve, an enormous energy price and                   restrictions to stop the healthcare system from being
terms of trade shock in the UK and Europe, and the              overwhelmed. Steps to support the property sector are
disruption from transitioning away from zero-Covid              welcome, but we don’t think they will drive a forceful
and property sector weakness in China, should                   recovery with developer funding conditions, the pipeline
combine to push the global economy over the edge.               of property activity so depressed, and a still large
                                                                overhang in housing supply.
Although our global recession call is now shared by
many forecasters, the consensus is underestimating              Across broader emerging markets, the monetary policy
the potential depth and severity of the downturn. The           tightening cycle is gradually drawing to a close, but the
large interest rate cutting cycle we think will follow is       credibility of policy pivots varies considerably, as do
also not yet priced into markets.                               broader macro prospects. Many frontier EMs are in the
                                                                midst of crisis or teetering on the brink, including Sri
Recessions appear to have already begun in some of the          Lanka, Zambia, Pakistan, El Salvador, Ghana, Egypt,
major economies. Leading indicators in the Eurozone are         Tunisia and Lebanon. The drop in global risk appetite and
deep in contraction, and we expect GDP growth to turn           capital flows will complicate debt servicing. The outlook is
negative from Q4 2022. Admittedly, energy rationing this        also very challenging in Central & Eastern Europe, where
winter looks less likely given the build-up in gas storage.     inflation is exceptionally elevated and the activity data
But the tailwinds of mild weather and reduced Asian             signal a sharp contraction. Central banks in Poland and
demand allowing Europe to secure large amounts of LNG           Hungary in particular will need to hike further to help bring
cannot be relied upon to continue. Moreover, our Russia-        inflation pressures to heel.
Ukraine scenarios see no immediate end to the war,
meaning no pipeline gas flows. In any case, avoiding gas        In Latin American, Brazil is likely to be among the first
rationing this winter only makes Europe’s recession less        major central banks to ease policy as headline inflation is
severe, rather than preventing it.                              dropping sharply. That said, new president Lula’s desire
                                                                to increase social spending poses a threat to that early
In the UK, GDP contracted in Q3, albeit in part due to a        pivot. Meanwhile, much of LatAm will face headwinds
technical quirk. But the weakness of leading indicators,        from lower commodity prices into the global recession,
and the sharp rise in interest rates mean a more                compounded by imbalances in the likes of Chile and
fundamental recession is or will be soon setting in.            Colombia. Emerging Asia is probably best placed, given
                                                                that core inflation has eased notably (excluding Malaysia)
The US economy is clearly slowing, but growth remains           and an end to central bank tightening cycles is within
positive for now. Consumer spending has been resilient,         sight. External vulnerabilities are generally lower,
but we take a more forward-looking signal from the              although there are exceptions such as large current
contraction in housing indicators. Housing is an interest       account deficits in the Philippines and Thailand. But the
rate sensitive sector with a long track record of leading the   global recession will weigh on growth via trade and
economic cycle, and is in a deepening downturn.                 confidence channels, and unlike during the GFC, we don’t
Business sentiment also continues to deteriorate.               expect China to come to the rescue with a major stimulus.

More broadly, our research and analysis continues to            Global headline inflation pressures either already have, or
suggest that taming core inflation pressures requires a         are very close to, passing their peak. Oil prices are some
substantial rise in unemployment, consistent with a US          20-30% below recent highs, and annual base effects are
recession. With the fed funds rate above neutral and likely     now turning negative. This downward pressure on
to rise further, and an inauspicious track record when it       inflation should become even stronger over 2023 as our
comes to engineering soft landings, we expect a US              global recession forecast plays out, even if cross-currents
recession beginning in Q2 2023. But we have more                from China’s reopening and OPEC’s desire to maintain a
conviction in the recession’s inevitability than its timing,    high floor for prices provide a partial offset. European gas
given the “long and variable” lags of monetary policy.          prices are also substantially below recent peaks, thanks
                                                                partly to the warmer than usual autumn weather.
In China, our forecasts are a long way below consensus,
despite excitement about the move away from zero-Covid          But core inflation will prove much stickier. Across labour
and more supportive property sector policies after the 20th     markets, vacancy and quit rates remain elevated, while
Party Congress. The flow of activity data makes clear that      wage pressures are robust. Inflation expectations are also
rising Covid cases are contributing to a near-term              much higher now than pre-pandemic, especially over
worsening in growth. The transition to endemic living is        shorter horizons, with a high degree of anchoring on
2 | abrdn.com
recent inflation experiences. Admittedly, recent somewhat escape”, given what we know about viral mutations.
lower US core inflation prints are encouraging, driven by These scenarios are all consistent with global recession,
moderating goods prices as demand continues to rotate albeit with quite different causes.
back to services. But core services inflation, which is more
tied to the tightness of the labour market stayed very The most likely upside scenario is “Fed walks the
strong in recent prints. tightrope”, reflecting that there is still a path to soft landing.
This scenario is probably closest to that priced into
That means we envisage more interest rate hikes in the financial markets, but requires a lot to go right. Two other
near-term, including another 100bps from the US Fed and upsides we consider are “supply side recovery”, in which
ECB, and 150bps from the Bank of England, by the end inflation moderates without a big policy tightening and
of Q1. The likelihood of the next FOMC dot plot revising slowdown in growth, and “demand side resilience” that
up the terminal rate means the near-term risks are to the sees households and businesses spend accumulated
upside, especially if US economic activity were to hold up savings, governments use stimulative fiscal policy, China
better than we expect. But the key point is that, rather than rebounding more forcefully as it exits zero-Covid, and
allowing the US to avoid a recession, this would mean central banks accommodate above target inflation for
interest rates have to be pushed even higher to bring longer.
about the necessary degree of economic rebalancing to
restore price stability. Taken together, these scenarios constitute a risk
distribution skewed towards weaker growth but higher
The demand destruction during the US and European inflation than the consensus expects. This is a challenging
recessions should ultimately put significant downward backdrop for investors to navigate.
pressure on core inflation. Higher unemployment will
weigh on wage growth and inflation expectations, and the Figure 1: Recession required to rebalance economies
core services component of inflation should weaken. 14%
Forecast
12%
That means central banks will be in rate cutting mode
again by late-2023. Indeed, we think that the speed and 10%
extent of these eventual rate cuts is underestimated. 8%
Running a range of monetary policy rules using our
6%
baseline activity and inflation forecasts points to US
interest rates returning to the effective lower bound by 4%
late-2024. Even an average across all of our recessionary 2%
and non-recessionary scenarios suggests the fed fund 0%
rate would fall to 2%. Admittedly, policy rules don’t take
-2%
into account the many discretionary judgements policy-
making involves. But they are a good way of -4%
Jan-24
Jan-18
Jan-19
Jan-20
Jan-21
Jan-22
Jan-23
Sep-18
Sep-19
Sep-20
Sep-21
Sep-22
Sep-23
Sep-24
May-24
May-18
May-19
May-20
May-21
May-22
May-23
systematically gauging the trade-off between activity and
inflation, and suggest market forward curves are not
anticipating the big rate cutting cycle we think is coming.
Core goods Core services Core CPI
All told, our baseline forecasts envisage multiple
Source: Haver, abrdn (November 2022)
overlapping headwinds driving global recession, a
moderation in inflation, and interest rates back to the Figure 2: Recessions will force significant rate cuts
lower bound. Our 2023 (0.8%) and 2024 (2.0%) global
GDP forecasts are well below consensus. % Projections
5
As always, this is only one of several plausible scenarios.
This quarter we have introduced a new “sticky inflation”
scenario in which monetary tightening triggers recession, 3
but underlying inflation proves more persistent, meaning
a shallower rate cutting cycle. The Fed would not get rates
back to the effective lower bound, so the economy would 1
not recover as quickly as in the baseline.
-1
We remain concerned about imbalances in the Chinese 2015 2016 2017 2018 2019 2020 2021 2022 2023 2024
property sector on top of those already included in our Euro Area Deposit Rate
central case, motivating our “China stress and slowdown” Japan Discount Rate
scenario. And while the new Italian government has US Effective Policy Rate
proved more moderate than may have been feared, we UK Bank Rate
maintain our “European political and sovereign crisis” China 7d Reverse Repurchase Rate
scenario. We also still attach a small weight to “vaccine Source: Haver, abrdn (November 2022)
3 | abrdn.comGlobal forecast summary
On the precipice
Figure 3: Growth and inflation forecasts in our baseline
GDP growth CPI inflation
2020 2021 2022 2023 2024 2020 2021 2022 2023 2024
Global -3.7 6.0 3.0 0.8 2.0 3.3 4.7 8.8 6.3 4.1
DM -4.3 5.3 2.5 -0.9 0.0 0.6 3.1 7.4 4.5 2.2
US -2.8 5.9 1.9 -0.6 -0.2 1.3 4.7 8.1 4.1 2.5
UK -11.0 7.5 4.3 -1.7 0.5 0.9 2.6 9.0 5.9 2.4
Japan -4.7 1.7 1.7 0.7 -0.6 -1.2 -0.1 2.3 1.8 0.0
Eurozone -6.5 5.3 3.1 -1.4 1.0 0.3 2.6 8.6 5.7 2.3
EM -3.3 6.5 3.4 2.0 3.3 5.3 5.9 9.9 7.7 5.5
Brazil -4.2 4.9 3.0 -0.4 0.0 3.2 8.3 9.2 4.7 3.7
Russia -2.6 4.7 -2.7 -1.8 -0.4 3.4 6.7 14.0 5.9 4.1
India -6.9 8.5 7.9 3.1 3.7 6.6 5.1 6.8 4.2 5.0
China -1.8 7.8 1.9 2.6 5.4 2.4 1.0 2.0 1.2 2.2
Source: abrdn (November 2022)
4 | abrdn.comabrdn Research Institute key calls
The global economy is being hit by many, mutually reinforcing shocks. In our baseline, this causes aa global recession
in 2023. The mean across all our scenarios is also consistent with a global recession.
1. Global GDP growth to be at least 0.5ppts below consensus estimate of 2.5% in 2023
While pandemic distortions such as supply chain bottlenecks and base effects from commodity price surge continue to
unwind, labour market dynamics may take longer to ease
2. We expect DM core services inflation on average to remain above 3%y/y in July 2023
Policy interest rates in the US have further to rise, which will send the economy into recession, before a cutting cycle
starts in H2 2023
3. The Fed Funds rate to peak at over 4.75% in 2023
Other central banks will also be hiking interest rates through 2022 and early 2023, but then pause and ultimately cut
rates in 2023 as the global recession bites
4. The ECB to pause its tightening cycle in H1 2023
China GDP falls short of the CCP’s growth targets in both 2022 and 2023 as drags from real estate and disruption
caused by transitioning away from ‘zero-Covid’ combine with a global recession
5. China begins ‘living with’ Covid in H2 2023
5 | abrdn.comScenario overview With our baseline containing a global recession, risks are skewed towards scenarios with higher activity and price levels over 24 months. However, over 55% of our probability mass is occupied by scenarios consistent with a global recession Figure 4: Global growth and inflation in alternative scenarios, relative to baseline, 24 months ahead Source: abrdn (November 2022) 6 | abrdn.com
Quantitative Indicators
Model-implied recession risks reaching critical levels
Our nowcasting models suggest more near-term                      to a higher risk within 3 months than 6-9 months. The
resilience in the US and Japan than the Eurozone and              tightness of the labour market, the continued positive
UK. But our recession risk models suggest that the                output gap and declining consumer expectation are
probability of recession in the US and Germany within             contributing to higher risks within 12 and 24 months. The
the next year is now above 50%.                                   model-based risk of recession by September 2023 has
                                                                  breached 50%. All told the US models imply that the risks
Starting with the near term data flow, there has been a           are tilted towards a later recession start date than in our
clear softening in the PMI surveys, a slowing in industrial       base case.
production, but relative resilience in retail sales. In order
to pull together the signals across the array of partial data     The German recession risk models, which draw upon the
for the key developed market economies, we have                   US recession predictions, as well as domestic variables
revamped our nowcasting models. These models                      suggest the probability of recession by September 2023
generate very short term forecasts of growth by                   is around 60%. This is in line with our judgemental view
combining the signals across partial indicators.                  that the Eurozone, despite entering a recession ahead of
                                                                  the US, will also suffer fallout from the US recession.
Currently, these models suggest there are upside risks to
growth in the US, but downside risks in the Eurozone, UK          We will be updating our nowcasting models weekly as
and Japan (see Figure 5).                                         data for the quarter is released and tracking recession
                                                                  risks on our macro tools page, here.
In the US, fairly robust retail sales in October are offsetting
declines in consumer sentiment, leaving the nowcast for           Figure 5: Nowcast more resilient in US than Eurozone
US GDP sitting above both our own and consensus                                       Q/Q Annualised Growth Rate
estimates for the quarter. We expect consumer demand                                    (Bloomberg Consensus)
to catch-down to the weak survey data in Q4, and also
                                                                                       Q3 2022          Q4 2022
envisage residential investment dragging on growth.
                                                                       US              2.2 (1.9)        2.3 (0.7)
In Europe, the question is not if an economic contraction              UK             -3.8 (-0.8)      -2.6 (-1.2)
will occur, but the extent of the decline in activity. The          Eurozone             0 (0)          -2 (-1.6)
majority of data that we have so far for Q4 are survey-              Japan             1.5 (1.4)        1.5 (1.9)
based and very depressed, so the nowcast may improve              Source: FRED, Haver and abrdn, (November 2022)
as better hard data are incorporated. For Japan, our
models didn’t capture the trade led contraction in Q3 GDP
but do indicate that growth may rebound in Q4.                    Figure 6: US recession risks very elevated
                                                                  100%
Our recession risk framework is another way in which we                                                              24m, 94%
capture and synthesis the data flow. The model translates          90%
how variables have historically behaved around the onset           80%
of recessions into the probability of a recession occurring
in a given time horizon.                                           70%
                                                                   60%                                               12m, 60%
This quarter, we have built out a series of shorter run
models which predict risks within 3, 6 and 9 months to             50%
complement our existing 12- and 24-month models (see               40%                                               3m, 37%
Figure 6). These shorter run models are all predicting a                                                             9m, 35%
fairly similar likelihood of recession between 30-40% by           30%
Q3 next year. The framework we are using allows different          20%                                               6m, 32%
variables to be selected as predictors for different time
horizons. This means that short run probabilities may well         10%
be higher than longer horizons.                                      0%
                                                                          70 75 80 85 90 95 00 05 10 15 20
The high weight given to financial market variables, the
S&P 500 and the yield curve, as well as housing permits                   US Recessions              Average Recession Risk
– which have been contracting for some time – is leading          Source: Bloomberg, Haver, abrdn (November 2022)

                                                                                                                    7 | abrdn.com
Box 1: How bad could the housing downturn become?
Higher rates and falling demand to drive housing contractions, worsening recession
Housing markets are facing headwinds from rising France and Australia, it is above pre-GFC levels,
interest rates and declining real incomes, in some rendering these markets more vulnerable.
cases from a starting point of high valuations and
Taking these various drivers together, our assessment is
over-supply. In turn, the fallout from the housing
that the outlook for housing markets is worst in Australia
downturn is likely to exacerbate the global recession.
and New Zealand, Sweden and Norway, the US and
House price growth in almost all major economies has Canada, and China. The housing downturn should be
either slowed significantly or turned negative through relatively less severe in Japan, Italy, France and perhaps
2022. The three-month on three-month annualised the UK.
change in prices is negative in the US, China, Sweden,
Admittedly, the situation is nowhere near as dire as in
Australia and New Zealand, and has slowed close to zero
2008, outside of frontier markets at least, where banking
in the Eurozone, UK and Canada.
sectors are more poorly capitalised. Systemic contagion
Housing market activity has also taken a hit, with growth through the global banking sector is unlikely given more
in land transactions, new starts, and home sales all tightly regulated and better capitalised lending in the
moderating or turning negative in 2022. advanced economies. And aggregate housing debt to
income ratios are lower now than then.
Activity is falling particularly sharply in the world’s two
largest economies. In the US, housing starts have Nevertheless, the global housing downturn is in turn likely
declined 18% this year, and new and existing home sales to have spill-over effects on GDP via falling residential
are down 28% and 23% YTD respectively. In China, investment, negative wealth effects, and a broader
housing starts and land purchases remain more than 50% tightening in credit conditions. Housing investment as a
below pre-pandemic levels, and have failed to show any share of GDP is elevated relative to the post-GFC period
recovery from the most recent leg down during the in most major economies, and actually above pre-GFC
Shanghai lockdown earlier in the year. peaks in Canada (9% of GDP), Germany (6.5% of GDP)
and the Nordics (5.5-7% of GDP). And as a rule of thumb,
The drivers of the housing downturn are falling household
every 10% decline in house prices lowers consumer
real incomes and rising interest rates, in turn worsening
spending by 0.5%, albeit with a very large range.
mortgage affordability. And many housing markets are
coming off a period of very rapid house price growth Indeed, there is a well-establish link – and lead – from
during the pandemic, high valuations, and (particularly in housing markets to the broader economy. Already, the
China’s case) over-supply and regulatory headwinds. deterioration in US housing indicators is signalling a sharp
rise in unemployment (see Chart 7).
In the US, the average 30-year mortgage rate has risen
from 2.9% to 6.9% in the space of two years. UK and All in all, a global housing downturn is underway and set
European mortgage rates are also up sharply. This is a to become deeper still, and that in turn worsens our
major headwind to new housing market activity. But the expectations for the global recession we are forecasting.
average maturity and size of mortgage debt matters
Figure 7: Housing IS the business cycle
greatly to how much of a headwind this proves to existing
borrowers and therefore defaults. 14
12
The share of floating rate debt is very high in Norway
(90%), Australia (60%), Spain (55%) and Sweden (50%). 10
In the UK, where the vast majority of mortgage debt is 8
fixed, the maturity of that debt is however very short; 6
around half of fixed rate mortgages have a term of two 4
years or less. By contrast, the vast majority of US 2
mortgages are fixed for 30 years. 0
1970
1974
1978
1982
1986
1990
1994
1998
2002
2006
2010
2014
2018
2022
In the US, UK, Germany and Spain, the ratio of housing
debt to income is lower now than on the eve of the Global
US unemployment rate (%)
Financial Crisis (GFC). But in Norway, Sweden, Canada,
New housing starts, months of supply at current sales
pace, 18 month lead
Source: Haver, abrdn (November 2022)
8 | abrdn.comInflation
Headline peaking and recession to lower core. But persistence is key to monitor
We think that global headline inflation is peaking and inflation environment and begin to change price and wage
that the policy-induced recession we are forecasting setting behaviour accordingly.
will bring down core inflation significantly. However,
prolonged periods of elevated inflation can lead to If firms anticipate continued price rises, but can only
greater persistence if firms and households start change their prices infrequently, then they may set their
placing more weight on past inflation rather than own prices in a way that overshoots the current price
central bank targets when forming expectations. This level. This mechanism gives inflation an upwards quality
helps motivate the new “sticky inflation” scenario we which may make it stickier even into a recession. The
have introduced into our scenario distribution. greater the uncertainty over how fast prices rise, the
greater the incentive to overshoot and cushion against
Many of the pandemic and war-related inflationary drivers future price increases. We taker a deeper dive into these
are starting to unwind. Even with still relatively elevated dynamics in this note.
oil and gas prices, the energy base effects on inflation are
declining. And in a recession, energy prices would likely Central banks may hope that the same Phillips curve
fall much further and be a large disinflationary force. steepness that meant inflation rose rapidly holds as the
economy cools. In this case, there is a low “sacrifice ratio”,
Scarcity of intermediate inputs such as semi-conductors which means relatively fewer jobs need to be lost to tame
disrupted a broad range of products through 2021 and inflation. However, if price and wage setting behaviour
2022. This, and the strength of post-pandemic goods has become sufficiently backward looking and anchored
demand, pushed core goods prices to multi-decade highs. on the recent high inflation experience, then the economy
But here too, inflationary forces are moderating, and in may be on a flatter point of the Phillips curve as
cases like used cars, deflating, as supply chains are unemployment rises. In this case, the sacrifice ratio would
repairing and demand rotates towards services. be higher. This means policy has to be much more
restrictive and the economic cost becomes much greater.
However, services inflation is proving much stickier.
Bottlenecks have intensified across many countries over We continue to think that most policymakers are willing to
the past 6 months, as pent up demand has pushed up make this sacrifice. But political and societal pressures on
against labour shortages. Vacancy and quit rates remain central banks may rise during the recession. The cost of
elevated and indicate a much tighter labour market than pausing or pivoting too early could take many years to
otherwise implied by the unemployment rate. repair. A deeper unwillingness to accept the economic
costs of controlling inflation could become a gateway into
The labour force participation rate also remains below our alternative, permanently-higher, inflation paradigms.
pre-pandemic norms in many countries. Population aging
is causing workers to exit the labour market. aRI key call: While pandemic distortions such as supply
Immunocompromised individuals are reluctant to return to chain bottlenecks and base effects from commodity price
service sector work. And sectoral and geographic surge continue to unwind, labour market dynamics may
demand and supply mismatches appear to have take longer to ease. We expect DM core services inflation
increased. on average to remain above 3%y/y in July 2023.
Meanwhile, although house prices have now peaked and Figure 8: Labour market dynamics driving inflation
private rents are growing more slowly in many economies, 6
it will take some time before these shifts in the housing
market will be reflected in some consumer price indices.
4
The upshot is that it is the evolution of service sector
inflation that holds the key to how quickly core inflationary 2
pressures will dissipate over the next 1-2 years. Our
baseline is that recession will put substantial downward 0
pressure on core services inflation. But inflation
expectations will play a crucial role.
-2
Consumer, business and market inflation expectations 2019 2020 2021 2022
are higher now than they were before the pandemic, but Oil Non Fuel
remain seemingly well-anchored at longer tenors. FX Vacancy rate
However, with persistently high inflation, there is a risk Supply chains Residual
US CPI
that households and firms acclimatise to the higher
Source: Bloomberg, abrdn (November 2022)
9 | abrdn.comMonetary policy
Back to the lower bound?
The outlook for monetary policy in developed further upward revisions to the peak rate. We would tend
markets can be characterised by the answer to three to frame any US demand-side resilience less as a reason
questions: 1) how much higher do rates need to to down-weight the possibility of a recession, and more a
increase? 2) how long will monetary policy stay sign that the short run r* is even higher than expected. In
contractionary for? 3) how low will rates go when an which case, interest rates would need to be pushed higher
easing cycle commences? We continue to expect a to bring about the necessary degree of economic
number of large rate increases into early next year. rebalancing to restore price stability.
We then expect central banks to keep rates on hold
for some time even as recessions start to bite, before Chair Powell also used his press conference to stress the
rates eventually fall back to the effective lower bound importance of keeping policy restrictive for some time to
across a swathe of countries by the end of our bring inflation back under control. He argued the Fed
forecast horizon. could always cut rates if it turned out policy was too
restrictive, but excessively easy policy would risk de-
In the US, we expect the Fed to hike rates by a further 100 anchoring inflation expectations and be much more
bps, with two further 50bps moves in December 2022 and painful to eventually correct.
February 2023. This will take the Fed Funds target range
to 4.75%-5%. In his press conference following the This is a reversal of the standard balance-of-risks
November FOMC meeting, Chair Powell heavily hinted at argument the Fed deployed for much of the post-financial
the prospect of the next FOMC ‘dot plot’ of rate projections crisis period, when the idea was that the presence of the
showing a higher peak rate than the September vintage. lower bound meant that over-tightening was riskier than
over-easing.
We are inclined to fade the signal from any upward
revision to the dots on the basis that we think the economy We read this as consistent with our forecasts, which show
will be in recession in Q2 next year. It is difficult to see the rates being kept at the terminal rate until September next
Fed being able to realise a higher policy rate than we are year even as the recession starts to bite. However, once
forecasting in that context. the rate of core inflation has credibly fallen back to a level
consistent with the inflation target we see the Fed cutting
However, if US economic activity holds up better than we rates rapidly back to neutral, before cutting to the effective
expect around the turn of the year, there is scope for lower bound in 2024.
Figure 9: Further rate increases followed by a substantial rate cutting cycle
% Projections
7
5
3
1
-1
2015 2016 2017 2018 2019 2020 2021 2022 2023 2024
Australia Policy Rate Euro Area Deposit Rate
Japan Discount Rate US Effective Policy Rate
UK Bank Rate China 7d Reverse Repurchase Rate
India Policy Rate
Note: dotted lines indicate our current policy rate forecasts by region.
Source: Haver, abrdn (November 2022)
10 | abrdn.comTo calibrate the speed and extent of the Fed’s easing And if anything, UK fiscal policy is now being set to limit
cycle, we consulted a variety of monetary policy rules. the degree of monetary tightening required.
While such rules are far from an infallible guide to policy,
and don’t take into account all the discretionary A higher terminal fed fund rates will keep the pressure on
judgements policy-making involves, they are a good way EMs in the near-term, limiting their ability to pivot towards
of systematically gauging the trade-off policy makers face growth concerns. The real test will come from the delayed
between activity and inflation. Moreover, by averaging easing cycle by the Fed, which poses a major challenge
across a broad range of different rules, we can reduce the to emerging markets.
error that comes from relying on any particular version.
We expect most EM central banks to hold-off monetary
Conditional on our inflation and unemployment forecasts, easing until the Fed moves, keeping monetary conditions
these policy rules point to rates falling back towards zero, tight through the initial phases of the global recession and
if not slightly below. That is why we continue to see this ultimately aggravating economic downturns. Bouts of
easing cycle involving rates returning to zero, but without volatility, increased risk premia and higher debt burdens
the use of asset purchases which marked previous lower could also limit the extent EMs can implement fiscal
bound episodes, when the “appropriate” policy rate was support. That said, outside frontier markets, major EMs
in deeply negative territory. are well placed to avoid major crises.
However, given the uncertainty around our inflation China is at least not constrained in its ability to ease
forecasts, we also formally modelled a scenario in which monetary and fiscal policy and should offer some shelter
inflation proves to be stickier into the recession. In this for its nearest trading partners when the global downturn
case, the cutting cycle would be more modest with rates unfolds.
only just returning to a neutral setting under some policy
rules. Indeed, the average policy path across all our That said, China is highly unlikely to launch a stimulus
scenarios sees rates “only” declining to around 2% by the equivalent to the RBM 4 trillion package it launched after
end of the forecast horizon, albeit this is still well below the Global Financial Crisis which helped China and the
market pricing. wider EM complex escape relatively unscathed. Policy
may further rotate to infrastructure and investment, which
In the Eurozone, after delivering 200bps of hikes, the ECB has a higher import intensity, but its desire to hold the line
looks set to slow the pace of its hikes to 50bps per on its de-risking campaign implies that this time round it
meeting. The ECB’s rhetoric seems to have become will provide only a partial offset to the shock emanating
increasingly concerned with growth, suggesting we are from DM.
close to the end of the hiking cycle.
Figure 10: US policy rates fall in most scenarios
“Quantitative tightening” is likely to commence in
December, but the ECB is trying to take the ‘drama’ out of 7.0
this decision, seeking to limit spread-widening even as 6.0
broader financial conditions are tightened. In another sign 5.0
of the complex nexus between monetary and fiscal policy 4.0
and government bond markets, ECB policy makers have 3.0
suggested they are uncomfortable with European 2.0
governments easing fiscal policy significantly. 1.0
0.0
The possibility of a clash between monetary and fiscal
Jun-23
Jun-24
Feb-23
Feb-24
Dec-22
Dec-23
Dec-24
Aug-22
Aug-23
Aug-24
Oct-22
Apr-23
Oct-23
Apr-24
Oct-24
policy makers was clearly demonstrated in the UK, where
for a period after the last government’s mini-budget it
seemed like the risk of fiscal dominance was increasing Weighted avg across scenarios
dramatically. However, the rapid fall of the Truss Sticky inflation
government and return to more orthodox policy suggests Latest Forecast
that there are powerful guardrails against this outcome.
Source: abrdn (November 2022)
11 | abrdn.comBox 2: A Natural Language tool to assess Fed communication
Our propriety indicator of Fed rhetoric is showing no signs of a dovish ‘pivot’
Central bank communication is both a source of In particular, we find that Fed chairs tend to lead the
guidance about the short term path of monetary overall score. This reinforces the importance of tracking
policy, and a direct driver of broader financial current Chair Jay Powell’s tone.
conditions. As such, a shift in the tone of central bank
The interaction between the indicator and financial stress
communication is a crucial source of information for
helps to formalise the two-way relationship between
investors and central bank watchers. However, the
monetary policy and financial market developments.
frequency at which new pieces of central bank
Crucially, the correlation structure and causal relationship
communication appears, and the variety of views
between financial stress and communication tone is state
represented among different policy makers means
contingent. In some periods, the Fed drives financial
that it can sometimes be difficult for investors to
conditions, with hawkish communication causing a
distinguish ‘signal’ from ‘noise’.
tightening in conditions, and dovish communication
We have harnessed natural language processing causing an easing of conditions. At other times, the Fed
techniques to build a tool that assigns hawkish and dovish is responding to moves in financial conditions, with a rapid
scores to US Federal Reserve communications (the full and unwarranted tightening in financial conditions causing
research paper is here). This allows us to systematically a dovish shift in communication from the Fed.
classify the tone of such communication, and alongside
As such, the fact that we are currently in a period of
expert judgement, is a powerful tool in understanding how
elevated financial stress does not mean investors should
the US policy environment is evolving. Our tool can be
expect the Fed’s tone to become more dovish any time
used to score each incoming piece of Fed
soon. Tighter financial conditions are a necessary
communication, helping investors formally assess the
outcome for the Fed as part of its battle against inflation.
significance of the piece and whether any market reaction
Indeed, our indicator is not flagging a meaningful Fed
it may have precipitated is appropriate.
pivot, with the latest reads remaining firmly in hawkish
Our tool picks out crucial turning points and other stand- territory.
out policy events in recent economic history. For example,
We will continue to monitor Fed communications closely
it registers a sharp shift into dovish territory in the
as we approach the end of this tightening cycle, and move
aftermath of the financial crisis and the onset of
into what we think will become a sustained easing cycle
quantitative easing. It picks up sharp moves into hawkish
from the second half of next year. Our tool shifting into
territory around the ‘taper tantrum’ in 2013, and follows
dovish territory will be a crucial waymark in this move.
the Fed’s slow journey to policy ‘lift-off’ with a gradual
move into hawkish territory by 2015. It then moves sharply Figure 11: No let-up in hawkish signal from our tool
lower with the onset of the pandemic as the Fed delivered
a huge package of easing measures. And finally, it shows
1.0
a rapid increase in hawkish sentiment as the Fed moved Hawkish
to tighten policy from late 2021 onwards in response to
surging underlying inflation (see Figure 11). 0.8
More formally, movements in the tool lead and Granger 0.6
cause the shadow rate and it leads several key market
interest rates, including the 2-year and 10-year Treasury 0.4
bond. These relationships mean our tool can help
investors forecast future policy changes and provide a 0.2
potential trading signal around key rates markets. Dovish
By analysing the communication of Fed members and 0.0
comparing them to the overall index, we can help 1996 2000 2004 2008 2012 2016 2020
investors identify through time those policymakers that Monthly H-D Indicator Smoothed H-D Indicator
are of particular significance and so worthy of close
attention in forming views about the likely path of policy. Source: abrdn (November 2022)
12 | abrdn.comPolitics
US midterms pave a rocky road to 2024
The results of the US midterms, in which Democrats funding cuts for regulatory agencies, as well as cuts to
lost control of the House but retained the Senate, will social security, which are likely to be strongly resisted by
usher in a new period of political gridlock. President President Biden. Negotiations will begin on 1 October
Biden will largely be unable to implement fiscal 2023, but failure to find an agreement by the end of the
policy. The risk of brinkmanship over government year would result in a partial government shutdown. A
budgets and the debt ceiling is high, exacerbated by protracted shutdown would risk creating further
a fractured Republican party in the House. headwinds for the US economy.
In the US midterms the Democrats performed towards the The lack of bipartisan agreement over what areas of tax
upper end of expectations despite significant headwinds. and spend to target to achieve a reduction in federal
Weighed down by poor candidate choice and voter spending further decreases the likelihood of major fiscal
reaction to the reversal of Roe vs Wade, Republicans initiatives passing in the House. Republicans will likely
suffered from the loss of independent voters, failing to win enforce tighter fiscal policy, preventing President Biden
the Senate and winning control of the House with a single from passing any additional large fiscal packages, even
digit majority. as the recession we are forecasting bites.
Democrats will respond to the loss of the House by If the Democrats do not succeed in raising the debt ceiling
attempting to pass a significant volume of legislation in the during the lame duck, the risk of a return to 2011 style
lame duck session. Key priorities will be passing a brinkmanship is high. Current projections estimate the “x-
government budget by 16 December to avoid a partial date” – the day when the federal government can no
government shutdown. Congress will also approve an longer meet all its obligations in full and on time – will likely
additional $38bn in aid for Ukraine. Although still under arrive in early Q3 2023. This would likely mean
consideration, the pre-emptive raising of the debt ceiling negotiations begin in earnest by the early summer.
appears to be unlikely, as the Republican leadership has
indicated it would not provide the necessary support to Protracted negotiations over the debt ceiling risk affecting
overcome a filibuster. the US credit rating and increasing the risk premia on
Treasuries. That said, the 2011 brouhaha ultimately
A narrow Republican majority in the House and an lowered yields as investors preferred to hold bonds over
increasingly divided party will result in a chaotic riskier assets. While there remains a likely limit to the
Congress. House Republicans are likely to try to use financial and political repercussions the Republican
major fiscal events as leverage to extract policy leadership would be comfortable with, the likelihood of
concessions from Democrats, but are divided on what negotiations running extremely close to the x-date is high,
these concessions should be. There remains some as is the risk of House Republicans failing to agree on an
common ground among Republicans on pushing for a cut acceptable outcome.
to the top rate of income tax, as well as cuts to federal
spending and immigration reform. However, the extent of Faced with political paralysis at home, Biden is likely to
these cuts, and the level of brinkmanship House members turn his attention to foreign policy, where common ground
are willing to pursue to achieve them, varies significantly. with the Republicans has been easier to find. Relations
These divisions further decrease the likelihood of with China have stabilised somewhat thanks to a meeting
legislative progress over the next two years. with President Xi, but policy tensions over trade, security,
Taiwan and Russia will continue to act as barriers to any
Republicans are also likely to use control of influential meaningful progress. Both countries will continue to
committees to launch a series of investigations, including pursue an economic and security policy that creates
into ESG investing. While any anti-ESG legislation is disagreement, meaning risks for global markets.
unlikely to make it through the Democrat-controlled
Senate, Republicans are likely to scrutinise the approach Continuing support for Ukraine is also likely to be a focus
of the asset management industry and regulators, for Biden. Republicans have called for greater scrutiny of
potentially increasing media interest. More importantly, Ukrainian aid, but its leadership have stopped short of
the Department of Labour recently announced a calling for an end to funding. Biden is likely to ask for
regulatory rule allowing pension funds to consider ESG smaller funding amounts at a time , potentially leading him
factors when making investment decisions. to put pressure on other Ukrainian allies, particularly the
EU, to step up contributions.
The distance between the two parties on fiscal matters
makes the passage of the 2024 government budget a
likely flashpoint. Republicans are extremely likely to seek
13 | abrdn.comThe UK and Italy delay hard choices, while Germany goes its own way
The very challenging economic backdrop will put However, a fractured Assembly poses a significant block
pressure on governments across the UK and Europe, to Macron’s reform agenda. We expect pension reform to
who must balance inflationary pressures with the be forced through in early 2023, but Macron is extremely
economic downturn. Failure to find common ground unlikely to be able to implement his planned labour market
on fiscal policy will continue to create tensions reforms. Without these, he is unlikely to meet the
across the Eurozone, while the UK has left the most government’s target of a falling budget deficit by 2027.
difficult decisions on fiscal consolidation for future Indeed, Macron may be tempted to hold a snap
governments to address. parliamentary election once the economic outlook
improves, though this is unlikely to be before 2024.
In the space of two months, the UK has swung from
significant fiscal easing under former Prime Minister Liz Germany post-Merkel continues to chart a significantly
Truss, to fiscal consolidation (relative to the previous different course, angering EU member states with its
path) worth £55 billion (around 2% of GDP), split between willingness to go it alone on fiscal matters, including the
£25 billion in tax increases and £30 billion in spending response to high gas prices. The German government
cuts (see Figure 12). has announced a generous energy support package
worth €200bn, well beyond the levels of support smaller
Crucially, the bulk of planned spending cuts are member states are able to provide, while blocking
scheduled for after the end of the current spending review progress on joint EU initiatives. Without a joint EU policy,
period in 2025. This concentrates planned spending cuts Germany’s fiscal example may tempt other EU countries
after the next general election, representing a time bomb to copy its big spending approach, though France and
of sorts for the next government. Italy have so far avoided doing so.
While the announcement was strongly focused on Germany also appears to be at odds with other member
restoring fiscal credibility with markets and addressing the states on the reform of EU fiscal rules. In recognition of
UK’s recession, another course reversal ahead of the next significantly higher post-pandemic debt burdens, the
general election is likely. The continuation of below- Commission has proposed a more bespoke approach to
inflation pay awards increases the likelihood of strikes debt reduction, with additional fiscal space for investment.
across the public sector. The OBR forecasts see living In exchange, a stricter enforcement procedure would be
standards falling by 7%, wiping out the previous 8 years’ introduced, making enforced fiscal tightening more likely
growth, while house prices are expected to fall by 9% by for high-debt states in the future. Germany remains the
Q3 2024. Faced with this, the government is likely to lone holdout among member states on an agreement. If it
loosen fiscal policy by early 2024 or perhaps sooner. adopts a pragmatic approach, agreement in exchange for
slightly less fiscal flexibility is the most likely outcome,
In Italy, the new coalition government has established an though the credibility of those restrictions remains
early focus on avoiding controversy in the EU. It’s draft questionable. The new debt rules would then be factored
budget, which introduced an energy windfall tax, focuses into the 2024 budgets of member states.
on providing support for energy bills, while targeting a
deficit of 4.5%, higher than the 3.4% forecast in Figure 12: UK spending cuts are backloaded
September. Prime Minister Meloni is unlikely to seek
confrontation with the EU as Italy continues to benefit 55
from Recovery Fund support and advocates for EU wide
energy support. However, domestic pressures may affect 50
her ability to stay the course with the EU.
45
While Meloni is successfully walking the tightrope of
expectations at home and abroad for now, longer term 40
risks remain over the stability of the coalition. As Italy
faces an economic downturn amid very high inflation, 35
2012-13
2010-11
2011-12
2013-14
2014-15
2015-16
2016-17
2017-18
2018-19
2019-20
2020-21
2021-22
2022-23
2023-24
2024-25
2025-26
2026-27
2027-28
pressure for deficit spending within the coalition and
across its voter base will increase. Having presented
optimistic forecasts as part of its budget, the likelihood of
additional government borrowing in 2023 is high. Public Spending as a share of GDP (outturn)
March 2020 forecast
France will continue to struggle with political gridlock, as March 2021 forecast
President Macron grapples with the loss of his majority in March 2022 forecast
the National Assembly. Macron has successfully used November 2022 forecast
November 2022 pre-measures forecast
Presidential powers to force through the 2023 budget and
will continue to be able to implement fiscal policy in this Source: OBR (November 2022)
manner.
14 | abrdn.comBox 3: COP27- have the gaps been bridged?
The ‘implementation COP’ still left critical gaps between promises and credible action
Ahead of COP27 we highlighted four gaps that emissions and removals and that these are not
needed to be addressed for the conference to be overestimated.
considered a success: the ambition, credibility,
justice and adaptation gaps. Despite progress in Another prominent area was blended finance: public-
some areas, the conference didn’t go far enough to private partnerships designed to mobilise spending and
close these gaps and left objective of holding investment on climate-related priorities that would
temperature increases to 1.5°C on life support. otherwise not take place. While the potential is exciting,
there are some significant challenges to overcome,
The progress on the ambition gap was particularly including: moving financing away from the easy to reach,
underwhelming. A lack of meaningful updates to country safe low-hanging fruit; and ensuring that governments are
pledges means that we are still on a global 2.4°C warming not just deflecting their own responsibilities onto the
trajectory. This was not addressed sufficiently at COP27 private sector.
despite the agreement to ratchet up these pledges
following COP26. This creates a worrying and widening It is perhaps the justice gap where the most publicised
misalignment between where country pledges are progress was made. For the first time, the topic of loss
projected to take us (a 10% increase in emissions by and damage was on the agenda and the creation of a loss
2030) and what is expected of investors and corporates and damage fund was hailed as a breakthrough in the
(a 50% decrease in emissions by 2030). final implementation plan. But as yet there is no real detail
on how much should be paid in, on what basis and by
The EU had pushed for stronger backing of 1.5°C, whom. The amounts that have already been pledged are
ensuring that the mitigation programme went beyond small and dependent on further approvals in developed
what was established at the last COP. At some points in nations. Until we see actual finance flows, it is just another
the conference, it was feared that the 1.5°C goal would be pledge – particularly given that the $100bn climate
compromised to find agreement elsewhere. However, the finance pledge from many years ago to support
goal did stay alive within the language of the outcome developing countries has still not been delivered. The
document. While the investment community also supports issue of responsibility will also continue; to make it on to
aligning private financial flows with net zero 2050 agenda at all required the concession that the fund would
ambitions financial institutions are becoming more honest be based on ‘cooperation and facilitation’ rather than
about the dependence on accelerated policy change. ‘liability or compensation’.
The credibility gap needed to be closed through The adaptation gap was also a strong focus at this COP.
implementation action. Indeed, this COP was billed as the The Sharm-el-Sheikh Adaptation Agenda was launched
‘implementation COP’ – putting plans for tackling climate with clear adaptation outcomes for 2030 to enhance
change into action and holding nations to account for the resilience in the most vulnerable regions. There was wide
promises they had made. While another long list of acknowledgement that the global financial system needs
implementation initiatives was announced and launched an overhaul to mobilise private capital into adaptation
at COP27, there was a limited read-through to aggregate solutions, as only 2% of adaptation finance currently
climate outcomes. comes from the private sector. Reforming the role of
multilateral development banks to de-risk the landscape
The meetings continue to put the financial system front and enable blended finance was emphasised, with stark
and central in closing the gap. The final communique criticism of the World Bank.
noted the need for “transformation of the financial system
and its structures”, and called on multilateral development Figure 13: Climate gaps are heavily interdependent
banks and international financial institutions to reform
their practices and prioritise to address the climate
emergency.
Voluntary carbon markets (VCM) featured quite
prominently in discussions, with multiple initiatives
launched to support their critical role in scaling up finance
to emerging and developing economies. But to be
effective, the current flaws of the market need to be
recognised and corrected in order to ensure quality and
create essential trust. One of the main issues is ensuring
that carbon projects genuinely create additional avoided Source: abrdn (November 2022)
15 | abrdn.comYou can also read