Global Satisfaction with Democracy 2020 - University of ...
←
→
Page content transcription
If your browser does not render page correctly, please read the page content below
REPORT

Global Satisfaction
with Democracy
2020
This report was prepared at the Bennett Institute for Public Policy at the
University of Cambridge and forms part of the work of the new Centre for
the Future of Democracy.

Suggested citation:
Foa, R.S., Klassen, A., Slade, M., Rand, A. and R. Williams. 2020. “The Global Satisfaction with
Democracy Report 2020.” Cambridge, United Kingdom: Centre for the Future of Democracy.

Report published January 2020

The Bennett Institute for Public Policy at the University of Cambridge aims to become a
world leader in achieving successful and sustainable solutions to some of the most pressing
problems of our time.

Our goal is to rethink public policy in an era of turbulence and growing inequality. Our research
connects the world-leading work in technology and science at Cambridge with the economic and
political dimensions of policy making. We are committed to outstanding teaching, policy
engagement, and to devising sustainable and long lasting solutions.

www.bennettinstitute.cam.ac.uk

The Centre for the Future of Democracy was launched in January 2020 to explore the
challenges and opportunities faced by democratic politics over the coming century.

Based at the Bennett Institute for Public Policy, the goal of the Centre is to understand the
prospects for democracy in broad historical and international perspective, getting beyond the
immediate crisis to identify different possible trajectories for democracy around the world. This
means distinguishing what is essential to democracy, what is contingent and what can be
changed. That requires taking the long view, drawing on the big picture and expanding our
imaginative horizons. This is what the Centre hopes to achieve, and in doing so it will connect
with work being done across Cambridge in a wide variety of fields, from computer science and
environmental science to history and philosophy.

The Centre’s aim is to move away from a fixation on the here and now, and beyond the who and
what of democratic politics – who is going to get elected, what are they going to do? – to look at
the how. How do democratic decisions get made and how can they be made differently? How can
the consent of losers and outsiders be achieved? How can new social divisions be bridged? How
can the use of technology be brought under democratic control? And if we can’t do these things,
how will democracy not merely survive but flourish in the future?
Contents

1. Executive Summary                                                                                                                                        1

2. Key Findings                                                                                                                                             2

3. Introduction – The Democratic Malaise                                                                                                                    3

4. The Dataset                                                                                                                                              4

5. The Global Picture                                                                                                                                       9

6. Regional Trends and Comparisons                                                                                                                         14
  The Anglo-Saxon Democracies          .   .   .   .   .   .   .   .   .   .   .   .   .   .   .   .   .   .   .   .   .   .   .   .   .   .   .   .   .   18
  Europe . . . . . . . . . . . . . .   .   .   .   .   .   .   .   .   .   .   .   .   .   .   .   .   .   .   .   .   .   .   .   .   .   .   .   .   .   22
  Latin America . . . . . . . . . .    .   .   .   .   .   .   .   .   .   .   .   .   .   .   .   .   .   .   .   .   .   .   .   .   .   .   .   .   .   28
  Sub-Saharan Africa . . . . . . .     .   .   .   .   .   .   .   .   .   .   .   .   .   .   .   .   .   .   .   .   .   .   .   .   .   .   .   .   .   34
  Northeast Asia . . . . . . . . .     .   .   .   .   .   .   .   .   .   .   .   .   .   .   .   .   .   .   .   .   .   .   .   .   .   .   .   .   .   37
  The Middle East . . . . . . . . .    .   .   .   .   .   .   .   .   .   .   .   .   .   .   .   .   .   .   .   .   .   .   .   .   .   .   .   .   .   38
  Southeast Asia . . . . . . . . .     .   .   .   .   .   .   .   .   .   .   .   .   .   .   .   .   .   .   .   .   .   .   .   .   .   .   .   .   .   40
  South Asia . . . . . . . . . . . .   .   .   .   .   .   .   .   .   .   .   .   .   .   .   .   .   .   .   .   .   .   .   .   .   .   .   .   .   .   41

7. Conclusion: Why Are Citizens Unhappy with Democracy?                                                                                                    42

xx.Methodology I: Data Sources                                                                                                                             44

xx.Methodology II: Aggregation Methodology                                                                                                                 46

xx.Methodology III: Testing Semantic Equivalence                                                                                                           47

xx.Methodology IV: Sensitivity Analysis                                                                                                                    54

xx.Methodology V: Detrending the Economic Cycle                                                                                                            56
Global Satisfaction with Democracy Report 2020

1.    Executive Summary

     • We use a new dataset combining more than 25 data sources, 3,500 country surveys, and
       4 million respondents between 1973 and 2020 asking citizens whether they are satisfied
       or dissatisfied with democracy in their countries.
     • Using this combined, pooled dataset, we are able to present a time-series for almost 50
       years in Western Europe, and 25 years for the rest of the world.
     • We find that dissatisfaction with democracy has risen over time, and is reaching an
       all-time global high, in particular in developed democracies.

                                             Page 1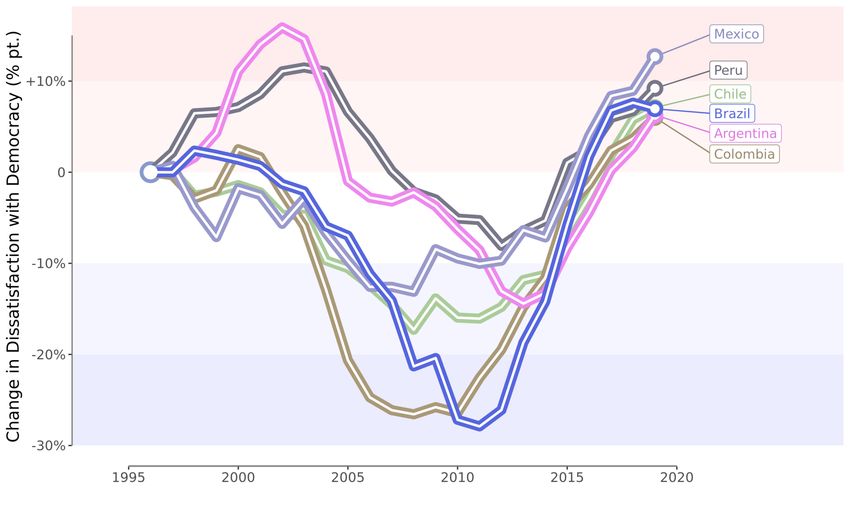
Global Satisfaction with Democracy Report 2020

2.   Key Findings
Across the globe, democracy is in a state of malaise. In the mid-1990s, a majority of
citizens in countries for which we have time-series data – in North America, Latin America,
Europe, Africa, the Middle East, Asia and Australasia – were satisfied with the performance of
their democracies. Since then, the share of individuals who are “dissatisfied” with democracy
has risen by around +10% points, from 47.9 to 57.5%.

This is the highest level of global dissatisfaction since the start of the series in 1995.
After a large increase in civic dissatisfaction in the prior decade, 2019 represents the highest
level of democratic discontent on record.

The rise in democratic dissatisfaction has been especially sharp since 2005. The year
that marks the beginning of the so-called “global democratic recession” is also the high
point for global satisfaction with democracy, with just 38.7% of citizens dissatisfied in that
year. Since then, the proportion of “dissatisfied” citizens has risen by almost one-fifth of the
population (+18.8%).

Many of the world’s most populous democracies – including the United States, Brazil,
Nigeria, and Mexico – have led the downward trend. In the United States, levels of dis-
satisfaction with democracy have risen by over a third of the population in one generation.

As a result, many large democracies are at their highest-ever recorded level for demo-
cratic dissatisfaction. These include the United States, Brazil, Mexico, the United Kingdom,
South Africa, Colombia, and Australia. Other countries that remain close to their all-time
highs include Japan, Spain, and Greece.

Citizens of developed democracies have also experienced a large increase in demo-
cratic dissatisfaction. While in the 1990s, around two-thirds of the citizens of Europe,
North America, Northeast Asia and Australasia felt satisfied with democracy in their coun-
tries, today a majority feel dissatisfied.

While it goes beyond the scope of this report to explain the cause of this shift, we observe
that citizens’ levels of dissatisfaction with democracy are largely responsive to objec-
tive circumstances and events – economic shocks, corruption scandals, and policy crises.
These have an immediately observable effect upon average levels of civic dissatisfaction.

However, the picture is not entirely negative. Many small, high-income democra-
cies have moved in the direction of greater civic confidence in their institutions. In
Switzerland, Denmark, Norway, the Netherlands and Luxembourg, for example, democratic
satisfaction is reaching all-time highs. These countries form part of the “island of content-
ment” – a select group of nations, containing just 2% of the world’s democratic citizenry, in
which less than a quarter of the public express discontent with their political system.

Comparison by region shows a number of other bright spots, above all in Asia. In
democracies in South Asia, Northeast Asia, and above all in Southeast Asia, levels of civic
contentment are significantly higher than in other regions. For now, much of Asia has
avoided the crisis of democratic faith affecting other parts of the world.

                                             Page 2
Global Satisfaction with Democracy Report 2020

3.    Introduction – The Democratic Malaise

Across the globe, democracy is in a state of                have, in turn, supported two corresponding
deep malaise. In the West, growing politi-                  literatures, the former centred on America’s
cal polarisation, economic frustration, and                 “crisis of trust”, and the latter on Europe’s
the rise of populist parties, have eroded the               chronic – though, not necessarily worsening
promise of democratic institutions to offer                 – democratic deficit.3
governance that is not only popularly sup-                     While a number of recent studies have be-
ported, but also stable and effective. Mean-                gun to take advantage of new data from Latin
while, in developing democracies the eupho-                 America, Sub-Saharan Africa, and Asia,4 un-
ria of the transition years has faded, leaving              til now, a genuinely global perspective on
endemic challenges of corruption, intergroup                long-term changes in citizen evaluation of
conflict, and urban violence that undermine                 democratic performance has been lacking.
democracy’s appeal.                                         The fragmentation of relevant data across
   Yet how does our current predicament                     disparate surveys and sources has made it dif-
compare with earlier periods of democratic                  ficult to draw generalisable inferences from
dissatisfaction – such as the “governabil-                  any one single dataset.
ity crises” of 1970s’ Western Europe, or the
emerging market financial crises of the late
                                                             Our Approach
1990s? Does the current anxiety represent a
punctuated equilibrium – or is it part of a se-
ries of cyclical troughs, from which eventualThis report is built upon a simple method-
recovery is likely?                          ological premise: to combine questions on
   This report sheds empirical light on thesesatisfaction with democracy from the widest
questions. It does so using a new dataset that
                                             possible range of available sources, in order
comprises data from over four million survey to generate a global “mega-dataset” – con-
respondents collected during half a century  sisting of more than 3,500 unique country
of social science research. For the first time,
                                             surveys – from which to analyse global trends
we are able to provide a truly global answer over time.
to the question of democracy’s “performance”    The results suggest cause for deep con-
legitimacy – using data from democracies in  cern. Since the mid-1990s, the proportion of
all regions of the world.                    citizens who are “dissatisfied” with the per-
                                             formance of democracy in their countries has
The Research Background                      risen by almost 10 percentage points globally.
                                             The deterioration has been especially deep
Much of the existing academic research upon in high-income, “consolidated” democracies,
trends in satisfaction with democracy has where the proportion has risen from a third
derived from two sources. The first are sur- to half of all citizens. Yet also among many
veys from the United States, such as Gallup emerging democracies – in Latin America,
or the National Election Study, and show Sub-Saharan Africa, and the Middle East –
American satisfaction and trust in govern- confidence in the capacity of democratic in-
ment in long-term decline.1 The second are stitutions has eroded. Many countries in
surveys from Western Europe, notably the these regions are at or near an all-time low,
Eurobarometer, which began from a signif- including systemically important democra-
icantly lower level but show only unclear cies such as Brazil, Nigeria, or Mexico.
fluctuation since.2 These two data sources
 1
   Marc Hetherington (2005) Why Trust Matters: Declining Political Trust and the Demise of American Liberalism.
 2
   Carolien van Ham, Jacques Thomassen, Kees Aarts and Rudy Andeweg (Eds) (2017) Myth and Reality of the Legitimacy
   Crisis: Explaining Trends and Cross-National Differences in Established Democracies.
 3
   For a good overview, see Tom W.G. van der Meer (2017) “Political Trust and the ‘Crisis of Democracy”’, in the Oxford
   Research Encyclopedia of Politics.
 4
   E.g. Marc F. Plattner and Larry Diamond (Eds.) (2008) How People View Democracy.

                                                        Page 3
Global Satisfaction with Democracy Report 2020

4.      The Dataset

Figure 1: Countries for which data on satisfaction with democracy exists in the HUMAN Surveys dataset, by number
          of years of available data. Both democracies and non-democracies are shown in the above graphic; for
          this report, only data from electoral democracies are included in the analysis.

In recent years, discussions of public faith in                tary survey sources, including prerelease data
democracy frequently have generated more                       from the seventh round of the World Values
heat than light. In part, this is due to dif-                  Survey, and individually commissioned sur-
ferences between scholars in their choice of                   veys for October to December 2019 provided
survey sources, country coverage, and pe-                      by the YouGov-Cambridge Centre.
riods of observation. The wide variety of
survey sources now available for compara-                      Satisfaction with Democracy
tive analysis – with over 25 different sources
identified by this study alone – can gener-                    This report examines one indicator of demo-
ate widely varying impressions of individual                   cratic legitimacy – satisfaction with democ-
country and regional trends.                                   racy – across the vast majority of public
   This report aims to provide a comprehen-                    datasets in which such questions have been
sive answer to questions regarding one mea-                    asked.
sure of democratic legitimacy – satisfaction                      It is important to acknowledge upfront
with democracy – by combining data from                        what such questions do, and do not, tell us
almost all available survey sources, using                     about civic attitudes to democracy. The an-
consistent, constant country coverage that is                  swers to such questions primarily tell us how
regionally and globally representative, from                   well citizens perceive their political system
the earliest possible period to surveys that                   to be performing. They offer a weaker basis
were fielded in recent months.                                 for inferring support for liberal or democratic
   The data used in this report represents                     values: individuals may be strong believers
the views of almost all individuals living                     in liberal democracy and yet dissatisfied with
in a system of electoral democracy. The                        the performance of such institutions in prac-
surveys have been gathered and standard-                       tice – or on the flipside, be satisfied with the
ised by the Human Understanding Measured                       institutions under which they are governed,
Across National (HUMAN) Surveys project                        even though such institutions fall well short
(www.humansurveys.org), with additional                        of accepted democratic standards.5
data for 2017–2019 added from supplemen-                          That said, there is value in knowing how,
 5
     See Jonas Linde and Joakim Ekman (2003) “Satisfaction with Democracy: A Note on a Frequently Used Indicator in
     Comparative Politics”. European Journal of Political Research, 42: 391–408; and Pippa Norris (2011) “Does Democratic
     Satisfaction Reflect Regime Performance?” in How Democracy Works: Political Representation and Policy Congruence in
     Modern Societies. Ed. Martin Rosema, Bas Denters, and Kees Arts.

                                                          Page 4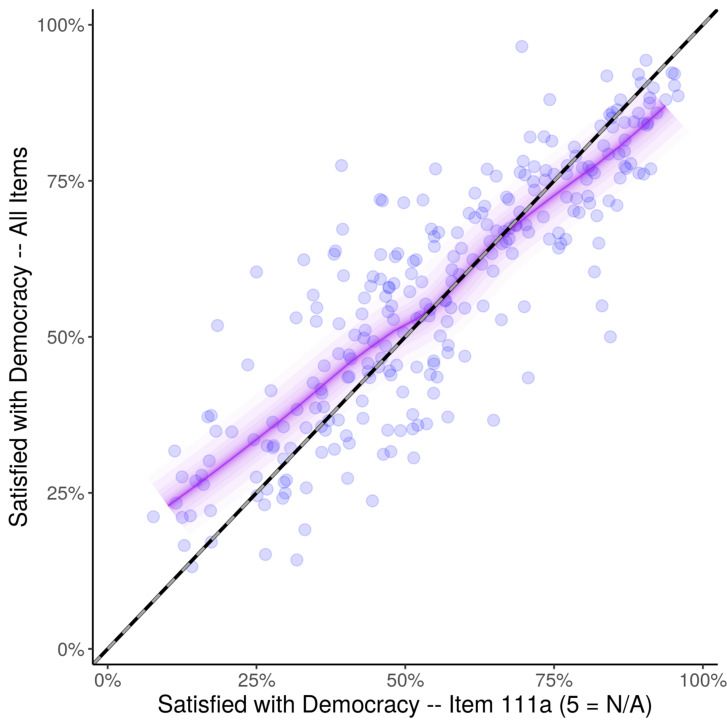
Global Satisfaction with Democracy Report 2020

why and when citizens are losing faith in the               and support for democratic values are con-
ability of democracy to deliver. While sub-                 ceptually separate, they are empirically re-
jective feelings of satisfaction with democ-                lated. Studies show that individuals who
racy may in part reflect higher or lower civic              are dissatisfied with democracy are more
standards, the cross-country evidence makes                 likely to support populist political parties
clear that in countries where political insti-              that eschew liberal democratic norms.7 At
tutions are transparent, responsive, and free               the cross-country level, there is a strong as-
of corruption, civic satisfaction with democ-               sociation between democracies in which the
racy is overwhelmingly high. In Denmark,                    public is dissatisfied, and those in which the
Switzerland, and Luxembourg, political in-                  public express lukewarm support for demo-
stitutions are held to high standards – and                 cratic principles. And as we shall see, many
meet those standards.6 There is no evidence                 of the countries in the 1990s with the lowest
that rising expectations have led to a dete-                levels of democratic faith – such as Russia,
rioration in democratic legitimacy in such                  Venezuela, and Belarus – are exactly those
societies. On the other hand, societies where               which experienced democratic erosion over
satisfaction with democracy is at its lowest                the following decade, often due to elected
are uniformly characterised by political in-                strongmen who in office proceeded to under-
stability, corruption scandals, and ingrained               mine civil rights and liberties.8
societal conflict.
   Second, even if democratic satisfaction

                 Figure 2: Cumulative number of surveys gathered in to the dataset, 1973–2020.

 6
   Mónica Ferrín, (2016) “An Empirical Assessment of Satisfaction with Democracy” in Mónica Ferrín and Hanspeter Kriesi
   (eds.), How Europeans View and Evaluate Democracy.
 7
   Pew Research Center (2018) “Many Across the Globe Are Dissatisfied With How Democracy Is Working”.
 8
   Roberto Stefan Foa and Yascha Mounk (2019) “Democratic Deconsolidation in Developed Democracies, 1995-2018”,
   Harvard Centre for European Studies Open Forum Series.

                                                       Page 5
Global Satisfaction with Democracy Report 2020

Data Selection and Validity

In order to ensure that our data represents              Testing for Semantic Equivalence, and Sec-
a valid measurement of satisfaction with                 tion IV on Sensitivity Analysis).
democracy, the survey questions aggregated                  Having recoded responses into satisfied
in our dataset are subject to strict standards           and dissatisfied and ascertained the percent-
of semantic equivalence. First, they must                age for each category, rolling averages are
ask citizens about their degree of satisfaction          generated by country, while regional aver-
with democracy in their country; items using             ages are generated by merging country sur-
similar, yet related terminology are excluded.           veys to a quarterly or annual data series, and
So too are items asking people their views re-           taking the population-weighted average of
garding democracy in general. Second, they               the most recent observation for all countries
must be coded on a response scale that allows            in that region over time (see Appendix Sec-
for verifiable equivalence with other survey             tion II, on Aggregation Methodology).
response scales (see Appendix Section III, on

 Survey                                                       Data Points     Countries        Years

 Afrobarometer                                                     135            36        1999–2015
 American National Election Studies                                 7             1         1996–2016
 AmericasBarometer                                                 169            33        2004–2016
 Arab Transformations Project                                       6             6         2013–2014
 Asia Barometer                                                    41             25        2003–2007
 Asian Barometer Survey                                            51             20        2001–2016
 Australian Election Study                                          9             1         1996–2016
 Australian National Political Attitudes Surveys                    2             1         1969–1979
 Australian Survey of Social Attitudes                              3             1         2005–2015
 Comparative Study of Electoral Systems                            133            54        1996–2018
 Consolidation of Democracy                                        25             14        1990–2001
 ... in Central and Eastern Europe
 EU Neighbourhood Barometer                                        94             16        2012–2014
 Eurobarometer: Applicant and Candidate Countries                  52             13        2002-2004
 Eurobarometer: Central and Eastern                                10             10           1997
 Eurobarometer: Standard and Special                              1471            34        1973–2019
 European Social Survey                                            194            35        2002–2017
 European Values Study                                             77             45        1999–2018
 Pew Global Attitudes and Trends                                   75             50        2007–2018
 International Social Survey Programme                             189            48        1995–2016
 Latinobarómetro                                                   355            19        1995–2017
 New Europe Barometer                                              30             13        1992–2005
 New Zealand Election Study                                         6             1         1996–2017
 South African Social Attitudes Survey                             11             1         2003–2013
 Voice of the People Series                                        121            69        2005–2007
 World Values Survey                                               84             66        1996–2019
 YouGov Surveys                                                    12             10           2019

Table 1: Data sources used in this study, showing number of survey observations, countries covered, and years of
         available data.

                                                     Page 6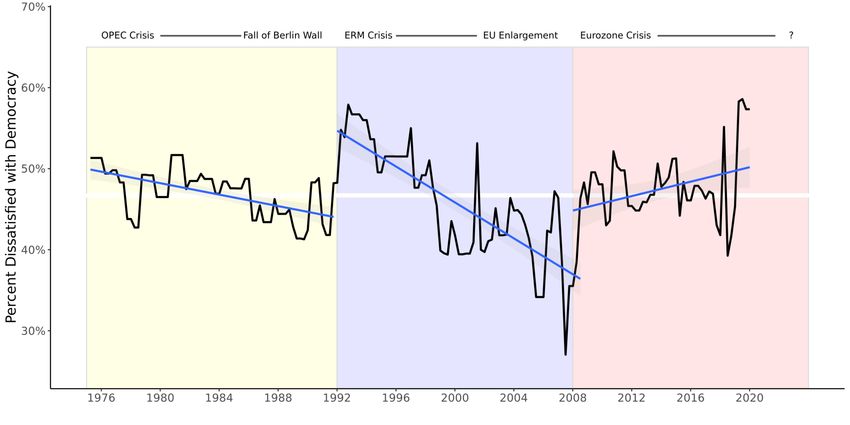
Global Satisfaction with Democracy Report 2020

                               The HUMAN Surveys Project
                                 www.humansurveys.org

   The Human Understanding Measured Across National (HUMAN) Surveys project com-
   bines multiple sources of freely available and nationally representative public opinion
   surveys. Available surveys have traditionally been difficult and time-consuming to
   compare because the same variables have different names and values across different
   sources. HUMAN Surveys uses scripts to format selected variables, merge datasets,
   and harmonise target variables – including satisfaction with democracy, one of the
   most frequently-included items in comparative social research.

   The scripts work by creating “data warehouses” for micro-level individual responses,
   as well as macro-level aggregated country-survey and country-year scores. The respon-
   dent dataset currently includes ten million individuals from 169 countries, combining
   data from over thirty sources, and spanning a period from 1948 to the present. Though
   this report only includes items on satisfaction with democracy, current target variables
   also include social trust, attitudes towards democracy and elections, and confidence
   in political institutions.

   There are many benefits to using merged multi-survey public opinion datasets. As
   this report illustrates, merged data enables unprecedented geographical and tem-
   poral coverage, allowing for a better understanding of trends across regions of the
   world. HUMAN Surveys saves time in managing large amounts of public opinion data,
   allowing scholars to focus more attention on key research questions. The scripting
   framework is designed to facilitate additional data to eventually include all variables
   across all publicly-accessible surveys.

                                            Page 7
Global Satisfaction with Democracy Report 2020
The Presentation of Data in this Report
The purpose of this report is primarily de- averages to smooth over cases where a “rogue
scriptive – to lay out in as clear, uncontro- poll” in a large country can cause a sudden
versial, and systematic means as possible – yet temporary shift in the weighted mean. It
fundamental trends in global public opinion. is more important for regions where survey
For that reason, certain standards in visual data may be collected on a less than annual
communication that are adhered to in the basis (e.g. Southeast Asia or the Middle East).
presentation of data in this report. On the other hand, in cases where the data
are of sufficiently high quality and frequency
1. First, all data for regional or global av- we also present the raw (non-smoothed) se-
erages are averaged based on population- ries on a quarterly basis – e.g. for the global
weighting. This ensures that figures reflect series in Figure 3 and for Western Europe in
an estimated average for the pool of all in- Figure 17.
dividuals in the region under consideration,
and are not disproportionately influenced by
4. Fourth, when presenting regional av-
trends in small- or micro-states (see inset
erages, we show the full possible range of
box, “The Importance of Population Weight-
the data on the y-axis (from 0 to 100% of
ing”).
citizens who are estimated to be dissatis-
fied with democracy), but then highlight
2. Second, we always use a constant-
the “relevant range” of the data within
country sample when presenting aggre-
which most variation across the world
gated data.9 This is to ensure that changes
can be found (between 25% and 75%).
on charts are not due to countries dropping
While it is possible to exaggerate change
in and out of the dataset, but are only due to
by narrowing scales, it is also possible to
changes in actual collected data. We ensure
understate change by widening scales be-
this by only including country cases which
yond a substantively meaningful degree of
are covered by survey data at the start of the
variation. We therefore highlight the area
observation period and the end, and “rolling
that corresponds to variation in political out-
over” survey results in periods in which no
comes in the real world. In the 25% to 75%
new survey data was collected – in effect,
range, four-fifths of countries can be found:
using the “most recent” survey observation
this is the range that separates Sweden and
for each country. Fortunately, because the
New Zealand, at one end, and Venezuela and
dataset includes such a vast number of ob-
Greece, at the other.
servations, for many regions – East and West
Europe, Latin America, North America, and
Northeast Asia – there are few countries that 5. Fifth, when presenting country aver-
lack consistent data, and many countries ages over time, we show all of the in-
with multiple observations per year.10 dividual polling results for that country,
together with a rolling average line be-
3. Third, when presenting regional aver- tween them. Where possible we display
ages at the start of each section, rolling “raw” individual polling in countries, to allow
averages are used in order to smooth be- the reader to infer the reliability of rolling
tween years. This is done for the regional averages and means.
9
The one exception to this principle is Figure 16, showing average levels of dissatisfaction in the European Union. This is
simply because the country membership of the European Union itself changes over time: an accurate representation of
public opinion within the European Union requires country representation to alter in line with the bloc’s membership.
However, changes in country membership are clearly indicated underneath this chart, and Figure 17 presents a second
figure for Europe based solely on the Western European data for countries surveyed since the 1980s, and for which
country sample is constant following the entry of Spain and Portugal in 1985 (plus the incorporation of Eastern Germany
in to the Federal Republic of Germany in 1991).
10
In the United Kingdom, for example, we now have an observation rate averaging four surveys a year for the last decade,
and a similar level among other major European democracies. But also in many developing democracies, we now have
multiple annual observations over the same period – two surveys per year over the last decade in Brazil, Mexico and
South Africa, for example, and at least once per year in Nigeria.
Page 8Global Satisfaction with Democracy Report 2020
5. The Global Picture
Figure 3: Rising dissatisfaction with democracy across the world, in democracies representing 2.43 billion individuals
across Latin America, Africa, the Middle East, Europe, North America, East Asia, and Australasia. Based
on 3,218 separate individual country surveys, classified by date of fieldwork and grouped on a quarterly
annual basis, with the total averaged on a population-weighted basis. A constant country sample is
maintained in all periods by rolling forward observations in country quarters lacking new data, to prevent
sample bias from affecting the changes.
Across the world, satisfaction with democ- Since then, dissatisfaction has continued to
racy has fallen, and dissatisfaction risen, over grow.
the past quarter-century. In the mid-1990s, Overall, we estimate that the number of
citizens in a majority of countries for which individuals who are “dissatisfied” with the
we have data felt satisfied with the perfor- condition of democracy in their countries
mance of democracy in their countries. Bar- has risen by 9.7 percentage points, from 47.9
ring a brief dip following the Asian and Latin to 57.5%. This observation is based on a
American financial crises of the late 1990s, constant-country, population-weighted sam-
this remained broadly the case until 2015, ple of 77 democracies for which data exists
when a majority of citizens turned negative in from the mid-1990s to today. This represents
their evaluation of democratic performance. 2.43bn individuals across the span of Europe,
Page 9Global Satisfaction with Democracy Report 2020
Latin America, Sub-Saharan Africa, the Mid- crisis of 2008, the eurozone crisis begin-
dle East, North America, East Asia, and Aus- ning in 2009, the European refugee crisis
tralasia. of 2015 – have had a profound and imme-
diate effect on public opinion. Following
the onset of the global financial crisis and
the collapse of Lehman Brothers in Octo-
ber 2008, for example, global dissatisfaction
with the functioning of democracy jumped by
around 6.5 percentage points. Much of this
increase, moreover, appears to have been
durable. Conversely, signs of democratic gov-
ernments working together to resolve policy
crises appear to have a positive effect. In the
wake of the European Council’s agreement to
form a European Stability Mechanism, and
the resultant waning of the sovereign debt
crisis, dissatisfaction with democracy fell by
10 percentage points in Western Europe.
Further trends from individual countries –
Figure 4: Weighting of regions in the world aggregate shown in the “country in focus” sections of
starting in 1995, based on countries available this report – provide further country-specific
for the period under observation. Note that cases. In the United Kingdom, for example,
India, for which our survey data begins only
dissatisfaction with democracy has soared
in 2002, is not included in this sample.
in the period of the “Brexit crisis”, approxi-
mately from the aftermath of the 2017 Gen-
Naturally, there are large differences be- eral Election until the most recent surveys
tween regions. In some parts of the world, in November of last year. And in Brazil, the
in particular in North America, Southern Eu- series of scandals exposed by the “Lava Jato”
rope, Latin America, and Sub-Saharan Africa, corruption probe has seen public dissatisfac-
the fall has been acute. In other regions, such tion reach record highs.
as Northeast Asia, their are no clear positive This implies that citizens are ultimately
or negative trends over the study period. And rational in their assessment of democratic
in other parts of the world – notably South- governance, updating their views in response
east Asia, Scandinavia, and Eastern Europe to the flow of information. A constant series
– there is even a silver lining: satisfaction of negative events will push baseline eval-
with democracy has been rising, rather than uations of democratic performance lower,
falling, in recent years. while a stream of positive events will pull
that evaluation back up. If citizen views
Explaining Change of democracy have deteriorated in recent
decades, then there is an least one simple ex-
What, then, can explain the shifts in public planation: democratic governments simply
opinion that we observe in Figure 3? Why have not been seen to provide effective policy
have people, in general, become more dis- solutions to pressing societal problems. The
satisfied with the democracies in which they more visibly democratic governments appear
live? These questions are already the subject to be failing to address problems of public
of a vast research literature; yet the annota- accountability, economic governance, and
tion of the quarter by quarter shifts give us transnational dilemmas such as migration
some initial basis for inference. or climate change, the greater the degree
Once survey data on satisfaction with to which citizens perceive – with some jus-
democracy are aggregated to a quarterly tification – that their institutions are not
annual series, it is clear that specific eco- delivering results.
nomic and political events – the financial
Page 10Global Satisfaction with Democracy Report 2020
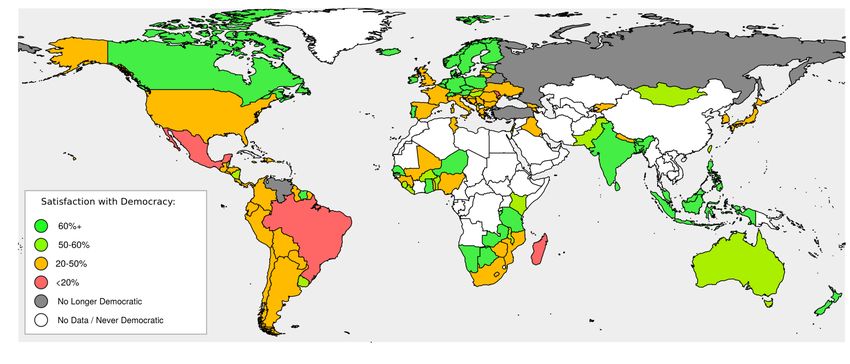
How do these differences correspond with po- enced democratic backsliding since the 1990s
litical changes in the world over time? Follow- – such as Russia, Venezuela, and Belarus –
ing the rapid advance of democracy around were those most susceptible to doing do (Fig-
the world in the 1970s, 1980s, and 1990s, the ure 5).
period since 2005 has been characterised as a Meanwhile, in many countries that have
“democratic recession” in which democratic retained free and fair elections, there is a
institutions around the world have faced set- sense, in the words of Francis Fukuyama, that
backs ranging from military coups, to do- “the performance of democracies around the
mestic crises, to the election of populist or world has been deficient in recent years”,12 a
authoritarian leaders willing to use their of- sense reflected by the growing despondency
fice to erode the independence of parliament, visible across struggling democracies in the
courts and civil society.11 And we find that Americas, Africa, and Southern Europe.
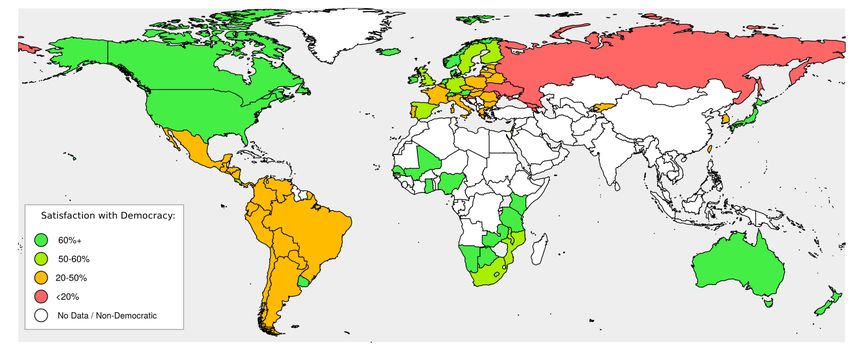
many of those countries which have experi-
Satisfaction with Democracy in the 1990s.
Satisfaction with Democracy Today.
Figure 5: Satisfaction with democracy across the world in the mid- to late-1990s, and today (average of most recent
three surveys).
11
Larry Diamond (2015) “Facing Up to the Democratic Recession”. Journal of Democracy.
12
Francis Fukuyama (2015) “Why Is Democracy Performing So Poorly?”, Journal of Democracy.
Page 11Global Satisfaction with Democracy Report 2020
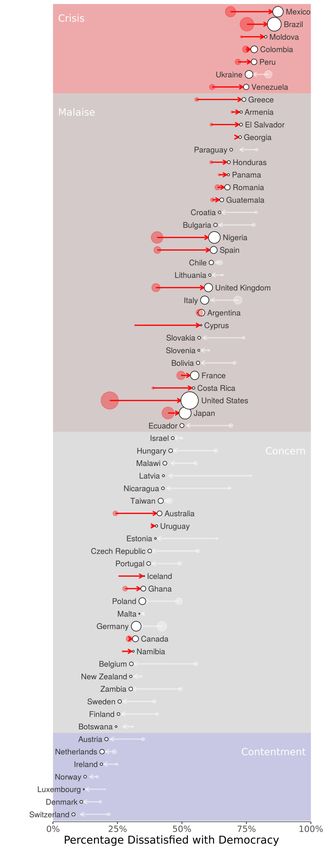
We can also examine these differences over
time by country. Figure 6 shows the change
by country in satisfaction with democracy
from the mid-1990s to the most recent set
of observations, and allows us to distinguish
four broad groups.
The first zone is that of democratic con-
tentment: where more than three quarters
of citizens are satisfied with their democ-
racy. These cases, which include Switzerland,
the Netherlands, Denmark and Luxembourg,
might be considered the world’s “island” of
democratic stability – some 2% of the world’s
democratic citizenry, or 46 million people,
who have thus far avoided the malaise else-
where.
The second group can be labelled as “cases
of concern”, where more than a quarter, yet
less than half, of the population are dissatis-
fied with the country’s institutions. This is
a much larger subset of countries, contain-
ing 393 million people, and includes many of
the new democracies of central Europe, along
with Germany, Canada and Australia. How-
ever many of these societies, in particular in
eastern Europe, have also seen democratic
satisfaction rise in recent decades.
Next, by far the largest group by popula-
tion – accounting for 1.09 billion people –
are the democracies in “malaise”: countries
where a majority (though less than three-
quarters) feel dissatisfied with democratic
performance. It is here that we find many
of the large democracies of the world – the
United States, Japan, the United Kingdom,
Spain and France. With the exception of
France, these are all new entrants to this cat-
egory, having formerly possessed majorities
that were satisfied with their democratic in-
stitutions.
Finallly, there are 377 million people liv-
ing in democracies that face a genuine legiti-
macy “crisis”, insofar as for every citizen who
is satisfied with how the democratic system is
working, there are three who have lost faith Figure 6: Change in percentage who are dissatisfied
with democracy, from mid-1990s (average of
in the process. These countries include Mex- surveys) to latest observation (average of the
ico, Brazil, and Ukraine. This is the subset of three most recent surveys). Points proportion-
countries for which the term “crisis of democ- ate to country population. While most large
racy” may be considered neutral and descrip- democracies have seen rising rate of discon-
tive. tentment, a number of small democracies have
improved, notably in Scandinavia and post-
communist Europe.
Page 12Global Satisfaction with Democracy Report 2020
Methodological Note
The Importance of Population-Weighting
All of the regional averages shown in this By equal-weighting countries, we under-
report are population-weighted averages weight people.
of the countries they contain. This ensures Failure to weight by population can there-
that the reported levels of democratic satis- fore create a highly misleading impression
faction or dissatisfaction are representative of regional and global trends. As the figure
of the total population within that region. below illustrates, the trend among small
Otherwise, using an equal-weighted aver- countries is opposite to that found in the
age of the countries in a region, we arrive world as a whole: yet it reflects the political
at extreme distortions. Each citizen of reality of an extremely small minority of
Luxembourg, for example, with a popula- individuals, predominantly concentrated
tion of 0.62m, would count for 134 citizens in small, wealthy, high-income countries.
of Germany, with its population of 83m.
Figure 7: Changes in levels of democratic dissatisfaction within large democracies (population above
10m) and small democracies (population below 10m). The thickness of the lines is relative to
the total population of each group. While each grouping contains a similar number of countries
– 34 vs. 41 – large democracies here contain 93% of the total population of the two groups.
Page 13Global Satisfaction with Democracy Report 2020
6. Regional Trends and Comparisons
Figure 8: Change over time in democratic dissatisfaction by region from mid-1990s to latest set of observations. For
Southeast Asia, changes are only shown since 2001; for South Asia, since 2002. Regional points relative
to size of region’s population. Dissatisfaction has risen in every region except in South Asia, where it has
remained stable, and Southeast Asia, where it has fallen.
Until recent decades, the vast majority of ture. Moreover, rarely is data simply present
research on political attitudes was based on or missing at random: often it is the countries
data from countries that are, as the acronym with the best institutions (including social
goes, “weird” – that is to say, western, ed- science research institutions) that have pro-
ucated, industrialised, rich and democratic. vided the most data.13 In the rest of this
Yet the phenomenal advance in collabora- report, therefore, we move beyond the global
tive, global survey projects – starting with aggregates in order to examine each region
the World Values Survey and the Interna- on an individual basis. What is the pattern
tional Social Survey Programme in the 1980s, in each major cluster of world democracies?
moving to the Global Barometer projects in And what specific factors could, in principle,
the 1990s, and finally more recent initiatives help to understand the trends that we ob-
such as the Gallup World Poll, Pew Global serve?
Attitudes Survey, and the YouGov-Cambridge
Globalism Project – makes it possible to con- The Overall Picture
duct truly global comparative research.
One of the key findings of such research, Figure 8 shows change over the past gener-
not surprisingly, is that regions differ. Obser- ation in seven major regions: Europe, Latin
vations of trends occurring in one region, are America, Southeast Asia, South Asia, Sub-
not always representative of the global pic- Saharan Africa, the “Anglo-Saxon” democra-
13
Joseph Henrich, Steven J. Heine and Ara Norenzayan (2010) “The Weirdest People in the World?”, Behavioral and Brain
Sciences.
14
Two additional regions, the Caribbean and the Middle East, are excluded due to low population – in the former case due
to low population in absolute terms, and in the latter case as the population of the democratic Middle East is so low.
Page 14Global Satisfaction with Democracy Report 2020
Figure 9: Distribution of democratic dissatisfaction by region (latest data), showing how dissatisfaction varies
among countries within each geographic area. Country points relative to size of country population. In
some regions, levels of dissatisfaction are similar among countries: for example in Northeast Asia, around
50%, or in Southeast Asia, at just 25%. Yet other regions contain high variation – in particular Europe,
which contains some of the highest and some of the lowest levels of dissatisfaction in the world.
cies (North America, Australasia and the Variation Within Regions
United Kingdom), and Northeast Asia.14
Most regions are moving toward greater dis- Figure 9 also shows the variation within each
satisfaction with democracy, though, not all. region by country. Broadly speaking, coun-
In South Asia, the data appear flat since the tries within each region tend to cluster to-
first observations in our dataset (2002), while gether. One significant exception, however,
in Southeast Asia, public satisfaction with is Europe – which contains both the world’s
democracy has improved a great deal since most satisfied, but also many of its least sat-
2001, the year of our first survey observation isfied democracies. This is due to a growing
for Indonesia. The overall ranking of regions divide between northern and southern Eu-
has also changed markedly over time: in the rope, which we detail and explore further
1990s, the Anglo-Saxon countries were the in the Europe section of this report. Else-
most satisfied with democracy and Southeast where in the world, there are clearer regional
Asia the least so, whereas today, their posi- patterns: Latin America overwhelmingly con-
tions are almost reversed. Finally, whereas sists of democracies where citizens are dis-
Latin America was almost alone in the 1990s satisfied with their institutions, while South
for having a majority of its citizens dissatis- and Southeast Asia contain democracies in
fied with the democratic process, now other which civic satisfaction is robust.
regions are catching up.
Page 15Global Satisfaction with Democracy Report 2020
Regional Convergence
Developed and Developing Democracies
While dissatisfaction with the performance the extent that the performance legiti-
of democracy exists across both developed macy of democratic institutions is a feature
and developing democracies, there are im- of democratic consolidation, this implies
portant differences between the two. In that some countries that were previously
developing democracies in Latin America, thought to be consolidated, such as Greece,
Africa, and Eastern Europe, levels of discon- Chile, or even the United States, may have
tent are high – with more than half of re- partly “deconsolidated” in recent years.
spondents typically dissatisfied – yet with As expected during the early post-Cold
only a slight average increase in the last War years, in this respect developed and
quarter century. developing democracies have converged.
In developed democracies, by contrast, However, they have done so more in the
public satisfaction has eroded since the direction of the latter than in the direction
1990s, with levels of discontent rising from of the former.
a third to half of all respondents. To
Figure 10: Changes in levels of democratic dissatisfaction among developed and developing democracies,
since the mid-1990s. Consistent country sample.
Page 16Global Satisfaction with Democracy Report 2020
Regional Divergence
The Asian Exception
While satisfaction with democratic perfor- are satisfied with the performance of
mance has declined across the world over democracy in their countries, compared
the past generation, one region stands to just two-fifths of individuals elsewhere.
as a notable exception: Asia. Whether Not only has this gap existed since the
among the emerging democracies of South- start of widespread surveys across South
east Asia, the developed democracies of and Southeast Asia in the early 2000s, but
northeast Asia, or in the world’s longest- it has widened since. The observation of
established major developing democracy – democratic contentment in Asia, together
India – satisfaction with democratic gov- with the rise of Asia in general, offer the
ernance in the East seems higher than in prospect of a radically different interpre-
other parts of the world. tation of democratic prospects and legiti-
On average almost two-thirds of Asians macy in the twenty-first century.
Figure 11: Changes in levels of democratic dissatisfaction among democracies in Asia, and democracies
outside of Asia.
Page 17Global Satisfaction with Democracy Report 2020
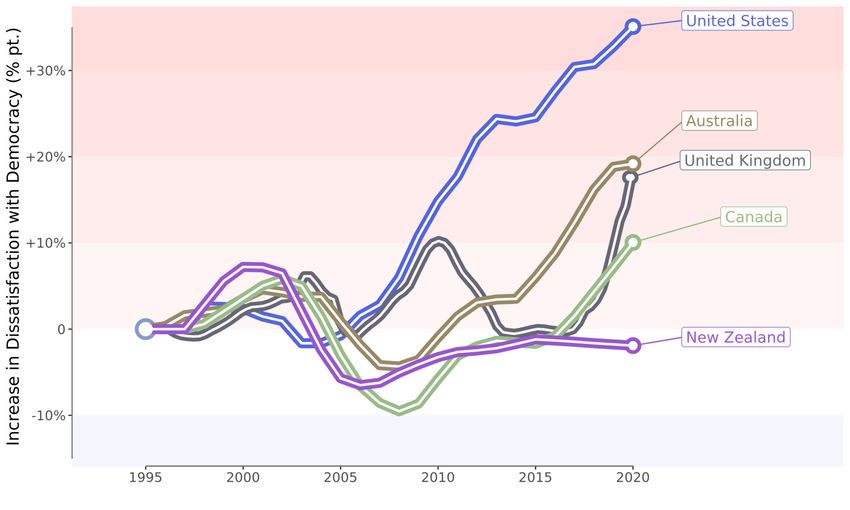
The Anglo-Saxon Countries – the End of Exceptionalism?
Figure 12: Satisfaction with Democracy in the “Anglo-Saxon” Countries: the United States, Australia, Canada, New
Zealand, and the United Kingdom.
In recent years, there has been an especially tenth of Canadians (Figure 13).
acute crisis of democratic faith in the “Anglo- What can explain this synchronised down-
Saxon” democracies – the United States, Aus- turn in public sentiment across high-income,
tralia, Canada, New Zealand, and the United English-speaking democracies? First, given
Kingdom. Overall, the proportion of citizens the concurrence of the shift with the tim-
who are “dissatisfied” with the performance ing of the global financial crisis, economic
of democracy in these countries has doubled factors may play an important role. Yet this
since the 1990s, from a quarter, to half of all explanation, while a part of the story, would
individuals. struggle to explain why Australia, which
Though much of this increase is accounted largely avoided an economic downturn af-
for by the United States, public levels of ter 2008, appears as negatively affected as
confidence have also slipped in the United Britain and the United States. An alternative
Kingdom, Australia, and Canada. While the though related view is that the financialisa-
proportion of Americans who are dissatis- tion of the U.S., British, Canadian, and Aus-
fied with democracy has increased by over tralian economies has led to this outcome
one-third of the population (+34 percentage by exacerbating spatial inequality between
points) since the mid-1990s, this amount has a handful of successful, globally-integrated
also risen by one-fifth of the population in cosmopolitan cities – New York, London,
Australia (+19 percentage points) and Britain Toronto, or Sydney – and the rest of their
(+18 percentage points), and by almost a societies. Evidence suggests that rising in-
15
Sung Min Han and Eric C.C. Chang, (2016) “Economic Inequality, Winner-Loser gap, and Satisfaction with Democracy”,
Electoral Studies, 44: 85–97.
Page 18Global Satisfaction with Democracy Report 2020
Figure 13: Change in satisfaction with democracy since 1995 in the Anglo-Saxon democracies, from baseline level.
come inequality also decreases satisfaction discontent (Figure 13).
with democracy,15 and the effect may be This still leaves the question, of course, as
especially strong where entire regions of a to why discontent in majoritarian democ-
country feel left behind – and whose needs racies has been on the rise, rather than
have been ignored by political parties due simply higher on average. One intriguing
to the prevalence of either gerrymandered hypothesis is that there may be an interac-
or “safe” seats.16 This sense of exclusion and tion between the confrontational, two-party
frustration with political elites is only made model of Anglo-Saxon politics, and the ef-
stronger when the other effect of income fect of social media in siloing society into
inequality is to skew influence over the po- opposing “tribes”.18 Rising political polarisa-
litical system, providing increased resources tion between Democrats and Republicans in
for lobbyists and rendering politicians more the United States is one example, though a
dependent upon securing donor campaign clearer demonstration is the manner in which
contributions. Britain’s referendum on whether to remain
A second literature that is pertinent to ex- in or leave the European Union subsequently
plaining the trajectory of the Anglo-Saxon split society into the hitherto unknown cat-
democracies suggests that satisfaction with egories of “Leavers” vs. “Remainers”. Com-
democracy is lower in majoritarian “winner- bined with social media, the winner-takes-all
takes-all” systems than in consensus-based, nature of political competition in Anglo-
proportionally representative democracies,17 Saxon democracies contributes to polarisa-
and this could explain why New Zealand – tion, which in turn makes citizens less willing
the lone member of this group with elections to compromise or accept the legitimacy of a
by proportional representation – appears to rival’s electoral mandate.
have avoided a trajectory of soaring public
16
Lawrence Ezrow and Georgios Xezonakis (2011) “Citizen Satisfaction with Democracy and Parties’ Policy Offerings: A
Cross-National Analysis of Twelve European Party Systems, 1976–2003”, Comparative Political Studies.
17
Kees Aarts and Jacques Thomassen, (2008) “Satisfaction with Democracy: Do Institutions Matter?”, Electoral Studies, 27,
5–18.
18
Andrea Ceron and Vincenzo Memoli (2016) “Flames and Debates: Do Social Media Affect Satisfaction with Democracy?”
Social Indicators Research.
Page 19Global Satisfaction with Democracy Report 2020
Country in Focus
The United States
In few countries has the decline in satisfac- against Americans’ view of the ability of
tion with democratic performance been as their democracy to deliver. Now, for the
dramatic or as unexpected as in the United first time on record, polls show a majority
States. For much of its modern history, of Americans dissatisfied with their system
America has viewed itself as a “shining of government – a system of which they
city on a hill” – a model democracy, and were once famously proud.
one that can serve as an example unto oth- Such levels of democratic dissatisfaction
ers that wish to emulate its success. Sur- would not be unusual elsewhere. But for
vey data shows that the American public the United States, it marks an “end of excep-
largely cohered with such a viewpoint, with tionalism” – a profound shift in America’s
more than three-quarters of U.S. respon- view of itself, and therefore, of its place in
dents regularly expressing their “satisfac- the world. It is a reflection of just how re-
tion” with the state of democracy in Amer- markable this shift in sentiment has been
ica. that a presidential candidate – Donald J.
Following the 2008 financial crisis, how- Trump – could arrive at the White House af-
ever, that has begun to change, with Ameri- ter a presidential campaign that denounced
cans’ evaluation of the functioning of their American political institutions as corrupt,
political system continuing to deteriorate and promised to step back from promot-
year on year. Rising political polarisation, ing democracy abroad in favour of putting
government shutdowns, the widespread “America First”, treating all countries trans-
use of public office for private gain, a costly actionally based on a spirit of realism, re-
war in Iraq, and growing spatial and inter- gardless of their adherence to or deviation
generational inequality have all weighed from democratic norms.
Figure 14: Rising dissatisfaction with democracy in the United States from the mid-1990s to the present
day. Shown here are individual survey observations, plus their rolling average.
Page 20Global Satisfaction with Democracy Report 2020
Country in Focus
The United Kingdom
The United Kingdom has one of the richest market reforms with increased social in-
datasets on satisfaction with democracy, vestment in health and education, it had
starting with the first surveys completed seemed that “things” – to borrow New
in the early 1970s by Eurobarometer, and Labour’s own political mantra – “could only
supplemented by more recent surveys com- get better”. And indeed, had done so.
pleted by survey organisations including In retrospect, this period represented
Gallup, Pew, and YouGov. a high point for satisfaction in Britain’s
For thirty years from the 1970s to the early democratic institutions which would never
twenty-first century, average levels of satis- be reattained. Following brief dips after the
faction with democracy in the U.K. were, Iraq War and the parliamentary expenses
in fact, rising. The 1970s marked a mo- scandal, satisfaction with democracy has
ment of deep crisis for Britain, with general plunged during the “Brexit” stalemate of
strikes, power cuts, periods of minority gov- 2016-19. The sudden onset of Britain’s re-
ernment, an embarrassing IMF bailout, and cent legitimacy crisis holds out the hope
the start of “the troubles” in Northern Ire- that a recovery may follow as swiftly as the
land. By the end of the 1990s, when Tony breakdown. Yet this will depend upon how
Blair’s government had brokered the Good the United Kingdom finally negotiates its
Friday agreement in Northern Ireland, de- way out of the Brexit impasse, and moves
volved power to Scotland and Wales, and beyond the divisions sowed by the 2016 ref-
rebranded the country as a “cool Britannia” erendum.
that could reconcile Margaret Thatcher’s
Figure 15: Dissatisfaction with democracy in the United Kingdom from the mid-1970s to the present day.
Shown here are individual survey observations, plus their rolling average. For much of this
period, a majority of respondents have expressed contentment with the outcome of the British
political process. However, in 2019, for the first time since the mid-1970s, more than half of
British respondents were dissatisfied with democracy in the UK.
Page 21Global Satisfaction with Democracy Report 2020
Europe – Complacency and Internal Divergence
Figure 16: Satisfaction with democracy in European Union member states, 1975-2020. Addition of countries to the
EEC/EC/EU shown by country flags.
Overall, satisfaction with democracy in Eu- place, and support for the communist Left
rope has fluctuated in cycles over the past grew.19 Meanwhile, though democratic ide-
half century. We are now at a third peak in als emerged unassailable from the end of the
relative dissatisfaction, with the first dur- Cold War, democratic institutions seemed
ing the “governability crises” of the 1970s, less robust: in 1992 the Italian party system
the second following the 1990s recession imploded following corruption scandals, and
and the final phase beginning in 2009 with the collapse of the communist parties was
the eurozone crisis. Interspersed with these followed by the growth of the extreme right
episodes, there have been periods of relative in countries such as France, Austria, and the
civic contentment – for a few years following Netherlands.
the collapse of the Berlin Wall, and for the So why then, does Europe’s current malaise
first decade following the launch of the euro. “feel” worse than past episodes? The first dif-
Previous episodes were experienced as ference, perhaps, is one of duration: The pe-
genuine crises at the time, capable of disrupt- riod from 1992 to 1994 may have contained
ing democratic stability within individual the ERM crisis, the collapse of the Italian
European countries. The Trilateral Commis- party system, and the 1990s recession, yet
sion report of 1975 warned of a threat to was a blip between two periods of relative
democratic institutions in Italy, the United optimism and euphoria (Figure 17).
Kingdom, West Germany, and France, as Secondly, there is the fact of divergence:
strikes, riots, and terrorism became common- Europe’s average level of satisfaction masks
19
Michel Crozier, Samuel Huntington and Joji Watanuki (1975) “The Crisis of Democracy: Report on the Governability of
Democracies to the Trilateral Commission”.
Page 22Global Satisfaction with Democracy Report 2020
a large and growing divide within the con- ment. In the United Kingdom, deep austerity
tinent, between a “zone of despair” across policies were initially supported by the elec-
France and southern Europe, and a “zone torate, while in France, François Hollande
of complacency” across western Germany, campaigned on a platform of increased taxes
Scandinavia, and the Netherlands. Because and reduced public spending. By the end of
the former group began from a lower base- the decade, however, electorates had lost pa-
line, the result is a wide and growing “sat- tience. A left-populist government in Greece
isfaction gap” – much in evidence from the won (then ignored) a referendum rejecting
2019 elections to the European Parliament, the terms of the country’s bailout agreement,
where anti-system parties swept seats across the Cameron government collapsed after los-
France, Italy, Spain, and Greece, yet were less ing a referendum to remain in the European
successful in northern Europe. Union, and Italy’s technocrats were swept
The length of the current malaise also ex- from office by a populist coalition of left
plains why this time it has led to a wave of and right. Whether and when Europe can
populism, a wave that began some five years escape its longest period of institutional dis-
after the onset of the eurozone sovereign debt satisfaction on record, will depend in large
crisis. At first, European publics were pre- part upon the capacity of governments to
pared to give established parties a chance to escape its underlying pressures – economic
address the continent’s mounting economic stagnation,20 regional inequality within and
and migration challenges. For a number between countries,21 demographic anxieties,
of years in Greece, successive governments and imbalances of power between nation
followed the strictures of the IMF bailout states in the post-Lisbon Treaty European
package, while in Italy, Silvio Berlusconi re- Union.22
signed to make way for a technocratic govern-
Figure 17: Dissatisfaction with democracy in Western Europe, divided into three phases: 1974–1992; 1992–2008;
2008–today. Population-weighted, constant country sample barring additions of: (i) Greece (data series
begins in 1980), (ii) Spain and Portugal (data series begin in 1985), (iii) Eastern Germany (from 1990,
included in the Federal Republic of Germany). Europe has experienced legitimacy crises in the past; yet
in episodes of 4-6 years, rather than a decade-long malaise.
20
Klaus Armingeon and Kai Guthmann (2013) “Democracy in crisis? The declining support for national democracy in
European countries, 2007–2011”, European Journal of Political Research.
21
Lewis Dijkstra, Hugo Poelman and Andrés Rodríguez-Pose (2019), “The geography of EU discontent”, Regional Studies;
Roberto Stefan Foa and Jonathan Wilmot (2019) “The West Has a Resentment Epidemic”, Foreign Policy.
22
Sonia Alonso and Rubén Ruiz-Rufino, (2018) “The costs of responsibility for the political establishment of the Eurozone
(1999–2015)”, Party Politics.
Page 23You can also read