Global Foresight Q1 2021 - The Canary in the Bitcoin Mine - Rockefeller Capital Management
←
→
Page content transcription
If your browser does not render page correctly, please read the page content below

Global Foresight
Q1 2021

The Canary in the Bitcoin Mine
From Copper to Corn to Crypto, What Do Soaring Asset Prices Portend?

By David P.Harris,CFA

                                                                G lob al Fore s igh t Q 1 2 021   1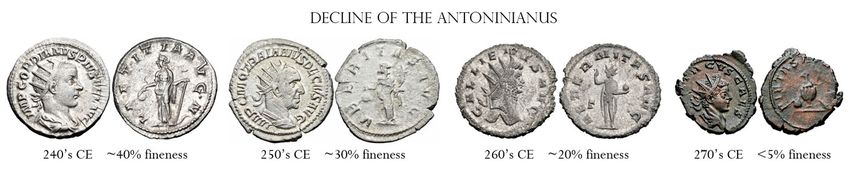
Introduction
    Let’s face it, assessing risk is not as simple as    combining the two businesses, a                       public
    canaries made it look. Starting in the late          shareholder cannot unlock that value.
    1890’s, canaries saved countless lives in coal
    mines by dependably signaling dangerous              For financial assets, a divergence between
    levels of carbon monoxide, allowing miners to        price and value is less typical. Most investors
    evacuate to safety. Virtually every profession,      hold assets for financial gain. When price and
    from medicine to weather forecasting, has            fundamental value diverge, it suggests
    sought its proverbial “Canary” that provides         investors are placing a high intangible value on
    reliable warnings without generating false           owning certain assets. Over the long-term,
    alarms. The asset management industry utilizes       equity prices should reflect the discounted
    an increasingly broad and sophisticated set of       present value of a company’s expected future
    indicators to assess risk and valuation. Exiting     cash flows – price should equal value. In the
    2020, when markets defied most traditional           short run, fear and greed can lead to equity
    metrics, do we need a new paradigm to                prices that can become disconnected from
    determine fair value or are most asset classes       value.    During periods of rapid economic
    priced ahead of their fundamentals? If the           growth or technological innovation, investors
    latter, does this suggest a sharp correction on      often become too euphoric, while in periods of
    the horizon or will underlying economic growth       economic contraction, panic typically prevails.
    over time enable earnings to catch up to
    markets?      In this edition of Global Foresight,   What is unique about 2020 is how broad-based
    we examine the current disconnect between            the rally in asset prices has been. Consider the
    price and value and what we are gleaning from        biggest market excesses of the last 50 years: 1)
    the canaries.                                        technology stocks from 1999-2000, 2)
                                                         Japanese equities and real estate in the late
    The 175 Million Dollar Pizza                         1980s, and 3) the “Nifty-fifty” growth stocks on
    Lazlo Hanyecz, a software developer, was             the early 1970s. Each of these was a period of
    credited in 2010 with the first transaction using    unbridled optimism about growth prospects
    Bitcoin (BTC). He used 10,000 BTC to purchase        for a specific sector, one economy, or a small
    two pizzas, which at today’s price of roughly        slice of the market. For instance, in 2000,
    $35,000 per BTC, translates to $175 million per      technology and telecom stocks in the U.S.
    pie. (Details are lacking if that included           market were highly valued as investors became
    toppings). The BTC story demonstrates that           overly optimistic about “New economy” stocks
    price and value, while often thought to be           and neglected “Old economy” stocks like
    synonymous,      can     diverge     in   certain    industrial companies.       In the late 1980s,
    circumstances. Price is about cost, while value      Japanese assets were very expensive, but this
    measures buyer utility. For tangible goods           was not a commonly found characteristic
    there can be a big difference between the two -      around the rest of the world. During the Nifty-
    - consider how an eighty-year-old might value        fifty era, valuation excesses were mostly limited
    the new COVID-19 vaccines compared to how            to this group of U.S. blue-chip companies and
    a twenty-year-old would. Although they are the       not the several thousand other publicly traded
    same product, there is a significant difference      companies. By contrast, in 2020, we saw much
    in the usefulness to each person.                    more broad-based bullishness – soaring
                                                         commodity, bond and equity prices across
    Corporate acquisitions are another excellent         sectors and regions.
    example where the value of an asset can
    diverge from its market price. Company ABC           Paradigm Shift?
    may be able to defend paying a 50% premium           Has there been a logical paradigm shift
    over public market prices to acquire company         explaining why so many types of assets have
    XYZ, because it can capture synergies from           generated such investor excitement of late? Or

2   Global Foresight Q1 2021                                                     R oc k e f e lle r Asset M an ag e men t
is the explanation as simple as unprecedented Copper & Other “Co” Commodities
monetary easing boosting asset prices? If so, Copper makes gold look like the new metal on
will that feed through to inflation and ultimately the block, as its use has been traced back to at
interest rates potentially ending the virtuous least 8000 B.C. Copper, with its many industrial
cycle of ever-higher P/E ratios? Let’s look at uses, has earned the moniker “Dr. Copper”
various asset classes and indicators to identify because its price was thought be as reliable a
common traits and what they suggest for forecaster of global economic activity, akin to a
markets going forward. Ph.D. in Economics. Like BTC and gold, copper
plunged in March but subsequently rebounded
Bitcoin vs Bitcoin Index to levels last seen in 2012. Copper gained 25%
Perhaps no better asset class epitomized in 2020, which at first blush seems excessive
investor exuberance than cryptocurrencies. considering the outlook for 2021 economic
BTC was priced at $7,158 at the close of 2019, activity is for the world to recover to levels that
plunged to $4,904 during March 2020 and were expected for 2020 (pre-pandemic), when
closed the year out at $28,996. Just a few copper was much lower. Or perhaps copper,
short days into 2021, BTC had already raced like BTC and gold, is merely signaling future
above $40,000. Let’s assume for argument’s inflation.
sake the changes in BTC prices have been
defensible, after all it is a difficult asset class to As a random exercise, let’s look at commodities
value and even many long-time skeptics beginning with “co” to confirm if copper was an
became believers in 2020. What is impossible outlier. Corn also gained 25% in 2020 and is
to justify is the premia many crypto funds are now at its highest levels since 2013. Coal
trading at relative to the net asset value of their gained 20% in 2020 and cotton gained 10%.
underlying holdings. If we consider price For good measure, cobalt, which is used for
versus value, investors have been paying too electric vehicle batteries, was flat in 2020, but
high a price for an asset that can be objectively up 20% in the first two weeks of 2021. This is
measured – i.e., the underlying holdings in the quite the commodity basket signaling inflation
fund. Traditionally, excessive premia (or as it includes: inputs for food, clothing, old
discounts) for funds have been an indicator of energy and new energy.
overvaluation or undervaluation. The current
price activity in various crypto funds suggests a Home Prices
lot of euphoria in this asset class without even Data on home prices have a lag of a few
needing to make the case that the underlying months as transactions are not as instant as
crypto currencies are overpriced. bonds and commodities. But the major home
price indices through October 2020, such as
Gold Case-Shiller and FHFA, suggest nationwide
Gold had a six-thousand-year head start on home prices will be up at least 10% in 2020.
BTC, so it’s understandable if it’s not Lumber prices doubled last year, reaching a
considered as hip as crypto. Nonetheless, gold record high. Water and sewage services for
like BTC, rallied in 2020, but to a much smaller your home, went up an average cost of 3.3%
magnitude. One can read this as gold is according to the Bureau of Labor Statistics.
perhaps undervalued versus BTC. A safer The cost of filling your refrigerator and pantry
conclusion is that both are indicating a lack of went up 3.9% in 2020, as food prices had their
faith in the U.S. dollar and potential for inflation largest gain in years.
to finally accelerate, something that has been
anticipated since the U.S. Federal Reserve
massively expanded its balance sheet during
the global financial crisis but has failed to
materialize since then.
3 Global Foresight Q1 2021 R oc k e f e lle r Asset M an ag e men tFixed Income Spreads barometer of investor sentiment. Put volume
For market strategists and many equity soared in March but is about as low as it has
investors, fixed income spreads have been the been since before the Global Financial Crisis.
equivalent of a barometer for weather Unlike the VIX, put/call ratios suggest a fair
forecasting – a vital tool to track economic amount of investor complacency.
direction, well before published data reveal
changes in growth. With the major Valuation
modifications in U.S. Federal Reserve policies With seemingly every market cycle, new
announced in March, spreads will have limited valuation metrics appear to justify price levels,
utility for now. With the Fed buying corporate and many are useful tools to fully appreciate
debt, including high-yield, the premia these businesses’ long-term growth prospects. No
trade over treasuries is not useful to assess the matter your preferred valuation metric, we are
growth outlook as credit spreads are distorted. either in a new paradigm where price to
However, spreads between treasuries and earnings (P/E) multiples should trade higher
inflation-protected treasuries (TIPs) still serve as than they have historically, or many sectors of
a useful market-derived forecast and are the equity markets have disconnected prices
signaling inflation greater than the Fed’s target from their underlying values. The argument for
of 2.0%, rising sharply since the lows in March. higher multiples has been that they are justified
by very low interest rates. If you share this
Volatility view, then inflation becomes critically
The Volatility Index (VIX) became a household important to monitor as its impact on rates
word during the Global Financial Crisis in 2008 could derail the case for permanently high P/E
when it shattered previous records. The long- multiples.
term volatility of U.S. equities has averaged
roughly 15%, so large deviations from that level Antoninianus
by the VIX have been used as an indicator of Concerns about the Fed’s role in monetizing
fear and greed. However, the VIX had always our country’s massive deficits should be placed
been thought to be a more reliable indicator of in historical context as cheapening currency is
fear and therefore a useful indicator for when about as old as documented history. The
markets have been overly punished by pictures below show the devolution of the
investors rushing for the exits. The VIX ancient Roman currency, the Antoninianus.
historically has been a less reliable indicator for There probably is no better endorsement for
when to sell – low levels of the VIX suggest BTC or gold than how this coin went from
investor complacency, but not necessarily being nearly entirely made of silver to having
market frothiness. The VIX worked as expected less than 5% silver content. Central banks such
in 2020, with levels peaking in mid-March, days as the European Central Bank, the Bank of
off the market lows. It has been trading England and the Bank of Japan have had
recently around 24, twice where it was entering accommodative policies in place for most of
2020 and well above historic norms. This is an this century, while the U.S. Federal Reserve
indicator worth monitoring, but there is no massively increased its level of accommodation
clear signal of investor sentiment to be gleaned back in March. Yet despite so much central
from it. bank easing, we have not seen any consistent
pickup in published overall inflation statistics.
Put/Call Ratios
Like the VIX, the ratio of the amount of put
option volume to call option volume is a useful
Source: Rasiel at English Wikipedia, CC BY-SA 3.0 , via Wikimedia Commons
4 Global Foresight Q1 2021 R oc k e f e lle r Asset M an ag e men tCanary in Coal Mine Searches
100
75
50
25
0
1/2012 1/2013 1/2014 1/2015 1/2016 1/2017 1/2018 1/2019 1/2020 1/2021
Source: Google Trends, Unites States. Data are indexed to 100, where 100 is the maximum search interest for the time and location selected.
Conclusion
The chart above shows the frequency with Higher inflation should lead to higher rates and
which “canary coal mine” was searched on lower P/E multiples. The path from here is
Google Trends going back the last ten years. uncertain as to when inflation will appear in the
Amazingly, the peak coincided within days of widely-followed personal consumption
the market lows in March. How ironic that the expenditure index (PCE) and consumer price
“Canary in the Coal Mine” for equity markets index (CPI), as there are lags before input
was literally the term “canary in a coal mine”. prices work their way through the system. If
Bitcoin and gold are the proverbial canaries for
Doing the same search on Google Trends for inflation, then we should be taking note.
“inflation” shows no such trend. Inflation is
clearly not top of mind yet for investors,
despite signs of it appearing across the
commodity complex. This is the number one
threat we see today, potentially taking
euphoria out of equities and fixed income.
5 Global Foresight Q1 2021 R oc k e f e lle r Asset M an ag e men trockco.com Rockefeller Asset Management is a division of Rockefeller Capital Management. Certain information contained in this document may constitute “forward-looking statements.” No representations or warranties are made as to the accuracy or completeness of such statements, and actual events or results may differ materially from those reflected or contemplated. This document is provided for informational purposes only and is not intended, and should not be construed, as investment, tax or legal advice. This document does not purport to be a complete statement of approaches, which may vary due to individual factors and circumstances. Company references are provided for illustrative purposes only and should not be construed as investment advice or a recommendation to purchase, sell or hold any security. Although the information provided is carefully reviewed, Rockefeller Capital Management cannot be held responsible for any direct or incidental loss resulting from applying any of the information provided. Past performance is no guarantee of future results and no investment or financial planning strategy can guarantee profit or protection against losses. These materials may not be reproduced or distributed without Rockefeller Capital Management’s prior written consent. Rockefeller Capital Management is the marketing name for Rockefeller Capital Management L.P. and its affiliates. Investment advisory, asset management and fiduciary activities are performed by the following affiliates of Rockefeller Capital Management: Rockefeller & Co. LLC, Rockefeller Trust Company, N.A. and The Rockefeller Trust Company (Delaware), as the case may be. Rockefeller Financial LLC is a broker- dealer and investment adviser dually registered with the U.S. Securities and Exchange Commission (SEC). Member Financial Industry Regulatory Authority (http://www.finra.org/); Securities Investor Protection Corporation (https://www.sipc.org/). Copyright 2021 © Rockefeller Capital Management. All Rights Reserved. Products and services may be provided by various affiliates of Rockefeller Capital Management.
You can also read