Global Intelligence - 08 Q4 2018 - Data & insights for the new age of communication - Zenith Media
←
→
Page content transcription
If your browser does not render page correctly, please read the page content below

Global
Intelligence
Data & insights for the new age of communication

08
Q4 2018

Global Intelligence
Global Intelligence is an essential briefing for marketers,
brought to you by the world’s leading advertising
expenditure forecasters. Published quarterly, Global
Intelligence is a critical mix of data, insight and commentary,
fuelled by Publicis Media’s proprietary tools and authored
by our communications experts. Led with an overview of
the latest quarterly Advertising Expenditure Forecasts, each
issue provides intelligence on key areas of contemporary
communication, including digital and mobile, technology
and automation, innovation, performance marketing, and
branded content.

2
Contents
04     Leader

Adspend Forecasts

06     Hot Spots

08     Q4 2018 summary

10     Q4 2018 summary by medium

12     Market Focus - Singapore

Marketing Tech
14     Rethinking targeting

16     Digital Giants

18     E-commerce advertising

20     Commerce

Category Insights
22     Automotive

24     Automotive social

Digital Channels
26     Shoppable content

28     Search

30     CES

                                   3
Global Intelligence | Leader

    E-commerce opens new
    opportunities for brand
    communication
    Welcome to the eighth edition of Global Intelligence,    Our chosen category for this issue is automotive.
    Zenith’s quarterly magazine about the global             In this category the most important medium for
    transformation of media and communications               paid advertising is still television – which has been
    worldwide.                                               a common theme in our coverage of different
                                                             categories – but most consideration of auto brands
    In this edition we look at the problems with targeting   now takes place online, where search, social and video
    consumers by age. The days when the young were           ads are becoming ever more effective. The biggest
    hard to reach, had high disposable income and            social platform for auto brands is still Facebook, at
    were amenable to brand messages because they             least in terms of number of fans, but it is getting even
    were most likely to change their mind, are over. We      tougher to reach fans organically and provoke a
    advocate targeting consumers of any age, based           response. Promoted posts are a key tool for engaging
    on mind-set, when they are most open to changes          consumers of Facebook. Auto brands are now shifting
    in brand behaviour. One such time is at the point of     their attention to Instagram, an aspirational platform for
    purchase, and brands are taking the opportunity to       driving awareness well before consumers make their
    communicate with consumers when they are buying          purchase.
    online, by advertising on e-commerce sites. This
    form of advertising has grown rapidly in China to        We end with a look at this year’s CES at Las Vegas, and
    occupy nearly a fifth of the entire ad market, and is    what practical implications the exhibits have for what
    now poised to take off internationally. Before jumping   brands should be doing right now.
    into e-commerce advertising, though, brands need
    to understand how best to work with retailer sites to    I hope you enjoy reading this edition. Please get in
    maximise value.                                          touch at Jonathan.Barnard@zenithmedia.com if you
                                                             have any comments or suggestions.
    Carrying on the e-commerce theme, we look into
    shoppable content, which allows marketers to turn
    their branded content assets into direct drivers of
    sales. It also provides a clear measure of the return
    on investment in content, which until now has been
    lacking.

4
Global Intelligence | Leader

                           5
Adspend Forecasts | Hot Spots

 The world’s
 advertising hot spots
 Average annual growth in adspend by regional bloc 2018-2021
-2%                                            4%                                                         10%

                                                               3.4%
                                                               North America

                                                               Canada, USA

                                                                             4.1%
                                                                             Latin America

                                                                             Argentina, Brazil, Chile, Colombia,
                                                                             Costa Rica, Ecuador, El Salvador,
                                                                             Mexico, Panama, Peru, Puerto
                                                                             Rico, Uruguay, Venezuela

 6
Adspend Forecasts | Hot Spots

3.0%
Western & Central Europe

Austria, Belgium, Bosnia & Herzegovina,
Croatia, Czech Republic, Denmark,
                                                        7.4%
                                                        Eastern Europe
Finland, France, Germany, Greece,                       & Central Asia
Hungary, Ireland, Italy, Netherlands,
Norway, Poland, Portugal, Romania,                      Armenia, Azerbaijan, Belarus, Bulgaria,
Serbia, Slovakia, Slovenia, Spain,                      Estonia, Georgia, Kazakhstan, Latvia,
Sweden, Switzerland, UK                                 Lithuania, Moldova, Russia, Turkey,
                                                        Ukraine, Uzbekistan

                                                                                                  2.1%
                                                                                                  Japan

                                          6.2%
                                          Fast-track Asia

                                          China, India, Indonesia,
                                          Malaysia, Pakistan, Philippines,
                                          Taiwan, Thailand, Vietnam

      -1.2%
      Middle East
      & North Africa
                                                                                     3.6%
                                                                                     Advanced Asia
      Bahrain, Egypt, Israel, Kuwait,
      Oman, Qatar, Saudi Arabia, UAE                                                 Australia, Hong Kong,
                                                                                     New Zealand, Singapore, South Korea

                                                                                                                                7
Adspend Forecasts | Q4 2018 summary

Rising markets support steady
global adspend growth
Global adspend continues to grow, as fast-growing markets in Central & Eastern Europe, Asia Pacific
and Latin America play an ever more important role on the global stage.

We estimate that global advertising expenditure grew 4.5%         Young advertising markets like India are playing an ever-
in 2018, boosted by the Winter Olympics, FIFA World Cup           more-important role in driving global growth in adspend.
and US mid-term elections. We forecast growth to remain           ‘Mature’ markets – by which we mean North America,
steady and positive for the next three years, at 4.0% in 2019,    Western Europe and Japan – account for 62% of global
4.2% in 2020 and 4.1% in 2021.                                    adspend this year, down from 75% ten years ago. ‘Rising’
                                                                  markets – by which we mean all markets apart from the
Central & Eastern Europe will be the fastest-growing region,      ‘Mature’ ones – will contribute 54% of the growth in global
with average growth of 6.3% a year between 2018 and 2021,         adspend between 2018 and 2021, increasing their share of
driven by continued strength in Russia, which is growing at       global expenditure from 38% to 40%.
6.8% a year and accounts for 39% of the regional total. Asia
Pacific is next, growing at an average of 4.9% a year, or 5.7%
a year excluding Japan.                                           Growth of advertising expenditure and GDP
                                                                  2019-2021 (%)
We forecast just 1.7% growth in Latin American adspend
in 2019 as the Argentine peso continues to lose value, but        2019
predict an average growth rate of 4.1% a year to 2021. North                                                              + 5.7
America and Western Europe are both growing at about 3%
a year.                                                                                                   + 4.0

The Middle East and North Africa is the clear
underperformer, with an average annual decline of 1.2%            2020
forecast to 2021. However, MENA is starting to recover from                                                             + 5.5
the deep advertising recession caused by the drop in oil
prices, political turmoil and conflict. We forecast a 4.9% drop                                             + 4.2
in adspend in MENA in 2019, down from 11.6% in 2019, before
the market stabilises at 0.4% growth in 2020 and then grows
by 1.0% in 2021, which would be MENA’s first substantial          2021
growth since 2014.                                                                                                     + 5.4

India is a stand-out growth market. We forecast it to grow at                                              + 4.1
13.5% a year on average, from US$9.7bn in 2018 to US$14.2bn
in 2021, when it will become the world’s eighth largest
advertising market, entering the top ten for the first time.          GDP
India has huge potential for further growth, with advertising         Adspend
taking up just 0.3% of GDP, less than half the Asia Pacific
average of 0.7%

8
Adspend Forecasts | Q4 2018 summary

The ten fastest
growing markets

The ten biggest ad markets                      Growth in ad dollars

Ad expenditure (US$m)                           (US$m 2018-2021)

2018                                   2021

    USA
    203,847             1    ‹        USA
                                     225,128
                                                                             21,281
                        2
                                                                             USA
    China                    ‹      China
    86,574                           101,035

    Japan
    42,512              3    ‹     Japan
                                      45,187
                                                14,461
                                                                 China

    UK
    25,642              4    ‹
                                          UK
                                      28,595

    Germany
    23,189              5    ‹
                                   Germany
                                     24,547
                                                                             4,506
                                                                                   India
    Brazil
    15,711              6    ‹
                                       Brazil
                                      18,273
                                                           2,953
    South Korea
    12,550              7    ‹
                                 South Korea
                                      14,295
                                                                        UK          1,376
                                                                                    France

    France
                        8              India
                                                    2,927                                    1,732
                             ‹

    12,398                            14,234
                                                    Indonesia                                  Russia

    Australia
                        9             France
                             ‹

    12,342                             13,774                                                 1,745
                                                          2,675                            South Korea
    Indonesia
                        10          Australia
                                                                             2,562
                             ‹

    9,757                             13,505                    Japan
                                                                               Brazil
Source: Zenith/IMF

                                                                                                      9
Adspend Forecasts | Q4 2018 summary by medium

Personal and targeted
communication is driving
ad growth
Online video and paid search are driving the growth in global adspend, as advertisers focus on
personalised and targeted communications.

Advertisers are increasing both the efficiency and               are becoming more important to advertisers’ brand-building
effectiveness of campaigns by using online video and             campaigns. Their combined share of adspend in ‘display’
paid search to target with pinpoint accuracy and serve           media (i.e. all media except paid search and classified
personalised messages. We forecast that between 2018 and         advertising) has risen from 46.2% in 2012 to 48.4% this year.
2021, online video advertising will grow at an average of        By 2021 we expect television and video to have a combined
18% a year, twice as fast as other forms of internet display     48.8% share of global ‘display’ – a higher share than
advertising and well ahead of any other channel.                 television ever achieved on its own. Television and online
                                                                 video are working harder for advertisers than ever before.
Paid search is not growing as quickly in percentage terms –
it will grow at an average of 7% a year over this period – but   Print titles continue to lose market share as their readers
in dollar terms it will contribute even more to global growth    continue to move to online versions of the print brands or
than online video. The application of AI techniques, better      other forms of information and entertainment entirely. We
location targeting, integration with commerce and the rise of    predict newspapers and magazines will shrink at average
‘in the moment’ search are all making search more effective      rates of 4% and 6% a year respectively to 2021. Newspapers
for advertisers. We forecast that between 2018 and 2021,         will account for 6.5% of total adspend in 2021, down from
online video advertising will grow by US$20bn, while paid        8.4% in 2018, while magazines will account for 3.3%, down
search will grow by US$22bn. Between them these two              from 4.5%. Note that our figures for newspapers and
channels will account for 60% of the extra ad dollars added      magazines include only advertising in printed editions
to the market over this time.                                    of these publications, not on their websites, or in tablet
                                                                 editions or mobile apps, all of which are picked up in our
Advertisers commonly use online video together with              internet category. The performance of print editions does
traditional television, combining television’s broad reach and   not describe the overall performance of newspaper and
immersive experience with online video’s ability to target       magazine publishers
and optimise frequency. Taken together, these two media

10
Adspend Forecasts | Q4 2018 summary by medium
Average annual growth rate by medium 2018-2021 (%)
Cinema 15.1
Internet display 12.0
Paid search 7.0
Internet classified 6.2
Outdoor 2.2
Television 0.9
Radio 0.6
-4.5 Newspapers
-6.5 Magazines
Share of global adspend by medium (%)
Cinema Cinema
0.7 Magazines 1.0
Magazines
Radio Radio
4.5 3.3
5.5 Television
6.0 Television Out-of-home
29.9
Out-of-home 32.9 6.4
6.7
Newspapers
6.5
Newspapers
8.4 Internet classified
3.9
Internet classified
3.7
Paid search
18.5
Paid search
16.9
Internet display Internet display
20.0 25.0
2018 2021
11Adspend Forecasts | Market Focus – Singapore
Adspend in Singapore
After several years of decline, Singapore’s ad market is forecast to pick up speed over the next
few years. The economy grew better than expected in 2017 due mostly to a strong showing in
electronics. In this tech-smart market, it is digital spend that will drive the market forward.
Tracked advertising expenditure across print, TV, radio and Analogue TV transmissions ceased in December 2018. While
selected out-of-home sites reached S$1.77 billion in 2017, a most households have transitioned to digital TV, and the
17% decline year-on-year. A good performance by digital government has plans to help the rest make the transition,
(estimated to have grown by 20%) helped to soften the there may be some disruption to TV viewing in early 2019.
impact. Total adspend declined by 11.6% to S$2.217 billion in Another issue is the decision by StarHub – Singapore’s
2017. 2018 full year ad spend is projected at S$2.072 billion, a largest pay-TV provider – to close down its cable service in
6.5% decrease overall. July 2019.
Growth in digital dropped in 2018 as advertisers focused With readership declining in print, advertising spend in
more on building internal digital and data infrastructure. newspapers and magazines will mirror this change in
Traditional internet advertising expenditure was also being consumer habits. Singapore’s largest print media owner -
diverted to content production and influencer engagement, Singapore Press Holdings - announced another round of
which are not picked up in the expenditure figures. Privacy retrenchment in late 2017 as operating revenue for its core
concerns and concerns over advertising on inappropriate media business fell 13% during the year. Revenue from
content have led to reduced investments on Facebook and advertisements declined by 16.9%, while turnover from
Google by key global advertisers. circulation dipped 5.1%. Meanwhile, Today newspaper has
ceased its print edition to go fully digital, and The New Paper
Competition is intensifying in the digital video sector, as has become a five-day publication.
content providers like Netflix enter the market to challenge
free-to-air provider Mediacorp and pay-TV providers Starhub Two new radio licences have been issued to Singapore
and Singtel. The dilution of audience, especially younger Press Holdings. Money FM 89.3 launched in January 2018,
tech-savvy viewers, is likely to lead to further pressure on promising to be the first and only business and personal
TV’s share of budgets. finance radio station.
12Adspend Forecasts | Market Focus – Singapore
Adspend in Singapore
Year-on-year change at current prices (%)
4.2 4.1
2016 v 2015 2017 v 2016 2018 v 2017 0.1
2019 v 2018 2020 v 2019 2021 v 2020
-5.9
-6.5
-11.6
Share of adspend by medium (%)
Out-of-home/ Cinema Out-of-home/
Cinema
transport transport
0.8 0.8 TV
9.9 TV 10.4
28.8
Radio 31.3 Radio
9.6 9.1
Total Total
US$1,500m US$1,628m
Internet
22.7 Internet
29.4
Newspapers
19.3
Newspapers
Magazines Magazines
23.0
2.7 2.2
2018 2021
13Marketing Tech | Innovation
We need to rethink targeting
Life stages
Marketing imperatives
Once we get into a habit, it is hard to break. So the secret
• Modern marketing should appeal to forward- of brand growth is to win at the point of change. One of
thinking individuals of all ages the biggest drivers of changes in behaviour is change in
• The young are no longer difficult to reach, and life-stage – moving from education to work, for example,
age is a poor proxy for sales potential or getting married. In the 20th century, the twenties
• Brand growth is about identifying the audience were the defining decade of adulthood. Targeting
for that growth, appealing to their mind-set twentysomethings made sense, because this was when
and winning at their point of change people went through the most life-stages.
• Appealing to disrupters is about targeting
rebellious attitudes and mind-sets The 21st century has seen huge societal, cultural and
technological shifts, forcing society to evolve from three
life-stages (study-work-retirement) to multi-stage life
and an unpredictable future. Longer lifespans challenge
Recently, marketing guru Gina Pell coined the term conventional life-stages – they make life a marathon,
Perennials: people who are ever-blooming, live in the requiring careful pacing. So twentysomethings no longer
present time, know what’s happening in the world, stay have the monopoly on life-stage changes. People at
current with technology, and have friends of all ages. She every age face events that drive changes in brand
argues that the days of targeting media and products behaviour. As we conduct more of our lives online, these
at people based on their age is over. Perennials are not change moments become easier to identify, predict and
defined by their age, and marketers should take the target.
same approach, eschewing age in favour of mind-set,
behavioural change and disposable income.
Disposable income
Targeting Disposable income was what originally made young
baby-boomers so attractive to advertisers – with
Advertisers used to focus on young people because they steady jobs, little reason to save and no dependents or
were hard to reach. They spent more time socialising responsibilities, they were a marketer’s dream. Today,
outside the home, while older people stayed in with teenagers are less likely to have paid employment,
traditional media. Now, thanks to social media and and more likely to study or take an unpaid internship.
smartphones, the young are much more likely to socialise The housing market also works against the young on
remotely and consume media wherever they are, three levels: higher rents, smaller sizes of affordable
providing an abundance of youth media opportunities. accommodation and lengthening commutes to
affordable areas.
When you buy traditional broadcast media, you pay to
reach a specific target audience, but you reach all the Meanwhile, older consumers have much higher incomes
others exposed to the media as well. Ads targeted at and may have bought their home when house prices
young viewers therefore commonly reach large numbers were a fraction of what they are today. Disposable
of older viewers. But when you buy new addressable incomes are rising much faster among boomers than
digital media, such as programmatic display and social, millennials. This does not mean that we should be
you reach only the audience you target and no one targeting baby boomers exclusively. In the world of
else. If you’re only targeting the young this is a problem, addressable advertising we should be age-blind and
because age is a poor proxy for sales conversion. This is target people with the income, brand inclination, time
why we need to target people whose behaviour is open and space to enjoy the experience, irrespective of age,
to change instead. gender or any other outdated targeting label.
14Marketing Tech | Innovation
Attitude
Advertisers have historically targeted young people because
they were the disrupters – the people who changed how
we view brands and culture. But today, younger generations
are becoming more conformist. Teenagers start drinking
later and get drunk less often. Teenagers’ use of tobacco,
cannabis, inhalants and sedatives is also falling. Maybe as a
result, they are also having less sex. Today, the young are
conformists trying to beat the system rather than disrupters
trying to break it.
It is widely believed that the most successful entrepreneurs
are young, but research by The Harvard Business Review
shows that the average age of the founders of the fastest-
growing start-ups is 45. Separate research has found that
the average top pop-star is 38, and the average blockbuster
movie star is 45.
So the marketing industry needs to get over its obsession
with youth. Young consumers are easy to reach, thanks to an
abundance of youth media. Their appetite for new brands
may be bigger, but the older consumer may have more
lifetime value, so we should focus on winning at the point
of change, not generation. The young have diminishing
discretionary income so we need to focus on older
consumers for growth. Finally, the young are not the source
of disruption – we all are!
15Marketing Tech | Digital Giants
Digital Giants Q4 2018
Our round-up of the latest results from the digital
media giants that are transforming global media
and communication
+33% 92% +62% -28%
ad revenues of ad revenues from paid clicks cost per click
year on year mobile devices year on year year on year
53.9% US$410bn 73.8% US$752bn
Global reach Market Global reach Market
(all internet users) cap (all internet users) cap
Facebook now has 1.5 billion daily users, almost Mobile search and YouTube, along with strong
all of whom access it using mobile devices for growth in programmatic sales, continue to
some or all the time. It has 2.3 billion monthly fuel most of the growth in Google’s revenues
users around the world. These figures increased (as reported by Google’s holding company,
by 9% and 10% respectively year on year in Alphabet). Unlike Facebook, Google’s revenue
Q3 2018 as Facebook continued to recruit new growth is driven by volumes rather than prices,
users across the world, particularly in Asia-Pacific. with consistently large increases in clicks offset
For the second quarter in a row, Facebook by lower prices.
experienced a quarter-on-quarter drop in daily
active users in Europe – from 279 million to 278 Google continues to refine its ad offering;
million; the figure for the US & Canada was once since December 2018, in a departure from
again static (185 million). The company itself the traditional model, display advertisers
admits it seems to be hitting saturation point in can in some circumstances elect to pay for
developed markets. conversions rather than per click. It has also
made new call-to-action extensions available for
During the third quarter and first nine months of video ads.
2018, the average price per ad increased by 7%
and 19% respectively.
16Marketing Tech | Digital Giants
+29% +9% +43% +5%
ad revenues daily active users ad revenues daily active users
year on year year on year year on year year on year
7.7% US$24bn 4.4% US$8.3bn
Global reach Market Global reach Market
(all internet users) cap (all internet users) cap
Twitter now has 326 million monthly users, Snapchat is owned by Snap Inc. and currently
representing a slight drop quarter on quarter boasts a user base of over 186 million
coming from the US market, and a larger drop worldwide, up 8 million year on year. Average
in international MAU (down to 259 million from revenue per user rose by 37% to US$1.60 in Q3
267 million). The number of daily active users (up from US$1.17 in Q3 2017).
increased by 9% year on year, so existing users
are accessing Twitter more frequently. However, the year on year user growth figure is
misleading; Snapchat lost two million daily active
Total US revenue was US$423m in Q3 (+28% users in Q3 on top of the three million who
year on year), while international revenue was left in Q2, and further drops are expected. An
up 30% year on year to US$335m. Japan is ill-advised redesign also seemed to reduce user
twitter’s second-largest market, and grew an engagement, with just three billion snaps being
impressive 44% in terms of revenue between created daily by users in Q3 2018 – down by half
Q3 2017 and Q3 2018. a billion from the year before.
Video ad formats continue to account for more Snap’s products include Snap Ads and
than half of ad revenue, with the Video Website Sponsored Creative Tools such as Sponsored
Card increasingly becoming a favourite format Lenses and Sponsored Geofilters, as well as
for campaign launches. measurement services.
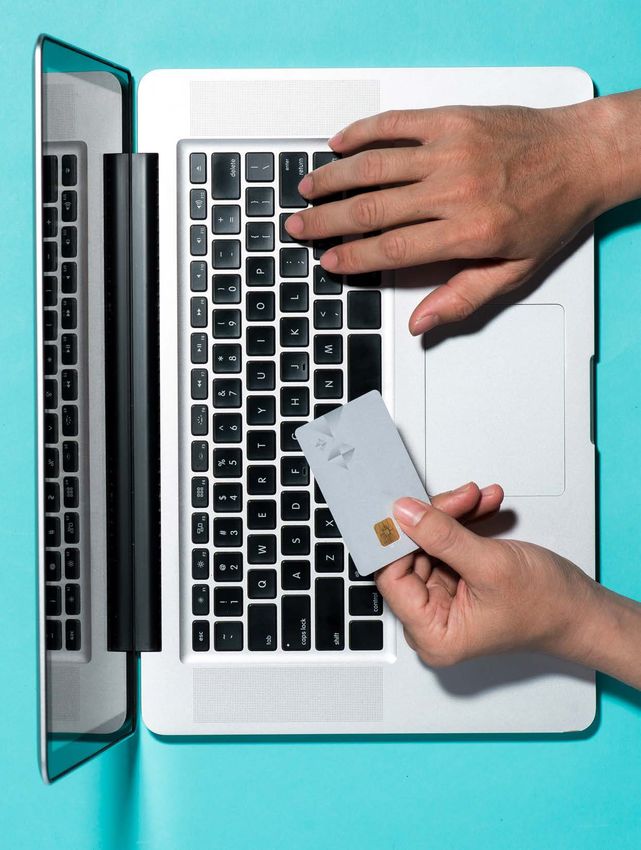
17Marketing Tech | E-commerce advertising
Brands are now embracing
e-commerce ads globally
E-commerce advertising is well established in China, but is only just starting to get going globally. It
has the potential to transform the way brands convert customers online, and provide a substantial
boost to the global advertising market.
E-commerce advertising – that is, advertising that sits
alongside and within search results and product listings on
e-commerce sites – allows brands to communicate with
consumers who are actively shopping online. It can act
like an in-store display in a bricks-and-mortar store, raising
awareness at the point of purchase, or more like a paid
search ad, pushing the brand towards the top of the list
when the customer searches for a particular type of product.
E-commerce advertising has proved wildly successful in
China, where companies like Alibaba – now worth more
than US$400bn – have made it the basis of their business
model. Over the last ten years, e-commerce advertising
in China has grown in value from essentially nothing to
US$16.4bn in 2018 – that’s 19% of China’s entire advertising
market, more than the amount spent on newspaper,
magazine, radio, cinema and out-of-home advertising
combined. It has rapidly found favour with advertisers eager
to connect to consumers at the moment of purchase, from
small local businesses to the biggest international brands.
E-commerce advertising: share of total adspend in China
19.0%
17.1%
15.7%
12.3%
9.5%
8.4%
4.8%
2.2%
1.6%
0.8%
2009 2010 2011 2012 2013 2014 2015 2016 2017 2018
Source: Zenith
18Marketing Tech | E-commerce advertising
Until recently, e-commerce platforms outside China have E-commerce advertising has the potential to substantially
largely focused on direct sales to consumers at the expense boost advertising market as a whole. It is typically spent
of advertising, but that is now changing. Amazon generated by brands’ commercial teams, which negotiate terms
nearly US$5bn in advertising revenue in 2017, up from like shelf-space and prominence with retailers, rather
US$3bn in 2016. In Q3 2018 alone, Amazon’s ad revenues than their marketing teams, which normally deal with a
grew by 122% year on year to reach US$2.5bn, and they are brand’s advertising activities. It is therefore new money
on track to reach about US$10bn for 2018 as a whole. Other to advertising, and should expand the market without
shopping platforms are following suit by investing in their cannibalising money spent elsewhere. This does create
own advertising activities. (Note that these figures slightly a challenge to an advertiser’s organisational structure,
overstate the size of Amazon’s ad revenues. Amazon only though. To make the most of its e-commerce advertising,
reports its ad revenues as part of an ‘Other revenue’ total, an advertiser needs to be able to combine the relevant
which also includes certain other items such as co-branded expertise of both its commercial and marketing teams.
credit cards, but these are pretty minor in comparison to its
ad business.)
Globally, e-commerce advertising is about as advanced
as it was in China at the end of the last decade. Amazon
accounted for 0.8% of global adspend in 2017, the same
proportion that Chinese e-commerce occupied in 2009.
If e-commerce follows a similar path globally to the one
it followed in China, it could account for 19% of global
adspend by 2027. That’s equivalent to US$110bn in today’s
ad market, representing a huge revenue opportunity for
the platforms, and a whole new way for brands to reach
customers at the point of purchase.
The e-commerce opportunity: what 19% of total adspend was worth in 2018 (US$bn)
38.7
27.8
16.4
8.1
4.9 4.4
3.0 2.4 2.4 2.3
USA China Japan UK Germany Brazil South Korea France Australia Other
markets
Source: Zenith
19Marketing Tech | Commerce
Brands need to make the most
of retailer media
Here are a few examples of how brands and retailers can
Marketing imperatives work together to drive growth.
• Don’t rely solely on Amazon – competition here
will only get more intense Use retailer CRM
• Make sure you have a clear understanding of your
current ‘media’ investment with each retailer, from Most retailers have robust customer databases that can be
both marketing and commercial arrangements, used to personalise messaging to customers. When retailers
and the value you receive offer to include a brand in an email, for example, you could
• Consider co-op search campaigns during key make sure that email is sent to loyal customers of that brand,
category moments or those with a propensity to buy that category.
• Develop testing scenarios to measure incremental
sales from joint initiatives
Integrate with retailer advertising
Retailers spend a lot of money on their own advertising,
especially during key shopping periods such as Christmas
Amazon is rapidly developing its advertising services, forcing or Valentine’s Day. Instead of competing with them, make
brands to reconsider how they budget for e-commerce. It use of their elevated visibility by incorporating your products
offers several ways for brands to promote themselves on in their creative, and ensure you have high visibility on their
its platform, such as display ads and sponsored products in category pages. Experiment – you could jointly invest in
search results. Since 86% of visits to product pages come shoppable ads and test their performance together, for
from search, sponsored products are currently the best way example.
to attract the attention of Amazon shoppers. According to
Jumpshot, only 7% of clicks were on sponsored products
in May 2018, but that was up from 5% in January, and the Amplify paid search through co-operative
number of clicks on sponsored products increased by 17% investment
over this period. Brands are rapidly increasing their spend as
competition for the most prominent positions heats up: 20% Retailers dominate paid search. Make your paid search
of all clicks come from the top row of results. investment work harder by conducting joint search
campaigns with retailers, to ensure your product has high
These Amazon services are typically more transparent visibility, drive category growth and boost your presence
and appealing than the media deals typically included within shopping results.
in agreements between brands and retailers. Amazon is
forcing retailers to up their media game, by improving their
transparency, reporting and innovation. For retailers, forging Begin traffic-driving initiatives
stronger partnerships with brands offers the opportunity to
accelerate their e-commerce businesses. For brands, it offers Add Buy Now or Where to Buy functionality to your brand
new ways to reach customers while they are in the process website and your paid media activity. Direct customers to
of purchase and drive new sales. To make the most of these your product pages they are most likely to buy from, and
partnerships, brands need to align their marketing and sales consider this when negotiating your commercial agreement.
teams to clarify their data requirements, integrate marketing For example, agree to direct a proportion of your own
campaigns in commercial agreements, and track activity traffic to a retailer in return for data. The higher the traffic to
through to sale on retailer platforms. your product, the more likely you are to be included in their
retargeting initiatives.
20Marketing Tech | Commerce
Amazon search result placement is vital for product views
Share of product views by Amazon search page results
35%
20%
16%
9%
6%
4% 4% 3% 3%
Row 1 Row 2 Row 3 Row 4 Row 5 Row 6 Row 7 Row 8
First page Other pages
Source: Jumpshot
Amazon is increasing focus on sponsored ads (2018)
Amazon product views from sponsored placements
12.4
11.0
10.2 10.3
9.6
6.8%
5.9%
5.3% 5.3%
4.9%
Jan Feb Mar Apr May
Number of sponsored clicks (million)
Share of clicks from sponsored placements (%)
Source: Jumpshot
21Category Insights | Automotive
In focus: Automotive
In particular, people who are shopping for cars are more
Marketing imperatives likely to spend time researching cars independently –
largely online – and seeking other people’s opinions,
• For auto brands, television is still the most before trying any cars out in person. The number of times
important medium for paid advertising, that people visit dealers before making their purchase has
particularly because new car buyers are heavy dropped steadily over time, and in many cases the buyer
viewers has made up their mind before making a single visit to a
• Most consideration now takes place online, dealership to make the purchase.
so brands need to concentrate their attention
here where it can make the most difference We use our Touchpoints ROI Tracker tool to monitor
• Search, social and video ads are highly trends in brand communication over the full range of
effective and becoming even more so paid, owned and earned touchpoints. One of its outputs
is Brand Experience, which measures the reported
importance of each touchpoint in shaping consumer
attitudes and influencing consumer behaviour. As the
The automotive industry is one of the biggest spenders on chart below shows, the importance of point-of-sale
advertising. Five of the world’s twenty biggest advertisers touchpoints has fallen by nearly half over the last five
are automotive brands, according to Advertising Age, years, while the importance of mass media and advice/
spending a total of US$22bn a year between them. Like recommendation has increased markedly.
other industries, the automotive industry is having to
respond to changes in the way consumers encounter,
choose between and shop for brands, which have been
brought about by new technology.
Share of brand experience Average brand experience
38.8% 1,608
33.3%
28.3%
26.8%
22.7%
882 855
775
16.0%
Mass media Advice/ Point of sale Seeing others TV ads Brand Internet
recommendation with brand websites search
2011-13 2016-18 2016-18
Source: Touchpoints ROI Tracker, January 2019 Source: Touchpoints ROI Tracker, January 2019
22Category Insights | Automotive
The single biggest contributor to consumers’ experience consumers investigate brands, seek out expert opinions
of car brands is seeing other cars on the road. Market and scan reviews from other consumers. Brands are
share is therefore to an extent self-reinforcing. But the therefore shifting their paid media budgets online, to
second-biggest is television ads, hence the heavy influence consumers where they are most receptive.
investment by most brands in high-quality television
campaigns. It’s true that audiences are shifting from Our Touchpoints ROI Tracker also measures the influence
traditional, scheduled television to various forms of of individual touchpoints – i.e. how likely they are to
online video, but this has been most pronounced among change consumers’ beliefs and behaviours. Internet
younger audiences. The target audience for new car sales search, comparison websites, social network ads and
skews older – even for lower-end brands, new car buyers internet video ads are the most influential paid online
are typically over 45 – and for these audiences television touchpoints. All but comparison websites have become
retains most of its reach. substantially more influential over the last five years,
particularly social network ads. As well as using social
The third and fourth-most important touchpoints for networks for brand awareness ads, brands are also
shaping consumers’ experience of brands are online using them to amplify positive reviews by experts and
touchpoints. Like all categories, the automotive industry consumers, and to promote test drives, one of the most
has experienced a large-scale shift of brand experience effective routes to securing the final sale. Brands are also
from offline to online touchpoints, but here the shift experimenting with new technology like Augmented
has been particularly rapid. The online share of brand Reality showrooms to give consumers a better
experience has essentially doubled, to reach 40%, in just experience of the cars on offer, though these are as yet
five years. Online touchpoints now make up the bulk minor contributors to brand experience.
of the consideration phase of the path to purchase, as
Average influence of the top paid online Based on consumer research,
touchpoints Touchpoints ROI Tracker is
Publicis Media’s brand contact
79 81 measurement and planning
75 tool. Since 2004 a total of 1,190
69
63 Touchpoints projects have been
completed across 69 countries,
52
comprising 1,045,083 consumer interviews that
39 40 provide contact point metrics for 15,958 brands in
341 product and service categories. The data for all
projects are stored in a single internet-accessible
database. This database provides normative and
trend data for 301 touchpoints.
All rights to the MCA® measurement system
Internet Comparison Social network Internet
including CCF™, BEP™ and BES™ are owned by
search websites ads video ads
Integration (Marketing and Communications)
Limited and licensed to Publicis Media Limited and
2011-13 2016-18 its affiliates.
Source: Touchpoints ROI Tracker, January 2019
23Category Insights | Automotive
In focus: Automotive
Selected US auto brands on Facebook
Marketing imperatives (December 2018)
• Brands using Facebook need to invest in
promoted posts to ensure their posts are Audi
seen, and have the best chance of engaging 11.2
their fans
• Instagram is a great way for auto brands to 0.11%
reach aspirational young consumers, but
investment here is for the long term, and may Mercedes-Benz
not pay off for years 4.5
0.02%
Facebook is still the biggest social platform for most auto Chevrolet Camaro
brands, at least in terms of the number of fans. Over time, 4.5
though, it has become harder to use Facebook to engage
fans with brand messages. Increased competition for users’ 0.05%
attention, and changes to the news feed algorithm, mean
that brand posts may not even be seen by most fans, and Toyota
those who do see them are likely to scroll past them without 4.2
reacting to them.
0.01%
The chart on the right shows some of the top auto brands
on Facebook in the US and demonstrates the wide variation Lexus
in ‘activation rate’ between these brands. The activation 4.1
rate refers to the proportion of fans who react in some way
to post on the brand page, whether by commenting on it, 0.04%
sharing it, or by clicking on ‘like’ or some other reaction. The
first thing to notice is that activation rates are extremely low. BMW
Even Audi, the best-performing brand, manages to provoke 2.7
a reaction from just 0.1% of fans per post. The second is that
activation rates vary widely – even among this small sample, 0.05%
by an order of magnitude.
Hyundai
One of the biggest barriers to provoking a fan reaction is 2.2
reaching that fan in the first place. Now that organic reach
has become an uncertain route to exposure, paying for 0.03%
reach by using promoted posts can substantially boost the
signal. Socialtools uses machine learning to identify which
posts are likely to have been promoted, and which are likely Number of fans (million)
to be organic. We find there is a clear connection between
use of promoted posts and activation rate. Among these Activation rate
seven top brands, Audi had both the highest activation rate
and the highest share of promoted posts (63% of all posts), Source: Socialtools, January 2019
while Toyota had the opposite – the lowest activation rate
and least promoted posts (just 3%). Auto brands that actively
invest in their reach on Facebook are the ones that cut
through the noise most effectively.
24Category Insights | Automotive
US auto brands drive activation rate with Selected US auto brand followers on social
promoted posts (December 2018) platforms*
2,830 +28.8%
0.12%
0.10%
+15.3%
Activation rate
0.08% 1,280
0.06%
+5.2%
0.04% 229
0.02%
Facebook Instagram YouTube
0.00%
0% 10% 20% 30% 40% 50% 60% 70%
-0.02% Average number of followers December 2018 (000s)
Promoted posts
Growth in follower numbers April-December 2018
Source: Socialtools, January 2019
Source: Socialtools, January 2019
*BMW, Hyundai, Subaru, Toyota
For most auto brands, Facebook is still their biggest source
of social followers, but other platforms are growing much
more quickly. Between April and December 2018, four Brands typically use Instagram to reach young people,
representative brands increased the number of their laying the ground for a purchase that may lie years in the
YouTube subscribers three times faster than their Facebook future. Instagram is a much more aspirational platform than
fans, while their Instagram followers grew nearly five Facebook and YouTube, and many users are more likely
times faster. They still had less than half as many Instagram to follow their dream car brand than the one they’re likely
followers than Facebook fans in December, but the gap is to buy next – which is why Porsche has about as many
narrowing quickly. followers on Instagram as the next four brands put together.
Top five auto brands on Instagram
Socialtools is Zenith’s proprietary (December 2018)
social content performance tracking
tool. Socialtools is currently tracking 13.3
the daily performance of 185,000
pages across six social platforms
(Facebook, Twitter, YouTube,
Instagram, LinkedIn and VKontakte), providing
evaluation of the effectiveness of social content
for brands and their competitors in 195 countries.
4.0 3.5 3.5
Socialtools charts show performance trends across 2.9
a wide variety of social engagement metrics. The
brand performance data, norms and rankings provide
insights into social media best practices for brands in
21 macro categories and 135 categories.
Porsche Jeep Ford Dodge Chevrolet
Number of followers (m)
Source: Socialtools, January 2019
25Digital Channels | Shoppable content
Shoppable content: the future
of branded video
Brands’ investment in original digital video has nearly The primary appeal of shoppable content lies in its ability to
doubled over the last three years, and this growth satisfy the instant desire to purchase that content arouses in
will continue. What began this decade as a US$730m its audience, creating a streamlined and simplified purchase
marketplace is now projected to grow to US$26bn by 2021. funnel. When consumers are able to make purchases
Branded content has evolved to re-shape the balance of seamlessly and impulsively, brands will quickly reap the
power in digital marketing, but has a critical vulnerability: benefits. Shoppable content also provides a clear and
measurement. conclusive link between investment in content and sales.
Effective branded content offers advertisers an opportunity To make shoppable content work for them, brands need to
to engage with consumers in a uniquely intimate way, offer a clear and surprising benefit to consumers, enough
incentivising brands to build ongoing relationships with to make them want to buy the brand at once, perhaps by
audiences who may make a purchase in the future. But it solving a tangible life problem or saving time. They also
lacks any unified measurement standard that effectively ties need to be the sort of product or service that consumers are
product sales back to content investment. In fact, a 2018 IAB comfortable buying at once, without further consideration
survey found that 34% of brand marketers consider ‘ROI vs. – cars probably wouldn’t work too well, for example. Brands
Other Media’ to be the single biggest obstacle to spending that add utility or efficiency to consumers’ lives and can be
more in original digital video. bought on impulse should be the early movers in shoppable
content.
The early iterations of digital branded content were
measured by clicks back to an advertiser URL. By the middle Shoppable content promises to fulfil marketers’ two main
of the decade, when digital publishers embraced the model objectives at the same time: building brands and driving
of distributing content across social platforms, success in sales, in a direct and measurable way.
branded video meant racking up as many views as possible.
Now, when content views have become commoditised,
measurement has shifted to engagement: completion rate,
shares, comments, etc. The exact definition of engagement Marketing imperatives
differs from publisher to publisher, exacerbating the
complexity produced by competing third-party research • Use shoppable content to turn your owned
and brand lift studies. content into a direct sales channel
• Focus on brands that offer an immediate
To cut through this mess, the industry needs to develop a benefit to consumers, one they are happy to
consistent, intuitive framework that simply makes sense to pay for on impulse
marketers, and draws a direct link between content and • Use the subsequent return-on-investment
commerce. data to optimise your content strategy
Shoppable content – which allows consumers to purchase
products and services directly from content – has great
potential to connect the dots between a brand’s investment
in content and its return on that investment. While the idea
of shoppable content is hardly new, media companies
have only recently unveiled scalable and semi-automated
capabilities that allow brands to drive product sales from
within their content.
26Digital Channels | Content
27Digital Channels | Search
Adding value with visual, voice
and video search
The three Vs – visual, voice, video – are all helping to drive growth in brands’ search investments in a
powerful way in 2019 and beyond. They are being deployed to smooth the path to purchase across
the journey, from discovery and consideration to purchase.
The rise of visual search Annual growth in paid-search adspend
Visual search isn’t new, but is reaching a turning point with
consumers. Visual search capabilities are now dovetailing
with search engines and social media platforms frequented
by younger customers, who rely on imagery and are gaining
11% 7% 7% 7%
more disposable income. 2018 2019 2020 2021
The Intent Lab, a research partnership between Performics
and Northwestern University, found that 36% of consumers This research reveals that shoppers want visual content to
have conducted a visual search. 59% of consumers think that aid decision-making across the consumer journey, especially
visual information is more important than textual information, when they’re close to purchase. This visual content must
across all categories. Respondents were most reliant on align with consumer mind-sets at the relevant moments in
visual information in the clothing and furniture categories. the shopping journey.
Importance of visual and textual information by category (% of consumers)
86 85
58 59 59
56 55 54
44 45 46
42 41 41
14 15
Clothes Furniture Cars Groceries Vacations Household Electronics Wine & spirits
Visual Textual
Source: The Intent Lab, Q4 2018. N=1000.
28Digital Channels | Search
Voice search ranks among the most important Video search results aid consumers in
future digital strategies the shopping journey
According to a recent Digital Marketing Institute (DMI) Video clearly influences consumers’ cognitive
survey of senior worldwide marketing professionals, 41% processes while they’re discovering and
believe that voice search will be “most important” for their considering products and services to buy, making
company’s overall digital strategy by 2020. While voice it an opportunity for brands to create excitement
search trails in importance compared to strategies like and curiosity for consumers, especially earlier
machine learning, AR/VR and hyper personalisation, it’s in the decision journey. According to the Intent
still top-of-mind as brands prepare for that moment when Lab’s Q4 2018 research, video was 1.2 times more
a critical mass of people start buying things by voice on effective than text for consumers with a browsing
their smart speakers or smartphones. goal.
Research from the Intent Lab conducted in Q4 2018 found
that shoppers are most interested in buying household
items (19%), meals (15%), and groceries (13%) through
voice.
Technologies that senior marketers believe will be most important for their digital
marketing strategy by 2020 (% of respondents, August 2018)
App technology 67%
AI 66%
Social customer service 61%
Emotional engagement 59%
Machine learning 52%
AR/VR 50%
Automation 49%
Hyper personalisation 44%
Voice search 41%
Source: Digital Marketing Institute, “20/20 Vision: A Marketing Leader’s View of Digital’s Future”
29Digital Channels | CES
What CES 2019 means for brands
The new centrality of data to everyday life leads to inevitable
Marketing imperatives questions about privacy and security. Brands need a
transparent approach to how they’re using data and ensure
• Don’t just give consumers more choice, give a clear value exchange. Consumers need to feel they’re
them tools to help them make better choices receiving something tangible in exchange for sharing their
• Now is the time to invest in Augmented information. Allstate’s ‘Digital Footprint’ is a good example.
Reality experiences
• Your brand identity needs to work in all new CES also showed that Augmented Reality (AR) holds
digital environments immediate promise as a tool for brands to add utility and
delight to customer interactions, with several exhibitors
displaying AR applications that work right now, such as
Hyundai’s driver navigation, Lumus’s smart glasses and
This year’s CES was another extravaganza of innovation, with the Connected Garden. Brands should consider how they
exhibits ranging from rollable TV sets to walking cars. Most can use AR technology to bring the digital world and
of the commentary on the show focuses on exciting new the real world together, whether to provide information,
technology and what it offers to consumers, but we decided entertainment or new brand experiences.
to take a look at the practical implications for brands.
Mastercard unveiled a new wordless logo that will help it
There were close to 70,000 exhibitors in Las Vegas this year, adapt to new digital environments. The move is indicative
showing off a huge variety of products and services. But the of today’s challenges for brands — from smaller smartwatch
big theme we noticed was how the acceleration of data and smartphone screens to voice-based smart home
connections – particularly the forthcoming 5G revolution – assistants to AR and VR, brands need to project a consistent
is making internet connections and sharing of data central and instantly recognisable identity. It has never been more
to the operation of everyday objects, such as household evident that when building your brand identity you must
appliances and cars, be digital first and consider not just today’s platforms, but
emerging environments too.
5G is the next big upgrade to data connections, which
will make connected devices much faster and able to
handle much more data across many more devices, all
with near-instant responsiveness. It will make existing data
services better, and will open up new possibilities. The
truly revolutionary products of 5G have probably not yet
been imagined, but we can expect transformation in the
way businesses interact with suppliers, employees and
customers; new ways of shopping; and more applications
for artificial intelligence. Above all, 5G will mean vastly more
data is generated, transmitted and processed.
This proliferation of digital media and data-enabled services
is leaving consumers tired, distracted and overwhelmed by
choice. Rather than exacerbating this problem by simply
creating new content and launching new services, brands
should seek to understand consumers’ lives and help them
navigate their choices by providing recommendations that
will make their lives better.
30About Zenith
Zenith is The ROI Agency. We blend data, technology and
brilliant specialists to scout out new opportunities, solve
complex challenges and grow our client’s businesses. Zenith
is part of Publicis Media, one of four solution hubs within
Publicis Groupe. We have over 6,000 brilliant specialists
across 95 markets. We are experts in communications &
media planning, content, performance marketing, value
optimisation and data analytics. Zenith works with some of
the world’s leading brands including Coty, Electrolux, Essity,
Kering, Lactalis, Luxottica, Nestlé, Nomad Foods, Oracle,
Perrigo, RB, and 21st Century Fox.
31You can also read