GLOBAL PANDEMIC 2020: INDONESIA'S OUTPUT GAP AND MIDDLE-INCOME TRAP SCENARIO - Kiki Verico
←
→
Page content transcription
If your browser does not render page correctly, please read the page content below

LPEM-FEBUI Working Paper - 057   ISSN 2356-4008
   January 2021

    GLOBAL PANDEMIC 2020:
 INDONESIA’S OUTPUT GAP AND
MIDDLE-INCOME TRAP SCENARIO

                 Kiki Verico
LPEM-FEB UI Working Paper 057

Chief Editor : Riatu M. Qibthiyyah
Editors      : Kiki Verico
Setting      : Rini Budiastuti

© 2021, January
Institute for Economic and Social Research
Faculty of Economics and Business
Universitas Indonesia (LPEM-FEB UI)

Salemba Raya 4, Salemba UI Campus Jakarta, Indonesia 10430
Phone : +62-21-3143177
Fax : +62-21-31934310
Email : lpem@lpem-feui.org
Web : www.lpem.org

LPEM-FEB UI Working Paper 057, January 2021
                                                                                                           ISSN 2356-4008

Global Pandemic 2020: Indonesia’s Output Gap
and Middle-Income Trap Scenario
Kiki Verico1,F

 Abstract
 This paper showed that Indonesia’s output-gap has been improving since 2007 until the global pandemic hit Indonesia
 in 2020. The ultimate indicator for this improvement was the constant decrease in open unemployment. Okun’s Law
 calculation proved that Indonesia’s actual economic growth was higher than minimum economic growth to generate
 jobs. This paper also confirmed the Phillips Curve phenomenon that actual inflation was higher than expected inflation.
 Indonesia’s average economic growth from 2007–2019 has increased above its natural long-run economic growth
 level. The global pandemic decreased Indonesia’s economic growth and increased its open unemployment rate in
 2020. Indonesia’s economy needs an adjustment which depends on the pandemic containment. This adjustment will be
 affecting Indonesia’s scenario in avoiding the Middle-Income Trap before 2040 regarding the end of the demographic
 bonus era. This paper attempts to estimate the impact of the global pandemic on the economy, referring to the Spanish
 Flu’s impact on the global trade openness and how Indonesia adjusts its economy in the short-run and navigates its
 economic transformation in the long-run.

 JEL Classification: O47; G01; E64; J60
  Keywords
  Output-Gap — Global Pandemic Impact — Middle-Income Trap — Open-Unemployment — Indonesia
 1 Institutefor Economic and Social Research (LPEM) Faculty of Economics and Business, Universitas Indonesia (FEB UI)
 F Vice  Director of the LPEM Faculty of Economics and Business of Universitas Indonesia (FEB UI), Assistant Professor at the FEB UI and
 currently work as an Advisor for International Trade and Industry to the Finance Minister of Republic of Indonesia. Email:
 kiki.verico@ui.ac.id; kiverico@gmail.com.

                     1. Introduction                                   remained surplus and surplus of current accounts and de-
                                                                       creased open unemployment from 2007 to 2011. However,
1.1 Background                                                         Indonesia’s income gap (Gini Ratio) increased because of
Indonesia experienced economic crises in 1998 called the               the surplus generated from the increasing value of primary
Asian Financial Crises, which made its economic growth                 commodity export of coal, rubber, palm oil, and others,
dropped to -13 percent while inflation jumped skyrocketing             which are export-based products and non-labor-intensive
to 75 percent. The crisis started from the vast depreciation           ones. Indonesia never experienced a complete set of the com-
of IDR (Indonesia Rupiah) that forced Indonesia’s Govern-              petitive economy of Current Account and Capital Account
ment of the New Order (Orde Baru) to change the exchange               surplus with decreasing open unemployment and income
rate system from fixed to a managed float. The IDR, which              gap.
had been experiencing the overvalue since August 1995                      Since 2012, Indonesia keeps a surplus in Capital Ac-
at 101.98, peaked in April 1997 at 113.07. The IDR was                 count while its economic growth consistently decreases
started decreasing but remained overvalued until August                open unemployment, income gap, and poverty rate, but its
1997 at 103.14 to become undervalued in September 1997                 Current Account is backed to its original position, which is
at 94.93. Since then, IDR turned into deeper undervalued               a deficit. This CA deficit makes IDR returned to the under-
until it reached the very bottom of undervalued at 36.36 in            value position with the expected depreciation of IDR. The
June 1998. Along this process, massive political fluctuating           IDR volatility is much affected by the market sentiment on
occurred in Indonesia, which started from the changing of              Capital Account. Indonesia needs to reduce the dependency
political power from the New Order to the Reform Era (Era              of IDR fluctuation in the Capital Account side, and it needs
Reformasi).                                                            significant structural reform on the CA. The reason is that
     This crisis affected Indonesia’s supply-side of produc-           CA is the ‘above the line’ of Balance of Payment (BoP),
tivity that moved Indonesia to take various significant struc-         which represents a country’s real sector competitiveness.
tural reforms. Economic recovery was started, which indi-              Indonesia must keep its current productivity level of higher
cated by the IDR’s movement undervalued from 37.5 in July              economic growth than the inflation rate and persistent de-
1998 to 70.54 in December 2001. At that time, Indonesia’s              crease of open unemployment while formulating the most
Current Account (CA) was different from previous times                 appropriate structural reform and manufacturing sector strat-
and turned into a surplus, yet the Capital Account of both             egy. Indonesia has to keep it from the middle-income trap
the derivative and FDI (Foreign Direct Investment) was still           before its demographic bonus ended between year of 2030
outflowing. From 2002 to 2006, Capital Account turned                  and 2040.
into a surplus while Current Account remained surplus but                  Nevertheless, an unprecedented global pandemic hit
the open unemployment still increased. Capital Account                 Indonesia in early 2020 after it hit several other countries

                                                                   1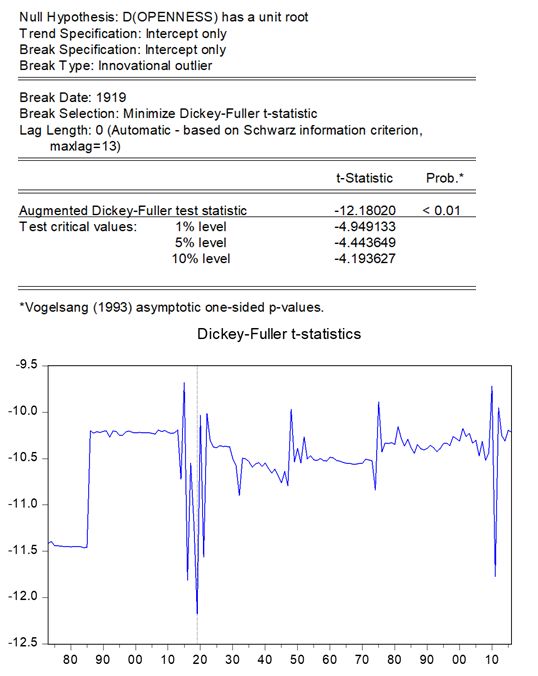
Global Pandemic 2020: Indonesia’s Output Gap and Middle-Income Trap Scenario — 2/12

globally. Indonesia’s economy has experienced a second           analysis of Hodrick-Prescott Filter, Baxter-King Filter, Fre-
economic contraction since 1998. Unlike the 1998’s AFC,          quency Response Function, Dickey-Fuller Test, STL De-
this global pandemic hit both the supply-side of productivity    composition, and Forecasting Averaging. As for the impact
in education and health and the demand side of consumption.      of the global pandemic, this paper assesses its long-run im-
In this uneasy situation, different to the AFC that mostly af-   pact on Indonesia’s strategy on the changing calculation
fect supply-side, this time Indonesia must adopt, adapt and      of necessary economic growth needed to avoid the middle-
apply two big strategies at the same time: countercyclical       income trap using the CAGR (Compound Average Rate of
fiscal policy to maintain basic needs in particular at house-    Return).
hold consumption level and effective pandemic containment
to secure economic activities back to the new normal. Usu-       2.1 Output-Gap Theorem
ally, if the necessary condition has been managed, then the      2.1.1 Okun’s Law (Economic Growth and Open
economy will be overshooting with higher-than-average eco-             Unemployment):
nomic growth. The global pandemic impact affects both the              Ynt1 −Ynt0 Ymnt1 −Ymnt0
                                                                                  =                − α.(Unt1 −Unto )    (1)
Indonesia’s output gap and strategies to avoid the middle-                Ynt0           Ymnt0
income trap.                                                     Y = GDP constant price; n = country; m = minimum eco-
                                                                 nomic growth to generate employment; U = Open Unem-
1.2 Objective                                                    ployment Rate; t = time; α = elasticity of economic growth
Given the background, this paper has several related objec-      and unemployment.
tives:
                                                                 2.1.2 Phillips Curve (Inflation Rate and Economic
    1. Understanding Indonesia’s output gap before the glo-            Growth):
       bal pandemic hit Indonesia
                                                                                             Ynt1 −Ynt0 Ymnt1 −Ymnt0

    2. Knowing the impact of the global pandemic on the                πnet1 = πnat1 − β .              −                  (2)
                                                                                                Ynt0           Ymnt0
       global economy from the Spanish Flu experienced
    3. Envisaging the short-run impact of the current global     π = inflation rate; na = actual of n country; e = expected of
       pandemic on Indonesia’s economy                           n country; β = elasticity of economic growth relative.
    4. Estimating the long-run impact of the current global      2.1.3 Unemployment Gap (NAIRU and Inflation Rate):
       pandemic to Indonesia’s middle-income trap strategy              NAIRUnt1 = Unt1 + γ.(πnat1 − πnet1 )                   (3)
                                                                 NAIRU = Non-Accelerating Inflation Rate of Unemploy-
1.3 Research Question
                                                                 ment of country n time t; γ = elasticity of inflation rates
Given the objectives, this paper has several related ques-
                                                                 relative.
tions:
   1. How did Indonesia’s output gap look like before            2.1.4 Long Run Aggregate Supply (LRAS) and Inflation
       2020?                                                           Rate:
   2. What were the impacts of the previous global pan-                Ynt1 −Ynt0 YLRt1 −YLRt0
                                                                                   =           + δ .(πnat1 − πnet1 ) (4)
       demic of the Spanish Flu on the global economy?                    Ynt0           YLRt0
   3. How does the current global pandemic affect Indone-        LR=natural growth/long run; δ = elasticity of economic
       sia’s economy?                                            growth and inflation rate.
   4. How does the current global pandemic affect Indone-
       sia’s middle-income trap strategy?                        2.2 Time-Series Analysis Method
                                                                 2.2.1 Hodrick-Prescott Filter
1.4 Specific Coverage                                            McElroy (2008) explains the exact formulas for the H-P
This paper focuses on two levels of observations: one is the     Filter. The general HP filter formula starts with:
global level to estimate the global pandemic’s impact on the                          q
global economy. This global environment will be affecting                H(b) =                                      (5)
                                                                                q + (1 − b)4
economic recovery in any country, including Indonesia. Two
                                                                      This formula has symmetric coefficient, with low-pass
is the country level, which is Indonesia. This paper focuses
                                                                 filter and high-pass filter 1- H(b) for the estimation of cycles.
on the impacts of the global pandemic on Indonesia’s output-
                                                                 His method utilize low-pass as the high-pass factorization
gap and strategies to avoid the middle-income trap.
                                                                 will easily adjust. This model argues that frequency filter
                                                                 of H-P follows ARIMA framework with polynomials and a
 2. Reference and Theoretical Overview                           constant variable.
This paper adopts the output-gap calculation to show the         2.2.2 Baxter-King Filter
output-gap situation in Indonesia before the pandemic. They      Murray (2003) argued that both H-P Filter (1980) and B-K
are Okun’s Law (open unemployment and economic growth),          Filter (1999) are essential to evaluate business cycle yet B-K
Phillips Curve (economic growth and inflation rate), NAIRU       Filter is more ideal in terms of bandpass filter. This filter fits
(Non-Accelerating Inflation Rate of Unemployment for             two-way infinite moving average representation as defined
inflation and unemployment rate), LRAS (Long-Run Ag-             as follows:
gregate Supply for inflation rate and long-run economic
                                                                        a(L) = ak Lk                                           (6)
growth). This paper observes the global pandemic’s impact
on the global economy using the Spanish flu’s global pan-            Where as ak is symmetric filter with a−k B-K passes
demic as a lesson learned. This paper applies the time-series    stationarity in the range of 1.5 to 8 years.

LPEM-FEB UI Working Paper 057, January 2021
Global Pandemic 2020: Indonesia’s Output Gap and Middle-Income Trap Scenario — 3/12

                                                                     ∂ ynt
2.2.3 Frequency Response Function                                     ynt  : Real Economic Growth country n time t;
Lingren (1959) firstly explains about frequency response             Int :Manufacturing Strategies based Investment;
function as follows:                                                 Xnt − Mnt : Current Account;
               Z ∞                                                   ∂nt : depreciation;
       Yiw =         e−1tw .dK(t)                             (7)    ρnt : Population;
                −∞
                                                                     ∂E
                                                                     Ent : Marginal Productivity of Labour;
   Where K(t) is bounded variation representing the im-              Knt
pulse response. This function is important to assess the             Lnt : Infrastructure Availability;
                                                                     knt
impulse response of the cycle.                                       lnt : Level of Technology (Manufacture Strategy);
                                                                     cnt : ICOR.
2.2.4 Dickey-Fuller Test
Montañés & Sansó (2001) shows D-F tests attempt to reject             The combined formulation shows that sources of eco-
hypothesis null (H0) except when the break affects all the           nomic growth are the investment (in relation to manufac-
period. Therefore, the breakpoints can be various in time.           turing empowerment the important thing is Foreign Direct
                                                                     Investment/FDI), trade with the proxy of the net export
2.2.5 Forecast Averaging                                             (competitiveness), trade and investment strategies (Verico,
Pesaran & Pick (2011) compares two forecast methods, one             2017b), sustainable concern (depreciation of environment
is single estimation and two is averaging forecast. Their            from depletion and degradation), number of populations,
study found that averaging forecast generates smaller root           productivity level, infrastructure availability, level of tech-
mean square forecast error (RMSFE) than single estimation.           nology and the economic efficiency with good regulatory
                                                                     framework, good governance, clean government and ICT
2.2.6 STL Decomposition
                                                                     based system.
Seebens et al. (2007) proves that STL decomposition of
time-series covering trend, seasonal and residual can take           2.2.8 Calculation of the CAGR
more comprehensive description of time-series trend.
                                                                                 ant0 ∗ (1 + g)t = bnt1
2.2.7 Middle-Income Trap                                                                                  bnt1
A developing country, to escape from the middle-income                           t ∗ Log(1 + g) = Log
                                                                                                          ant0
trap, needs a manufacturing sector strategy. This strategy
                                                                                       Log bant1
will be affecting the international reserve and fiscal support                   t=          nt0
                                                                                                                                (9)
as well as structural reform guidance.                                                Log(1 + g)
     Lin (2017) explains five types of manufacturing sector          Where t = time to achieve High-Income Country (HIC)
strategies: catching-up (tech transfer from developed to de-         from starting year; bnt1 = GDP per Capita of High-Income
veloping), leading and cutting edge (RND and Innovation              Country; ant0 = GDP per Capita t0 of country n; g = growth
role), comparative advantage losing industries (based on             scenario
the comparative advantage analysis), short-innovation cycle
(catching-up the advanced countries technology), and strate-                      3. Descriptive Analysis
gic industries (mostly government led industrialization).
Indonesia needs to adopt more than one type of manufac-              3.1 Global Pandemic Impact: Spanish Flu 1919
turing strategy with a complete set of information on in-            The only lesson learned that the world could exercise to
dustrialization’s benefit and cost of the medium to long-run         obtain a big picture of how the global pandemic even not
framework.                                                           straight ‘apple to apple’ comparison is Spanish Flu 1918-
     Verico (2017a) argues that trade and investment are the         1920. This paper uses Economic Openness as a proxy since
essential variables to keep sustainable economic growth              this indicator covers both two-way policy and market power.
and help the developing country escape from the so-called                The filter of HP on the cycle clearly shown that the
’middle-income trap’. This study mostly discusses compar-            most significant break occurred between 1918 to 1920. This
ative advantage industrialization, which is based on Indone-         fact initially confirmed that the global pandemic created
sia’s current condition. This study proposes that Indonesia          an enormous impact on the economy (see Figure 1). This
starts with trade in manufacturing sector competitiveness.           paper used another filter of Baxter-King and confirmed that
These strategies will positively affect capital inflows and          between 1918 to 1920, there was a high impact on the global
influence the nominal exchange rate’s stability and reduce           economy (see Figure 2). The frequency response function
the current account deficit or perhaps turn it into a current        in Figure 2 showed that there was strong power that makes
account surplus.                                                     actual openness significantly dropped from its potential
     Combining the Solow Growth Model, Harrod-Domar                  and generated overshooting economic recovery in 1922.
Model, Cobb-Douglas dan Saving-Investment Gap Model                  From this figure, the world estimated that the impact of the
gives a clear description of what factors affecting economic         Spanish Flu was around five years. This paper applies the
growth as follows:                                                   Dickey-Fuller test, regression, and figure, and both found
         n                         h                  io q           that the breakpoint was in 1919 (see Figure 3).
 ∂ ynt     [Int + (Xnt − M nt )] −  ∂ nt + ρ nt + ∂E
                                                  Ent   . (K,k) nt
                                                           (L,l)nt       The Forecast Averaging showed that breakpoint in 1919
       =                                                             affected global economy contraction until the great depres-
  ynt                                cnt
                                                                     sion in 1930’s (see Figure 4). Last but not least STL De-
                                                               (8)
                                                                     composition also shown similar result with the Forecast
Where:                                                               Averaging function (see Figure 5).

                                                                                LPEM-FEB UI Working Paper 057, January 2021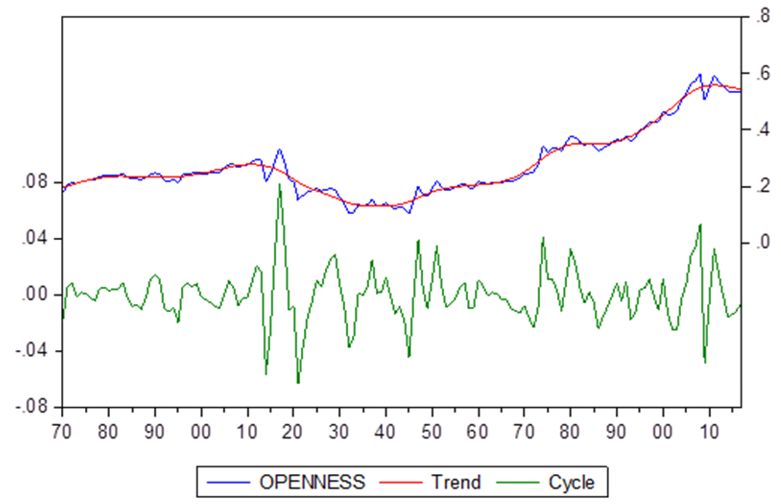
Global Pandemic 2020: Indonesia’s Output Gap and Middle-Income Trap Scenario — 4/12

3.2 Indonesia’s Output-Gap: Before Global                        increases since the AFC 1998.
     Pandemic 2020                                                    Indonesia’s economic growth was always above its long-
From bivariate regression of elasticity with log-log model of    run economic growth (see Figure 10). This figure confirmed
the period of 1990-2017 data, this paper found that elasticity   that Indonesia’s economic growth is always higher than
of α (Okunˆ’ s Law), β (Phillips Curve), γ (Unemployment         its natural economic growth or long-run economic growth
Gap), δ (Long-Run Economic Growth Gap) as 0.62, 0.60,            or long-run aggregate supply growth from 2007 until the
0.14 and 0.67 respectively.                                      global pandemic hit Indonesia’s economic growth.
    Okun’s Law shows that open unemployment has an in-
verse relation to the economic growth gap between actual         3.3 Indonesia’s Economic Recovery
and minimum economic growth. The minimum economic                Since 2020 global economy, including Indonesia’s economy,
growth reflects the minimum growth to generate employ-           is facing the most challenging time due to the unprecedented
ment. Indonesia experienced negative economic growth             global pandemic, which hit both the demand and supply side
(contraction) in 1998 called the Asian Financial Crises          of the economy. This economic contraction had increased
(AFC), which decreased economic growth to a negative             the open unemployment rate in 2020 and deteriorated all
13 percent and increased the skyrocketing inflation rate to      kinds of output-gap.
75 percent. Indonesia faced stagflation in 1998. Time-series          Different to the economic contraction in 1998 that hist
wise, Indonesia experienced the increasing trend of open         supply-side, this global pandemic hit all around the world
unemployment before the AFC and afterward until 2006. It         at both supply-side (aggregate supply/AS) and demand-
took around eight years for Indonesia to reduce open unem-       side (aggregate demand/AD) (see Graph 1). Unprecedented
ployment since the AFC. In the last ten years, Indonesia’s       global pandemic decreased the AD as many sectors affected
annual ability to reduce open unemployment was around            by the limitation of the social movement. Sectors that de-
350 to 400 thousand (see Figure 6).                              pend on people’s mobility, such as transportation, hotel,
    From 2007 until just before the global pandemic hit          and restaurant, were much impacted while accommodation
Indonesia in 2020, Indonesia’s open unemployment de-             was the most labor absorption sector in the last ten years,
creased. Even economic growth was relatively low, but it         followed by the manufacturing sector.
can generate employment. Indonesia’s economic growth has              After a while, aggregate supply decreased followed the
quality. Nevertheless, the power of Indonesia’s economic         decline of the AD. The economic growth decreased, but the
growth to reduce open unemployment has been decreasing           inflation rate was not skyrocketing as stagflation in 1998.
since the decreasing growth of the most labour absorptive        The difference is decreasing the AD; therefore, fiscal have
sector, manufacture. Indonesia needs to redefine its long-run    to be countercyclical and mostly allocated for social safety
manufacturing sector strategy to boost its economic growth       purposes. The next best aim is supporting the aggregate sup-
and increase its labour absorption capacity. The increase        ply with the necessary condition is pandemic containment.
of the manufacturing sector will increase labour absorption      The latter will affect the potential overshooting situation
and increase economic growth to its potential (see Figure        right after the contraction, and its long-run sustainability de-
7). This figure shows that Indonesia’s open unemployment         pends on structural reform during the economic hibernation
rate can decrease below its potential; therefore, based on       due to social mobility limitation.
Okun’s Law, the economic growth and actual inflation are              In reality, Indonesia needed to hold the Aggregate De-
possible to be increased.                                        mand to not dropped too much. Simultaneously, in 2021, if
    Figure 6 and Figure 7 show that Indonesia’s economy          the vaccine effectively works for herd immunity, the econ-
has quality as it can reduce open employment, increase ac-       omy will accelerate supply-side. In 2022, if all scenarios in
tual economic growth above minimum economic growth               2020 and 2021 work smoothly, Indonesia can experience an
to generate employment, and remain capable of increas-           overshoot state with fast acceleration in economic growth
ing even more. This phenomenon indicates that Indonesia’s        and speed recovery. In 2023 and afterward, Indonesia’s
economy can move from middle-income to the high-income           economy can adjust with any new normal scenario that
level. Figure 6 needs to be detailed into the Phillips Curve     available for the world.
indicator, NAIRU (Non-Accelerating Inflation Rate of Un-
employment), and the comparison bias to its long-run eco-        3.4 Indonesia’s Middle-Income Trap Scenario:
nomic growth. Figure 7 needs to be further observed with              Before Global Pandemic 2020
the Middle-Income Trap (MIT) scenario. Similar to Figure         Indonesia has a potential demographic bonus until 2040.
6, which is undoubtedly affected by the global pandemic          Indonesia needs to achieve the high-income level before that
2020, Figure 7 needs MIT scenario adjustment given that.         year. Indonesia had just entered the upper-middle-income
    Figure 6 needs more detailed confirmation from the           level in 2020, and it has less than 20 years to transform its
Phillips Curve model. This paper found that consistent with      economic level from upper-middle-income level of ’take-
Okun’s Law result, the actual inflation rate was always          off’ to a high-income level of ’maturity.’ The world wit-
higher than the expected inflation rate from 2007 until 2019     nesses only Japan and South Korea that transformed their
(see Figure 8).                                                  economic level with that fast track. Based on the calculation,
    As from the unemployment gap between NAIRU actual            Indonesia can transform its economy from middle-income
open unemployment, this paper found another consistent           to high-income and escape from the middle-income trap
result: the open unemployment rate was lower than NAIRU          before 2040 if its economic growth is above six percent (see
since 2007 (see Figure 9). This calculation proved that even     Figure 11). Given this, Indonesia needs a big manufacturing
smaller but the quality of Indonesia’s economic growth           scenario as this sector is dominant in Indonesia’s economy,

LPEM-FEB UI Working Paper 057, January 2021
Global Pandemic 2020: Indonesia’s Output Gap and Middle-Income Trap Scenario — 5/12

labour-intensive, and has solid backward and forward link-             escape from the middle-income trap. Indonesia must
age. This scenario will be affecting not only fiscal posture           have average economic growth above six percent by
but also the usage of international reserve and the Cur-               2040 because it has been predicted as the last period
rent Account Deficit for a specific time until it turned into          for the demographic bonus.
surplus if the scenario succeeds in increasing Indonesia’s          8. Learning from the previous economic crises and global
manufacturing competitiveness in the world.                            pandemic impact of the Spanish Flu on the economy,
                                                                       right after the core problem was contained, the econ-
3.5 Indonesia’s Middle-Income Trap Scenario                            omy will experience overshooting. To obtain opti-
      Adjustment                                                       mum benefit from the overshooting, Indonesia needs
Indonesia must change its strategy, given the pandemic im-             to prepare appropriate structural reform with long-run
pacts on its economic growth. Newly simulation of CAGR                 manufacturing sector empowerment.
indicated that the average minimum economic is six percent.          Indonesia must optimize the 8 major economic growth
Before the global pandemic hit Indonesia’s economy, the av-      sources in the medium to long-run: Foreign Direct Invest-
erage could be between five percent to six percent, but now      ment (FDI), Current Account (CA), Environment Justice,
this is no longer the option. Indonesia must boost its average   Number of Population, Productivity, Economic Efficiency,
economic growth to at least six percent before 2040 (see Fig-    Infrastructure Availability, and Level of Technology. In-
ure 12). Indonesia must adopt, adapt, and apply significant      donesia must keep all of these indicators and adjust them at
structural reform and effective manufacturing sector strate-     any changing circumstances, including the global pandemic
gies to be one of the world’s major manufacturing exporters.     impacts. This period is the best time to implement structural
Indonesia has to adjust its economy depends on pandemic          reform and redefine a medium to long-term strategy wel-
containment. Once the pandemic can be contained, the econ-       coming the overshooting economic recovery right after the
omy will be overshooting as naturally found in any country       core problem has been contained.
that just stepped out from the crisis. Indonesia must prepare
structural reform in order to make the overshoot in line with                           References
Indonesia’s accelerating economic recovery.
                                                                 Lin, J. Y. (2017). Industrial policies for avoiding the middle-
                                                                   income trap: a new structural economics perspective. Journal
                    4. Conclusion                                  of Chinese eConomiC and Business Studies, 15(1), 5-18. doi:
                                                                   https://doi.org/10.1080/14765284.2017.1287539.
This paper found that:
                                                                 Lindgren, B. W. (1959). On Samulon’s Formula for Frequency
   1. Indonesia’s economic growth after the AFC 1998 but           Response from Step Response. SIAM Review, 1(1), 47-49. doi:
      before the pandemic 2007-2019 decreases open un-             https://doi.org/10.1137/1001005.
      employment. Therefore, even the average economic           McElroy, T. (2008). Exact formulas for the Hodrick-Prescott
      growth, for instance, less than six percent in the last      filter. The Econometrics Journal, 11(1), 209-217. doi:
      ten years, can create jobs. This finding proved that         https://doi.org/10.1111/j.1368-423X.2008.00230.x.
      Indonesia’s economic growth has quality.                   Montañés, A., & Sansó, A. (2001). The Dickey-Fuller test family
   2. The open unemployment has been constantly de-                and changes in the seasonal pattern. Annales d’Économie et de
      creased therefore Indonesia’s output gap in the Okun’s       Statistique, (61), 73-90.
      Law, Phillips Curve, NAIRU (Non-Accelerating In-           Murray, C. J. (2003). Cyclical properties of Baxter-King filtered
      flation Rate of Unemployment), and the gap between           time series. Review of Economics and Statistics, 85(2), 472-476.
                                                                   doi: https://doi.org/10.1162/003465303765299945.
      natural economic growth of the LRAS and annual
                                                                 Pesaran, M. H., & Pick, A. (2011). Forecast combination across
      economic growth are decent.                                  estimation windows. Journal of Business & Economic Statistics,
   3. Global pandemic hit global economy due to the social         29(2), 307-318. doi: https://doi.org/10.1198/jbes.2010.09018.
      movement limitation that makes economic sectors            Seebens, H., Straile, D., Hoegg, R., Stich, H. B., & Einsle, U.
      dependent on people mobility got high impact and             (2007). Population dynamics of a freshwater calanoid copepod:
      spill over to other sectors.                                 Complex responses to changes in trophic status and climate
   4. Learning from the global pandemic of 1918-1920               variability. Limnology and Oceanography, 52(6), 2364-2372.
      of the Spanish Flu, it made the global economy con-          doi: https://doi.org/10.4319/lo.2007.52.6.2364.
      tracted for around four years. It generated a long-term    Verico, K. (2017a). Indonesia towards 2030 and beyond: A long-
      economic impact on the great depression about 15             run international trade foresight. MPRA Paper No. 79665. Mu-
      years afterward.                                             nich Personal RePEc Archive. https://mpra.ub.uni-muenchen.
                                                                   de/79665/.
   5. The global pandemic has put Indonesia’s economic
                                                                 Verico, K. (2017b). The future of the ASEAN economic integration.
      growth into a sub-zero economic growth zone with             Palgrave Macmillan UK.
      low inflation, which differs from the Asian Financial
      Crisis 1998 that generates a skyrocketing inflation        Sources of Data:
      rate with immense negative economic growth.                  World Development Indicators — DataBank (worldbank.org)
   6. Global pandemic hit aggregate demand and aggregate           Badan Pusat Statistik (bps.go.id)
      supply; therefore, social safety net and economic stim-
      ulation to the most impacted sector and non-formal
      activities are very important.
   7. The global pandemic affected economic growth and
      its GDP per Capita level. It involves the scenario to

                                                                            LPEM-FEB UI Working Paper 057, January 2021
Global Pandemic 2020: Indonesia’s Output Gap and Middle-Income Trap Scenario — 6/12

                                                 Figures

                         Figure 1. Business Cycle of Economic Openness (Filter of H-P)
                                                   1870–2018
                                Source: Own Illustration with various dataset, 2021

                         Figure 2. Business Cycle of Economic Openness (Filter of B-K)
                                                   1870–2018
                                Source: Own Illustration with various dataset, 2021

LPEM-FEB UI Working Paper 057, January 2021
Global Pandemic 2020: Indonesia’s Output Gap and Middle-Income Trap Scenario — 7/12
Figure 3. D-F Breakpoint Test
1870–2018
Source: Own Illustration with various dataset, 2021
Figure 4. Forecast Averaging
1870–2018
Source: Own Illustration with various dataset, 2021
LPEM-FEB UI Working Paper 057, January 2021Global Pandemic 2020: Indonesia’s Output Gap and Middle-Income Trap Scenario — 8/12
Figure 5. STL Decomposition
1870-2018
Source: Own Illustration with various dataset, 2021
Figure 6. Okun’s Law of Indonesia Before the Global Pandemic
1996–2019
Source: Own Illustration with various dataset, 2021
LPEM-FEB UI Working Paper 057, January 2021Global Pandemic 2020: Indonesia’s Output Gap and Middle-Income Trap Scenario — 9/12
Figure 7. Potential Open Unemployment, Economic Growth, Inflation Rate of Indonesia
1996–2019
Source: Own Illustration with various dataset, 2021
LPEM-FEB UI Working Paper 057, January 2021Global Pandemic 2020: Indonesia’s Output Gap and Middle-Income Trap Scenario — 10/12
Figure 8. Phillips Curve of Indonesia on the Gap between Actual and Expected Inflation Rate
1996–2019
Source: Own Illustration with various dataset, 2021
Figure 9. Unemployment Gap of NAIRU and Open Unemployment
1996–2019
Source: Own Illustration with various dataset, 2021
Figure 10. Indonesia’s Short and Long-Run (LRAS) Economic Growth Impact
1996–2019
Source: Own Illustration with various dataset, 2021
LPEM-FEB UI Working Paper 057, January 2021Global Pandemic 2020: Indonesia’s Output Gap and Middle-Income Trap Scenario — 11/12
Figure 11. Indonesia’s Scenario to Achieve High-Income Country (Escaping the Middle-Income Trap)
Source: Own Illustration with various dataset, 2021
Figure 12. Indonesia’s Adjustment Scenario to Achieve High-Income Country Level
Source: Own Illustration with various dataset, 2021
LPEM-FEB UI Working Paper 057, January 2021Global Pandemic 2020: Indonesia’s Output Gap and Middle-Income Trap Scenario — 12/12
Graph 1. The Impacts of the AFC 1998 and the Global Pandemic 2020 on Indonesia’s Economy
Source: Own Illustration, 2021
LPEM-FEB UI Working Paper 057, January 2021Gedung LPEM FEB UI Jl. Salemba Raya No. 4, Jakarta 10430 Phone : +62-21 3143177 ext. 621/623; Fax : +62-21 3907235/31934310 Web : http://www.lpem.org/category/publikasi/workingppers/
You can also read