GREATER CAPE TOWN WATER FUND - BUSINESS CASE - SUMMARY OF FINDINGS NOVEMBER 2018 - The Nature Conservancy
←
→
Page content transcription
If your browser does not render page correctly, please read the page content below
GREATER CAPE TOWN WATER FUND
BUSINESS CASE – SUMMARY OF FINDINGS
NOVEMBER 2018
INTRODUCTION
Water security is a major concern globally and increasingly Analysis demonstrates that the restoration of priority sub-
so in parts of the world where supply is not able to meet catchments through the removal of alien plant invasions
demand because of climatic or human pressures, or both. will generate expected annual water gains of 50 billion liters
Nowhere is this more true than for the Greater Cape Town (50 Mm3) within five years compared to the business as
Region, South Africa, where the City of Cape Town faced usual scenario — equivalent to one-sixth of the city’s current
the possibility of running out of water following a three- supply needs. These annual gains double to 100 billion
year drought between 2015 and 2018 — which would liters (100 Mm3) within 30 years. Catchment restoration
have been a global first for as large a city. Not only did the is significantly more cost-effective than other water
drought impact urban water users, it also had significant augmentation solutions, supplying water at one-tenth the unit
economic and social consequences for the tourism and cost of these alternative options.
agricultural sectors.
Funding and coordination of restoration efforts will be
The Business Case puts forward ecological infrastructure overseen by a collective action Water Fund that pools
restoration as a critical component of efforts to enhance investment across multiple public and private water users.
water security for all users of the Western Cape Water
Supply System (WCWSS) (Figure 1). This document summarises the findings of the Greater Cape
Town Water Fund Business Case.1
1. nature.org/cape-town-water
2 | THE GREATER CAPE TOWN WATER FUND BUSINESS CASE SUMMARY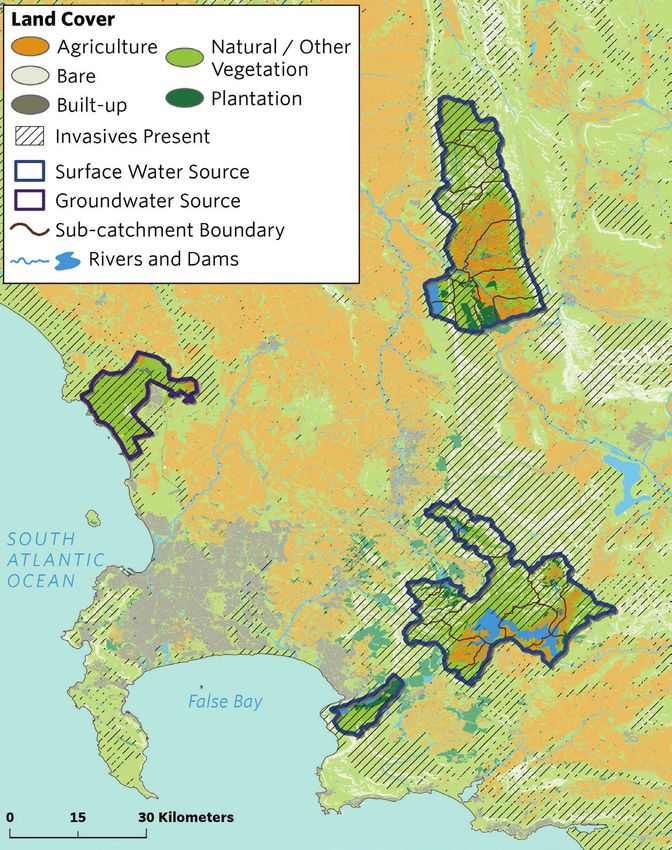
Figure 1. Western Cape Water Supply System users include the Cape Town metropolitan area, the agricultural
sector, and smaller municipalities and communities.

                                                                                 THE GREATER CAPE TOWN WATER FUND BUSINESS CASE SUMMARY |   1
AVOIDING DAY ZERO
At the height of the water crisis in early 2018, dam levels
dropped below 20% and Cape Town prepared for the
day when the taps would run dry, dubbed “Day Zero”.
Day Zero was narrowly avoided due to adherence to
short-term water use restrictions, a cut in irrigation water
to agriculture, and additional water pumped in from
a neighbouring scheme. However, the threat remains.
Cape Town’s population is growing fast, at a rate of about
2.6% a year, while water supply has flatlined (Figure 2).
Climate models show decreased rainfall accompanied with
increased temperatures in the future, increasing the risk of
water shortages.                                                                      The City of Cape Town has had remarkable success coping
                                                                                      through demand management schemes, including public
Water demand is predicted to outstrip current supply in                               outreach and the reduction in losses due to leaks, but
the Greater Cape Town Region by 2021.                                                 current forecasts suggest that an additional 300-350
                                                                                      million liters of water a day will be needed by 2028 to
This could have dire consequences for Cape Town, the                                  ensure supply meets demand.
agricultural sector, and neighbouring municipalities who
all depend on this water source. The recent drought cost                              More than R8 billion ($540 million USD) in public funding
more than 30,000 agricultural jobs in areas serviced by                               is being considered for augmenting water supply through
the Western Cape Water Supply System and negatively                                   investments in deep aquifer drilling, desalination, water
impacted the tourism industry, bringing the importance of                             reuse and increased surface water storage to meet the
water security to the forefront.                                                      required demand.

                                                          POPULATION GROWTH AND WATER SUPPLY
                                          700                                                                                        6.0

                                          600
                                                                                                                                     5.0
    WATER TREATED PER YEAR (million m3)

                                          500
                                                                                                                                     4.0
                                                                                                                                                POPULATION (millions)

                                          400

                                                                                                                                     3.0

                                          300

                                                                                                                                          2.0
                                          200

                                                                                                                                     1.0
                                          100

                                           0                                                                                          0
                                            1950   1960           1970      1980         1990         2000          2010          2020

Figure 2. The population is growing while water supply has flatlined. 2
                                                          Water Supply   Population         Exponential Population Growth

   2. Figure adapted from City of Cape Town

2 | THE GREATER CAPE TOWN WATER FUND BUSINESS CASE SUMMARY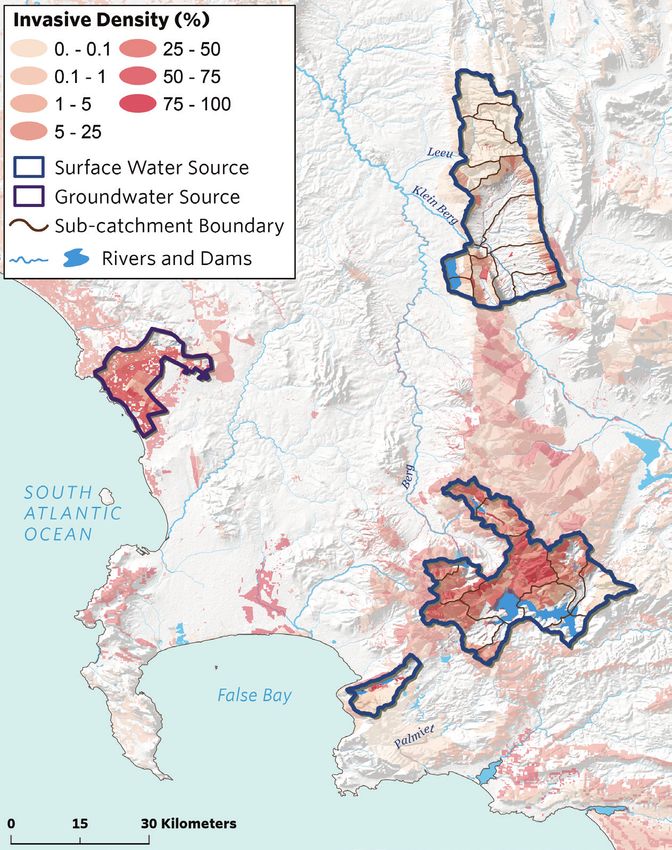
THE CASE FOR ECOLOGICAL INFRASTRUCTURE
While until recently the focus has been on grey, or built,                                     during dry periods, while invasive plants such as Australian
infrastructure solutions to combat water scarcity, there is                                    black wattle have extensive rooting systems which allow them
another more cost-effective option with the potential to                                       to access groundwater and keep growing, even during drought.
augment water supply. Long-term water security in the
Greater Cape Town Region, as elsewhere, begins at the                                          These alien plant invasions in the main water source areas
source with the ecological infrastructure (native vegetation,                                  of the WCWSS reduce the amount of water that reaches
wetlands, etc.) that regulates source water quality and                                        the rivers and dams that feed the region, resulting in a loss
supply. Healthy catchments naturally store, filter, and                                        of an estimated 55 billion liters of water (55 Mm3) a year.
transport rainfall to rivers and dams.                                                         That is the equivalent of nearly two months of Cape Town’s
                                                                                               annual water supply. In a region where every drop of water
The state of many of the source water sub-catchments                                           counts, these losses are significant.
feeding the WCWSS is being heavily degraded by invasive
alien plants. These trees quickly replace native species if                                    In response, a coalition of partners including The Nature
unmanaged and threaten the diversity of native plant life in                                   Conservancy, National Department of Water and
the Cape Floral Kingdom, where 70% of plants are found                                         Sanitation, National Department of Environmental Affairs
nowhere else on the planet. Invasive alien plants alter soil                                   (Environmental Programmes), Provincial Department of
ecology, increase the frequency and severity of wildfires,                                     Environmental Affairs and Development Planning, City
and significantly impact river flow and aquifer recharge.                                      of Cape Town, SANBI, CapeNature, Coca-Cola Peninsula
                                                                                               Beverages, Nedbank, Remgro Ltd, and WWF, came
Thirsty invasive alien plants, including Australian acacias,                                   together under the auspices of the Greater Cape Town
pines and eucalyptus, have roots that extend deep into                                         Water Fund Steering Committee.
the soil and use up to 20% more water per hectare than
                                                                                               The Committee commissioned studies to evaluate the
the region’s native fynbos vegetation.
                                                                                               impact of nature-based solutions, beginning with targeted
                                                                                               removals of alien plant invasions, on water supply,
They have increased evapotranspiration rates because they
                                                                                               and determine whether investing at scale in ecological
are taller and have a larger leaf surface area than native
                                                                                               infrastructure restoration is in fact cost competitive with
species. The growth of many native species is water limited
                                                                                               other supply-side solutions.

                                                               PERCENT INVASIVE ALIEN PLANT COVER
                              8376
                              8228
                              7897
                              7840
                              7759
                              7698
                               8361
                              8412
       Sub-Catchment Number

                              8334
                              8366
                              7825
                              7738
                              8340
                              7862
                              8340
                              8433
                              8376
                               7911
                               8311
                              7540
                              8253
                              7703
                              7634
                              7610

                                      0%      10%        20%         30%          40%          50%          60%          70%         80%          90%         100%

                                                                           Percent of Catchment with Invasives Present
                                  Percent of Sub-Catchment with Condensed Invasive Alien Plants              Percent of Sub-Catchment with Invasive Alien Plants

Figure 3. Invasive alien plant coverage of sub-catchments, showing percentage of land where invasive plants are present and the
percentage of hectares with condensed invasives.

                                                                                                                   THE GREATER CAPE TOWN WATER FUND BUSINESS CASE SUMMARY |   3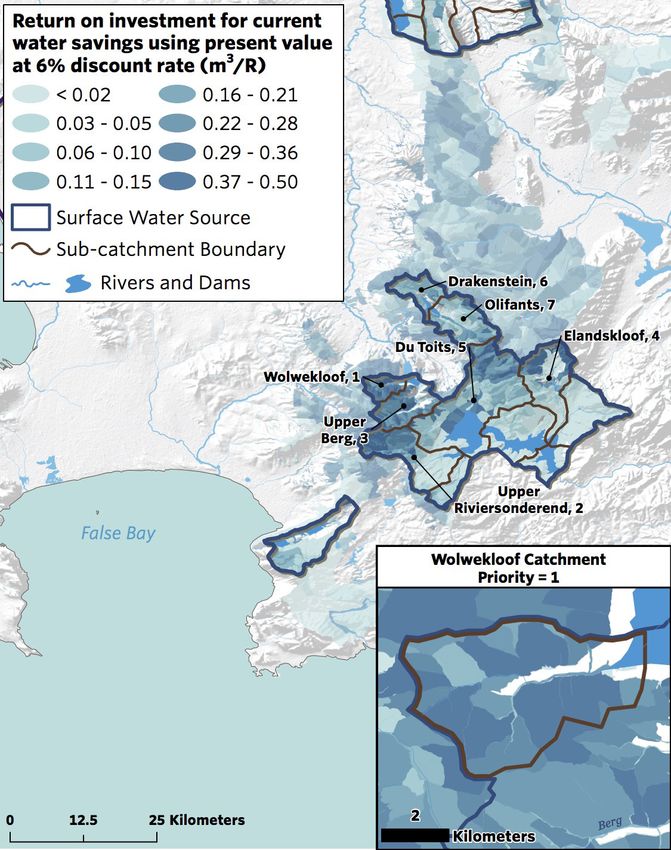
BUSINESS CASE ANALYSIS AND RESULTS
The studies build on a rich body of data on the costs and        the WCWSS. The business case analysis models a 30-year
operational needs for effective invasive alien plant removal,    period, discounting both costs and water gains at 6%
based on longstanding programmes in South Africa, such as        for surface water sub-catchments.
Working for Water.
                                                                 A six-step process was followed to identify priority source
Combined with detailed scientific evidence on the quantities     water sub-catchments for invasive alien plant removal and
of water used by these plants, a robust foundation is in place   to understand the return on investment associated with
to evaluate an investment decision around the impact of          implementing these interventions at scale:
controlling invasive alien plants in the water source areas of

STEP 1
Mapping the current extent of alien plant invasion
Factors contributing to sub-catchment
degradation include agriculture, forestry
plantations, and invasive alien plants. A spatial
analysis revealed widespread invasive alien
plant infestation across over two-thirds (69%)
of the 24 source water sub-catchments in
the WCWSS, with 14,400 hectares (10%) of
that area suffering severe degradation through
dense invasion.

                            Figure 4. Over two-thirds
                               of sub-catchments are
                              invaded by alien plants.

4 | THE GREATER CAPE TOWN WATER FUND BUSINESS CASE SUMMARY
STEP 2
                                                                                          Modeling current and future water loss
                                                                                          due to alien plant invasion
                                                                                          A spatial analysis was conducted to estimate
                                                                                          the reduction in run-off resulting from alien
                                                                                          plant invasions in each of the WCWSS sub-
                                                                                          catchments that supply the major dams:
                                                                                          Wemmershoek, Theewaterskloof Berg River,
                                                                                          Steenbras, and Voëlvlei. A reservoir model
                                                                                          (ResSim) was used to estimate the resulting
                                                                                          reduction in dam yields.

                                                                                          Total current water yield reduction due to
                                                                                          alien plant invasion is estimated at 55 billion
                                                                                          liters (55 Mm3) per year — equivalent to
                                                                                          a two month supply — and is predicted to
                                                                                          more than double in the next 30 years given
                                                                                          projected expansion of alien plant invasions
                                                                                          under a no intervention scenario.

                                                                                          Figure 5. Invasive alien plant density distribution
                                                                                          across the sub-catchments.

  STEP 3
  Estimating the costs per hectare of invasive alien plant control based on local conditions
  A detailed breakdown of capital and operational costs for             involved (Figure 6). Initial control operations are the most
  removal and subsequent long-term control of invasive alien            costly, up to R40,000 per hectare in very dense invasions
  plants was carried out for each sub-catchment, which took             in rugged terrain and riparian areas. Thereafter the cost
  into account local conditions such as terrain and road access,        gradually declines over time as invasive plant density and
  as well as the extent of invasion and the type of species             size decreases following each intervention.

                                  ENVIRONMENT                                                OPERATIONAL                     MANAGEMENT

  GEOGRAPHIC AREAS            SPECIES                     ENVIRONMENT                    TEAM                            MANAGEMENT
  • Map showing the           • Type of species           • Slope of the                 • Wages                         • Project oversight
    area to be cleared                                      area to be cleared           • Protective Clothing           • Administration
                              • Density of invasion
                                                          • Distance from                • Transport                     • Monitoring and
                              • Size of invasive trees
                                                            access point                                                   Evaluation
                                to be cleared                                            • Overheads
                                                          • Accessability –                                              • Transport
                              • Herbicides
                                                            difficulty factor
                                                                                                                         • Overheads
                                                            influencing time
                                                            it will take to
                                                            complete a project

Figure 6. Factors affecting total investment required in invasive alien plant removal.

                                                                                           THE GREATER CAPE TOWN WATER FUND BUSINESS CASE SUMMARY |   5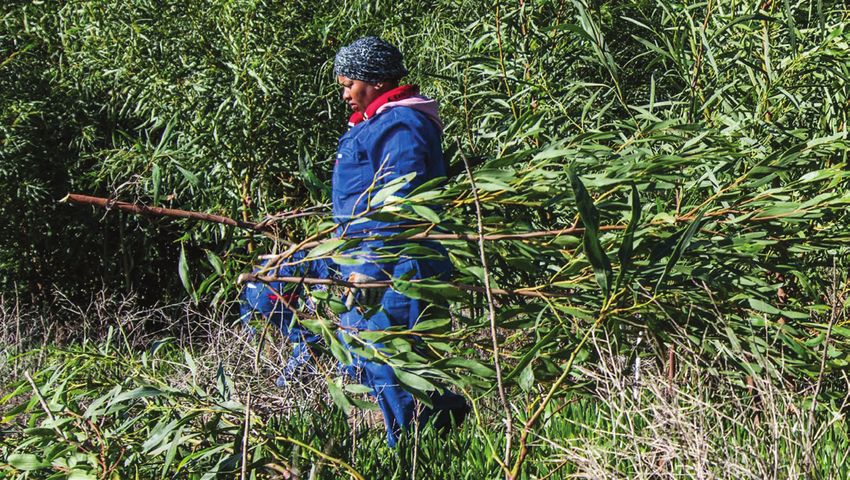
STEP 4
Ranking areas by highest ROI
Sub-catchments were ranked in terms of their
return on investment (ROI); that is, the number of
cubic meters of water generated per rand invested
in invasive plant removal over a 30-year period.

Seven of the 24 sub-catchments were identified
as priorities for invasive alien plant removal.

Those seven sub-catchments comprise a total
of 54,300 hectares, and are the sub-catchments
for Wemmershoek, Theewaterskloof, and Berg
River dams — which supply 73% of the surface
water contribution to the WCWSS. Catchment
restoration here will deliver the highest ROI and
lowest unit reference value (URV). Unit reference
value expresses the cost of each cubic meter (m3) of
water supplied by an intervention. The priority sub-
catchments have a low combined average URV of
R1.2 per m3, which includes water treatment cost.

                                                                                Figure 7. Priority sub-catchments identified for delivering the highest ROI.

                           TIMELINE OF ANNUAL COSTS, WATER YIELD BENEFITS, AND JOBS CREATED

                 120                                                                                                                                  450

                                                                                                                                                      400
                 100
                                                                                                                                                      350
COST AND YIELD

                 80                                                                                                                                   300

                                                                                                                                                      250
                                                                                                                                                               JOBS

                 60
                                                                                                                                                      200

                 40                                                                                                                                   150

                                                                                                                                                      100
                 20
                                                                                                                                                      50

                  0                                                                                                                                   0
                       1    2   3   4   5   6   7   8   9   10   11   12   13   14   15   16   17   18   19 20 21   22 23 24 25 26 27 28 29 30
                                                                                     YEAR

                            Water Yield (Mm3/year)                    Clearing Program Costs (Million Rand, 2018 prices)                      Jobs

Figure 8. Restoration timeline for priority sub-catchments.

6 | THE GREATER CAPE TOWN WATER FUND BUSINESS CASE SUMMARY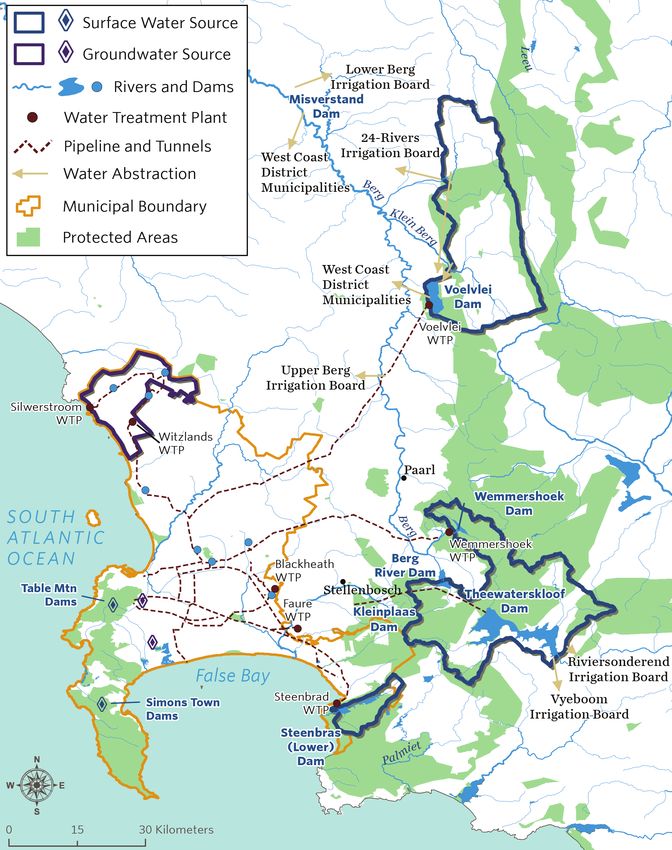
STEP 5
Building discounted restoration timeline for priority sub-catchments
Following common practice, the annual time series of                   Importantly, invasive alien plant removal would yield up to
costs and water yields that the invasive alien plant removal           an additional 56 billion liters (56 Mm3) per year after initial
programme would produce were discounted.                               treatment is completed in year six (Figure 8, previous page).
                                                                       Approximately 350 job opportunities will be created in the
Results show that investing R372 million will generate expected        first five years of implementation, as removing alien plant
annual water gains of 100 billion liters (100 Mm3) within 30           invasions is very labour intensive.
years compared to the business as usual scenario.

STEP 6
Comparing cost per cubic meter (URV) and potential yield gains of restoration programme to alternative water supply options
                                                                       alternatives considered in Cape Town, with a URV only
Catchment restoration is significantly more cost-effective
                                                                       one-eighth that of the combined alternatives (Figure 9).
than other water augmentation solutions, supplying water
                                                                       The results of catchment restoration programmes will
at one-tenth the unit cost of these alternative options.
                                                                       also be evident more rapidly than some of the engineering-
                                                                       intensive, built infrastructure options, with improved
The analysis demonstrated that, including the raw water
                                                                       supply showing as soon as the first winter rains.
treatment cost of R0.8 per cubic meter, catchment
                                                                       Furthermore, catchment restoration produces water
restoration would supply water at two-thirds to less than
                                                                       yield gains into perpetuity if areas cleared of invasive
one-tenth the cost per cubic meter as the other supply
                                                                       alien plants are maintained.

                                       CATCHMENT RESTORATION INCREASES WATER
                                           SUPPLY AT THE LOWEST UNIT COST

Removal of IAPs in 7 Priority Sub-Catchments

                               Desalination

                   Groundwater Exploration

                               Water Reuse

                    Voelvlei Storage Scheme

                   Cease Forestry Steenbras

                                               0      10          20              30              40               50               60

                                         Unit Cost (URV in Rand/m3)                    Additional Water (Mm3/year)

Figure 9. Water supply gain and unit cost (URV) comparison between catchment restoration and other supply options (costs include
raw water treatment cost).

                                                                                        THE GREATER CAPE TOWN WATER FUND BUSINESS CASE SUMMARY |   7
THE ROLE OF THE GREATER CAPE TOWN WATER FUND
Addressing the Greater Cape Town Region’s water                       for systemic change in catchment management by cost
supply challenge is complex. The City of Cape Town                    effective use of on-the-ground resources, strengthened
is the biggest consumer of water and dependent on a                   capacity, and robust monitoring and evaluation. In addition,
range of sub-catchment areas that lie mostly outside                  the Water Fund will stimulate funding and implementation
of the city boundaries. The inter-connected WCWSS                     of catchment restoration efforts and, in the process,
includes multiple users made up of different sectors and              create jobs and momentum to protect globally important
other municipalities, and involves multiple government                biodiversity and build more resilient communities in the
departments at national, provincial, and municipal levels.            face of climate change.
In addition, invasive plant control programmes have
been implemented for many years involving different                   The Greater Cape Town Water Fund builds on the
stakeholders, both public and private, adding to the                  experience of more than 30 other Water Funds
complexity of finding synergy, alignment, and collaboration.          implemented or in development across 12 countries. It is
                                                                      the second of its kind in Africa and the first in South Africa,
The Greater Cape Town Water Fund is bringing together                 pioneering the use of innovative financial and governance
private and public sector stakeholders — alongside local              mechanisms to protect and restore the catchments upon
communities — around the common goal of restoring                     which the Greater Cape Town Region’s economy and
the surface water catchments and aquifers that supply                 livelihoods depend. The Water Fund also serves as a model
our water. The Water Fund aims to support and align                   for establishing water funds elsewhere in the country.
with existing government initiatives and act as a catalyst

Figure 10. The major elements and flows of a Water Fund. A Water Fund is designed to cost-effectively harness nature’s ability to
capture, filter, store, and deliver clean and reliable water. Water Funds have four common characteristics: science-based plans, a
multi-stakeholder approach, a funding mechanism, and implementation capacity.

8 | THE GREATER CAPE TOWN WATER FUND BUSINESS CASE SUMMARY
ADDITIONAL ECOLOGICAL INFRASTRUCTURE
INTERVENTIONS TO SECURE WATER
While the focus of this Business Case is on invasive controlling invasive alien plants in former forestry areas,
plant removal to restore seven priority sub-catchments and restoration of natural vegetation on the Atlantis
supplying the WCWSS, the scope of the Water Fund Aquifer. Preliminary analysis in the Atlantis Aquifer has
will be broader in supporting additional ecological shown that 1.8 billion liters of water (1.8 Mm3) is lost
infrastructure interventions to secure water supply. Efforts annually due to invasive alien plants.
will focus on the restoration of four priority wetlands,
NEXT STEPS
The Greater Cape Town Water Fund Steering Committee components of ecological infrastructure restoration to
will use the results of this study to co-develop with maximise efficiency and effectiveness, especially the
stakeholders an ecological infrastructure restoration clearing of rugged terrain. In addition, the integration of
strategy for the WCWSS focused around the seven fire as a control method will be implemented at scale
priority sub-catchments. Putting the strategic plan in and the results monitored. Operational flexibility will
place will include building the institutional capacity of ensure timely follow up and maintenance of burned areas
the Greater Cape Town Water Fund to lead or support to avoid densification following unplanned fire events.
restoration efforts and creating mechanisms such as Other priorities include the restoration and protection of
an endowment fund to help ensure sustained funding. wetlands upstream from the dams, riparian restoration,
the development of a well-resourced and well-coordinated
The Water Fund will support the development of governance body, and continued monitoring and
differentiated employment models for the various evaluation against targets.
CONCLUSION
The results of this business case demonstrate that restoring (100 Mm3) annually within 30 years. Catchment
the ecological infrastructure of priority sub-catchments restoration is significantly more cost-effective than other
though invasive alien plant removal is a cost-effective water augmentation solutions, supplying water at one-
and sustainable means of augmenting water for the Greater tenth the unit cost of alternative options. The results
Cape Town Region. Spending R372 million (present presented are conservative, meaning gains could be even
value, equivalent to $25.5 million USD) on catchment higher. In addition to security in water supply, catchment
restoration will generate annual water gains of 50 billion restoration brings wider benefits in terms of job creation,
liters (50 Mm3) a year within five years compared to community empowerment, reduced fire risk, the restoration
business as usual — equivalent to one-sixth of the city’s of native fynbos biodiversity, and climate change resilience.
current supply needs — increasing to 100 billion liters
Results show that investing R372 million ($25.5 million USD) will generate annual water gains of 50 billion liters (50 Mm3) a year within
five years compared to business as usual — equivalent to one-sixth of the city’s current supply needs — increasing to 100 billion liters
(100 Mm3) within 30 years.
THE GREATER CAPE TOWN WATER FUND BUSINESS CASE SUMMARY | 9GREATER CAPE TOWN WATER FUND The vision of the Greater Cape Town Water Fund is to ensure healthy and resilient catchments provide sustainable water yields for current and future generations. LEAD AUTHORS CONTRIBUTING AUTHORS EDITOR The Nature Conservancy Anchor Environmental Consultants Yellowbrick Louise Stafford, Daniel Shemie, Timm Jane Turpie and Katherine Forsythe Sonja Mitchell Kroeger, Tracy Baker, Colin Apse WITH SPECIAL THANKS TO Mark Botha, Independent consultant; Gail Cleaver-Christie, CapeNature; Christine Colvin, World Wide Fund for Nature; Peter Flower, City of Cape Town; Professor Graham Jewitt, University of Kwa-Zulu Natal; Gisela Keyser, City of Cape Town; David le Maitre, Council for Scientific and Industrial Research; Kerri Savin, Nedbank; Johan van der Merwe, City of Cape Town; Professor Brian van Wilgen, Stellenbosch University GENEROUS SUPPORTERS STEERING COMMITTEE PUBLIC PARTNERS PHOTO CREDITS: Cover: LieselK; inside cover (clockwise from top): Quality Master, Martin Mecnarowski, Roshni Lodhia, Alexcpt_photography; p. 2: Mark Fisher; p. 4 (l-r): Roshni Lodhia, PhotoSky; back cover: Andrew M. Allport. LAND COVER SOURCE: Western Cape Nature Conservation Board (WCNCB), Scientific Services. 2014 CONTACT: Louise Stafford, South Africa Water Funds Director, TNC | Telephone: +27 21 201 7391 | Email: Louise.Stafford@TNC.org | nature.org/cape-town-water This business case is informed by studies by Anchor Environmental Consultants, Freshwater Research Centre, and Mark Botha.
You can also read