2021 Water Quality Report - Glasgow Water Company
←
→
Page content transcription
If your browser does not render page correctly, please read the page content below
2021 Water Quality Report
Glasgow Water Company - Water Testing Performed in 2020
PWS ID# KY0050929
Water Quality Report
This report is designed to inform the public about the quality of water and services provided by
the Glasgow Water Company (GWC). The GWC operates a State Certified Microbiology Labora-
tory staffed with Class IV Water Treatment Plant Operators and Lab Analysts. Our experienced
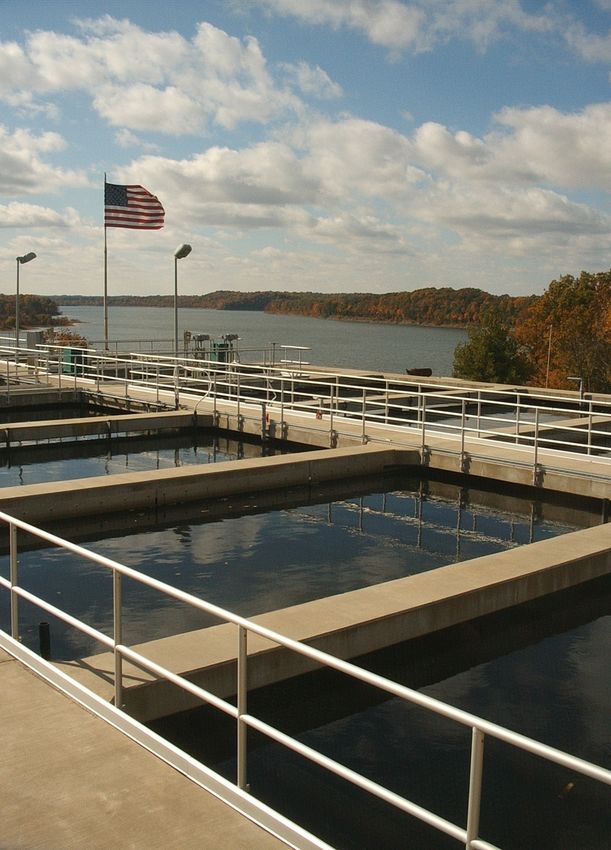
Barren River Lake Water Treatment Plant, Lucas KY
and accredited personnel analyze tests on water samples 365 days a year to assure water safety
and quality. These samples are taken from the treatment process as well as from various sites
within the distribution system. We would like the public to be assured that we will continue to
monitor, improve, and protect the water system and deliver a high quality product direct to the
tap.
The GWC is a municipal water and wastewater utility that provides service to approximately
20,000 water connections, 7,500 sewer connections, and 5 regional water utilities (Allen County
Water District, Caveland Environmental Authority, Edmonton Water Works, Fountain Run Water
District, and Green River Valley Water District). The GWC is the 10th largest water producer in
the State of Kentucky and has a service area that encompasses 444 square miles while maintain-
ing 901 miles of water mains and 151 miles of sewer mains. On average, GWC operations treat
over 3.1 billion gallons of water and 1.1 billion gallons of waste water annually.
Water Treatment Plant Operations Receives 15th Consecutive AWOP Award
GWC’s award winning performance earned U.S. Environmental Protection Agency (EPA) program recognition for
achieving exceptional drinking water quality through optimized filtration plant performance. This is the 15th
consecutive year the GWC has achieved the Area-Wide Optimization Program (AWOP) designation by surpassing
state and federal water quality standards. In the Spring of 2020, the GWC also received the Microbial AWOP
Champions Award and AWOP Longevity Award presented by the Kentucky Energy and Environment Cabinet, Division
of Water. Naturally, our staff is critical to our success and our community is fortunate to have dedicated profession-
als working to ensure that water and wastewater services remain affordable and of extremely high quality. It is our
people that make us an industry leader and an organization for which our customers and community can be proud.
Water Source Information
The GWC operates two water treatment plants, both treating
surface water. They are the Barren River Lake Water Treatment
Plant (source plant A) located in Lucas, and the Beaver Creek
Water Treatment Plant (source plant B) located north of Glas-
gow. The Barren River Lake Water Treatment Plant’s raw water
source is Barren River Lake while the Beaver Creek Water Treat-
ment Plant draws raw water from Beaver Creek.
A source water assessment has been completed. The Barren
River Lake has one KPDES permitted discharger, an under-
ground storage tank, agricultural chemical users and oil and gas
Visit glasgowh2o.com and click on
wells that could be possible sources of contamination. The Bea-
ver Creek Plant has two bridges, several oil and gas wells, one Notifications tab to sign up to receive
KPDES permitted discharger, an underground storage tank and important notifications via text or
agricultural chemical users upstream and in proximity of its in- email. If you do not have internet
take. The final source water assessment with the system’s sus- access or need assistance contact us
ceptibility to potential sources of contamination is available for at 270-651-3727.
review at the Barren River Area Development District (BRADD)
office located at 177 Graham Avenue, Bowling Green, Kentucky.
Spanish (Español) - Este informe contiene información muy importante sobre la calidad de su agua beber. Tradúzcalo o hable con alguien que lo entienda bien.
Regulated Contaminants in                                                Secondary Contaminants
the Water Supply                                                         Secondary Contaminants do not have a direct impact on the health
                                                                         of consumers and are not required in this Water Quality Report.
The sources of drinking water (both tap water and bottled water)         They are being included to provide additional information about the
include rivers, lakes, streams, ponds, reservoirs, springs, and wells.   quality of your drinking water. The data displayed below represents
As water travels over the surface of the land or through the ground,     the highest value from either source plant A or B.
it dissolves naturally occurring minerals and, in some cases, radioac-
tive material, and may pick up substances resulting from the pres-       Secondary Contaminant        Maximum Allowable Level            Report Level
ence of animals or from human activity.
                                                                          Copper                                1.0 ppm                     0 ppm
In order to ensure that tap water is safe to drink, EPA prescribes
                                                                          Iron                                  0.3 ppm                     0 ppm
regulations that limit the amount of certain contaminants in water
provided by public water systems. FDA regulations establish limits        Zinc                                      5 ppm                   0 ppm
for contaminants in bottled water to provide the same protection for      Manganese                            0.05 ppm                     0 ppm
public health.
                                                                          Silver                                0.1 ppm                     0 ppm
Drinking water, including bottled water, may reasonably be expected
                                                                          Total Dissolved Solids                500 ppm                    109 ppm
to contain at least small amounts of some contaminants. The pres-
ence of contaminants does not necessarily indicate that water poses
                                                                                                      Maximum Allowable Level            Report Level
a health risk. More information about contaminants and potential
health effects may be obtained by calling the Environmental Protec-       pH                                   6.5 to 8.5                    7.17
tion Agency's Safe Drinking Water Hotline 1-800-426-4791.

Contaminants that may be present in source water include:                Fluoride Regulation (added for dental health)
Microbial Contaminants. Examples include viruses and bacteria that
                                                                         Kentucky statute (902 KAR 115:010) requires water treatment plants
may come from wildlife, agricultural livestock operations, septic sys-
                                                                         to dose fluoride within a range between 0.6 to 1.2 ppm. GWC’s goal
tems, and waste water treatment plants.
                                                                         is to maintain a 0.8 ppm residual at all times to ensure compliance
Inorganic Contaminants. Examples include salts and metals, that          with Kentucky regulations while keeping an operating tolerance on
can be naturally occurring or result from storm water runoff, indus-     the low range of the scale.
trial or domestic wastewater discharges, oil and gas production, min-
ing or farming.                                                                                                             Average Range of Detection

Pesticides and Herbicides. These may come from a variety of              Fluoride (added for dental health) (ppm)             0.8       0.67 to 0.96
sources such as agriculture, storm water runoff, and residential use.

Organic Chemical Contaminants. These include synthetic and vola-         Water Hardness
tile organic chemicals, which are by-products of industrial processes    Water hardness is the amount of dissolved minerals, largely calcium
and petroleum production, and can also come from gas stations,           and magnesium, in the water. There is no MCL for water hardness.
storm water runoff, and septic systems.                                  Water hardness is expressed as grains of hardness per gallon of
Radioactive Contaminants. These can be naturally occurring or be         water (gpg) or parts per million (ppm).
the result of oil and gas production and mining activities.
                                                                               Total Hardness              Avg gpg                      Avg ppm
Total Coliform. Coliforms are bacteria that are naturally present in
the environment and are used as an indicator that other, potentially-              Plant A                   5.75                        98.25
harmful, bacteria may be present.                                                  Plant B                   9.85                        168.4
E.Coli. E. coli are bacteria whose presence indicates that the water
may be contaminated with human or animal wastes. Microbes in
these wastes can cause short-term effects, such as diarrhea, cramps,                            HOME PLUMBING AND LEAD
nausea, headaches, or other symptoms. They may pose a special              If present, elevated levels of lead can cause serious health problems,
health risk for infants, young children, some of the elderly, and peo-     especially for pregnant women and young children. Lead in drinking
ple with severely compromised immune systems.                              water is primarily from materials and components associated with
Turbidity. Turbidity has no health effects. Turbidity can interfere        service lines and home plumbing. GWC is responsible for providing
with disinfection and provide a medium for microbial growth. Tur-          high quality drinking water, but cannot control the variety of materi-
                                                                           als used in plumbing components. When your water has been sitting
bidity may indicate the presence of disease-causing organisms
                                                                           for several hours, you can minimize the potential for lead exposure
(bacteria, viruses, and parasites).
                                                                           by flushing your tap for 30 seconds to 2 minutes before using water
                                                                           for drinking or cooking. If you are concerned about lead in your wa-
                                                                           ter, you may wish to have your water tested. Information on lead in
                                                                           drinking water, testing methods, and steps you can take to minimize
                                                                           exposure is available from the Safe Drinking Water Hotline 1-800-
                                                                           426-4791 or at www.epa.gov/safewater/lead.
                                                                           If you have questions about lead in drinking water or wish to obtain
                                                                           information concerning lead, specifically related to the GWC water
                                                                           distribution system or our testing program, please call us at 270-651-
                                                                           3727.
Regulated Contaminant Test Results
The data presented in this report is from the most recent testing performed in accordance with administrative regulations in 401 KAR Chapter 8. As au-
thorized and approved by EPA, the State has reduced monitoring requirements for certain contaminants to less often than once per year because the
concentrations of these contaminants are not expected to vary significantly from year to year. Some of the data in this table, though representative, may
be more than one year old. Source “A” is the Barren River Lake Water Treatment Plant and Source “B” is the Beaver Creek Water Treatment Plant.
Maximum Contaminant Levels (MCL’s) are set at very stringent levels. To understand the possible health effects described for many regulated
contaminants, a person would have to drink 2 liters of water every day at the MCL level for a lifetime to have a one-in-a-million chance of
having the described health effect.

                                                                Source
Contaminant                                                                Highest Single        Lowest Monthly
                                      Allowable Levels                                                               Violation   Likely Source of Contamination
 [code] (units)                                                            Measurement                 %

Turbidity (NTU) TT             No more than 1 NTU*              A              0.094                     100
* Representative Samples       Less than 0.3 NTU in 95%                                                                NO        Soil runoff
of filtered water              of monthly samples               B              0.158                     100
                                                    Source

Contaminant                                                   Report                                       Date of
                                MCL        MCLG                               Range of Detection                     Violation   Likely Source of Contamination
[code] (units)                                                 Level                                       Sample

Inorganic Contaminants
Barium                                              A          0.016            0.016 to 0.016                                   Drilling wastes; metal refineries;
[1010] (ppm)
                                  2          2                                                             Feb-20      NO        erosion of natural deposits
                                                    B          0.021            0.021 to 0.021
Fluoride                                            A           0.77             0.77 to 0.77                                    Water additive which promotes
[1025] (ppm)
                                  4          4                                                             Feb-20      NO        strong teeth
                                                    B           0.94             0.94 to 0.94
Nitrate                                             A           1.69             1.69 to 1.69                                    Fertilizer runoff; leaching from septic
[1040] (ppm)
                                 10          10                                                            Feb-20      NO        tanks, sewage; erosion of natural deposits
                                                    B           1.56             1.56 to 1.56
Disinfectants/Disinfection Byproducts and Precursors
Total Organic Carbon (ppm)                          A           1.74             1.39 to 2.12
(report level = lowest avg.     TT*         N/A                                                             2020       NO        Naturally present in environment
range of monthly ratios)                            B           1.96             1.09 to 3.22

*Monthly ratio is the % TOC removal achieved to the % TOC removal required. Annual average of the monthly ratios must be 1.00 or greater for compliance.
                                                               1.30
Chlorine                       MRDL MRDLG
                                                             (highest            0.27 to 2.15               2020       NO        Water additive used to control microbes
(ppm)                           =4   =4
                                                             average)

HAA (ppb) (Stage 2)                                              34               22 to 40
[Haloacetic acids]
                                 60         N/A
                                                             (high site)   (range of individual sites)
                                                                                                            2020       NO        Byproduct of drinking water disinfection

TTHM (ppb) (Stage 2)                                             42               19 to 63
[Total trihalomethanes]
                                 80         N/A
                                                             (high site)   (range of individual sites)
                                                                                                            2020       NO        Byproduct of drinking water disinfection

Household Plumbing Contaminants
Copper [1022] (ppm)                                            0.073
                                AL =                                                                                             Corrosion of household plumbing
Sites exceeding action level
                                 1.3
                                             1.3               (90th           0.0033 to 0.197             Jul-19      NO        systems
              0                                              percentile)
Lead [1030] (ppb)                                                0
                                AL =                                                                                             Corrosion of household plumbing
Sites exceeding action level
                                 15
                                             0                 (90th                0 to 2                 Jul-19      NO        systems
              0                                              percentile)

Radioactive Contaminants
Alpha emitters                                      A           2.73             2.73 to 2.73
[4000] (pCi/L)
                                 15          0                                                             Jan-20      NO        Erosion of natural deposits
                                                     B          2.04             2.04 to 2.04
Combined radium                                     A          0.557            0.557 to 0.557
(pCi/L)
                                  5          0                                                             Jan-20      NO        Erosion of natural deposits
                                                     B         0.674            0.674 to 0.674

Additional copies of this Water Quality Report are available at our main office located at 301 West Main Street or by visiting our website at www.glasgowh2o.com.
If you have any questions about the information contained within this report, please contact Scott Young, General Manager, or Tim Smiley, CCR Contact, at 270-651-
3727. The Glasgow Water and Sewer Commission’s regular monthly meetings are held on the second Thursday of each month at 3:00 P.M. CST at the Glasgow
Water Company office located at 301 West Main Street.
Water Quality Data
In the Water Quality Data Table, you may find terms or abbreviations that are unfamiliar.
                                                                                                Customer Service
To help you better understand the results, the following definitions are provided. Some or      Regular Business Hours:
all of these definitions may be found in this report:
                                                                                                Monday - Friday, 8:00 a.m. - 4:30 p.m.
MCL = Maximum Contaminant Level - The highest level of a contaminant that is allowed
                                                                                                Service, Billing, Emergencies:
in drinking water. MCLs are set as close to the MCLGs as feasible using the best available
treatment technology.                                                                           (270) 651-3727
MCLG = Maximum Contaminant Level Goal - The level of a contaminant in drinking water
below which there is no known or expected risk to health. MCLGs allow for a margin of           Bill Payment Options
safety.
TT = Treatment Technique - A required process intended to reduce the level of a contami-
nant in drinking water.
AL = Action Level - The concentration of a contaminant which, if exceeded, triggers treat-
ment or other requirements that a water system shall follow.
Turbidity = A measure of the clarity of water. Turbidity has no health effects. However,
turbidity can provide a medium for microbial growth. Turbidity is monitored because it is
a good indicator of the effectiveness of the filtration system.
NTU = Nephelometric Turbidity Unit - Measures cloudiness of water.                                    www.glasgowh2o.com
MRDL = Maximum Residual Disinfectant Level - The highest level of a disinfectant allowed
in drinking water. There is convincing evidence that addition of a disinfectant is necessary    By Phone:
for control of microbial contaminants.                                                          (270) 651-3727
MRDLG = Maximum Residual Disinfectant Level Goal - The level of a drinking water disin-
fectant below which there is no known or expected risk to health. MRDLGs do not reflect
                                                                                                In Person, Drive Thru or Drop Box (After hours):
the benefits of the use of disinfectants to control microbial contaminants.                     GWC Office, 301 West Main Street, Glasgow, KY 42141
BDL = Below Detection Levels - Laboratory analysis indicates that the contaminant is not        By Mail:
present.
                                                                                                P.O. Box 819, Glasgow, KY 42142-0819
ND = Not Detected - Indicates that the substance was not found by laboratory analysis.
Range of Detection = This is the lowest and highest levels of detection.                        Local Banks (Payment Drop Off):
N/A = Not Applicable - Does not apply.                                                          •BB&T •Edmonton State Bank •German American Bank
ppm = Parts per million - Milligrams per liter, (mg/L) - Corresponds to one penny in $10,000.
                                                                                                •Limestone Bank •Monticello Bank •Peoples Bank
ppb = Parts per billion - Micrograms per liter, (µg/L) - Corresponds to one penny in
$10,000,000.                                                                                    •South Central Bank •US Bank
TOC = Total Organic Carbon - Measure of the total amount of organic matter in water.            ACH (Automatic Bank Draft):
                                                                                                Payment is automatically deducted from your check-
                      NOTICE: IMPORTANT INFORMATION                                             ing or savings account on your due date.
 Some people may be more vulnerable to contaminants in drinking water than the
 general population. Immuno-compromised persons such as persons with cancer
 undergoing chemotherapy, persons who have undergone organ transplants,
 people with HIV/AIDS or other immune system disorders, some elderly, and
                                                                                                                  OUR MISSION:
 infants can be particularly at risk from infections. These people should seek                    To provide the highest quality water and wastewater
 advice about drinking water from their health care providers. EPA/CDC guidelines                 services at the lowest possible cost, while continuing
                                                                                                      our commitment to meet the needs of today’s
 on appropriate means to lessen the risk of infection by Cryptosporidium and                            customers as well as future generations.
 other microbial contaminants are available from the Safe Drinking Water Hotline
 800-426-4791. Another Source for information on water quality is the Kentucky
 Division of Water’s website: www.water.ky.gov/dw/
                                                                                                           Board of Commissioners:
                       Accomplishments                                                                           Jerry Botts, Chairman
                                                                                                           Buddy Underwood, Vice Chairman
                       2006-2020 USEPA Area Wide Optimization Program (AWOP)
                       recognition – Kentucky Energy and Environment Cabinet (KYEEC).                 Woodford Gardner, JR., Secretary-Treasurer
                                                                                                           Harold Armstrong, Mayor-Member
                       2020, 2018, & 2012 Kentucky’s Best Tasting Water Award –
                                                                                                       Marna Kirkpatrick, Council Representative
                       Kentucky Rural Water Association.
2019 & 2018 Microbial AWOP Champion Award – KYEEC.                                                            Management Team:
                                                                                                             Scott Young, General Manager
2019 AWOP Longevity Award – KYEEC.
                                                                                                   Jeffrey Reed, Finance/Customer Service Manager
2019 Best of the Best Tap Water Taste Test – American Water Works Association (AWWA),               Billy Carver, Water System Operations Manager
Kentucky/Tennessee Section.
                                                                                                 Patrick Young, Collection System Operations Manager
2018 Excellence in Energy Leadership Award – KYEEC.                                                   Bryan Crabtree, Maintenance Superintendent
2018 Environmental Project of the Year – American Public Works Association of Kentucky.                     Tim Smiley, WTP Superintendent
                                                                                                        Jacob Billingsley, WWTP Superintendent
2018 Engineering Excellence Grand Award – American Council of Engineering Companies
of Kentucky (ACEC).                                                                                    Lance Crimmins, Safety and Risk Manager

2017 Wastewater Treatment Plant of the Year – Kentucky Water and Wastewater Opera-                Water Treatment Plant Quality Team:
tor’s Association (KWWOA).                                                                                  Tim Smiley, WTP Superintendent
2016 Governor’s Safety and Health Award – Kentucky Labor Cabinet.                               Cody Richardson, Quality Control Manager/Chief Operator

2015 Water Treatment Plant of the Year – KWWOA.                                                              Lee Hammer, Chief Operator
                                                                                                 Wesley Wilson, Microbiology Lab Director/ IV Operator
2014 Wooden Bucket Award – Kentucky Rural Water Association.
You can also read