Greece Country Health Profile - State of Health in the EU Conference on the Future of Healthcare in Greece, Athens, 22 March 2018 - OECD.org

Page created by Jerome Newman
 
CONTINUE READING
Greece Country Health Profile - State of Health in the EU Conference on the Future of Healthcare in Greece, Athens, 22 March 2018 - OECD.org
State of Health in the EU

Greece Country Health Profile

Conference on the Future of Healthcare in Greece, Athens, 22 March 2018
Greece Country Health Profile - State of Health in the EU Conference on the Future of Healthcare in Greece, Athens, 22 March 2018 - OECD.org
1 Country Health Profiles
1. Highlights
2. Health status of the population
3. Risk Factors
4. Health System (description)

5. Performance of Health System

  5.1 Effectiveness
  5.2 Accessibility

  5.3 Resilience (efficiency & sustainability)

6. Key Findings

 Released in November 2017 (in English and native language)
 This presentation focuses on sections highlighted in bold
Greece Country Health Profile - State of Health in the EU Conference on the Future of Healthcare in Greece, Athens, 22 March 2018 - OECD.org
What are the trends in the health status
    of the population in Greece?
Greece Country Health Profile - State of Health in the EU Conference on the Future of Healthcare in Greece, Athens, 22 March 2018 - OECD.org
Life expectancy in Greece has increased less rapidly than in many other EU countries
         Only ½ year higher now than EU average, 2 years lower than in Spain and Italy
                                                                                                                                                                 Yea rs
                                                                                                                                                                                    Spain   Greece          EU
                                                                                                                                                                84

                                                                                                                                                                82

                                                                                                                                                                80
     Yea rs (in 2015)
84
     83.0                                                                                                                                                       78
            82.7
                   82.4 82.4 82.2
                                    81.9 81.8
82                                              81.6 81.6 81.5                                                                                                  76
                                                                 81.3 81.3 81.1 81.1
                                                                                       81.0 80.9 80.8
                                                                                                        80.7 80.6
                                                                                                                                                                74
80
                                                                                                                    78.7                                        72
                                                                                                                           78.0
78                                                                                                                                77.5 77.5                     70
                                                                                                                                              76.7

                                                                                                                                                     75.7
76
                                                                                                                                                            75.0 74.8
                                                                                                                                                                        74.7 74.6

74

72

70

                                                                                                                                                                                                     Source: Eurostat Database.
People live longer, but less than half of remaining years of life at age 65
                         is free of health problem and disability

             Healthy life expectancy                        Unhealthy life expectancy                       Number of working-age people (15-64) per person aged 65+

  Greek men at 65                  7.9                       10.6                   18.5

Greek women at 65                  7.5                               13.8                   21.3

                        0                5             10             15              20               25
                                                                                        Years

   Note: Healthy life expectancy: Number of years that people can expect to live free of disability.
   Source: Eurostat Database (data refer to 2015).

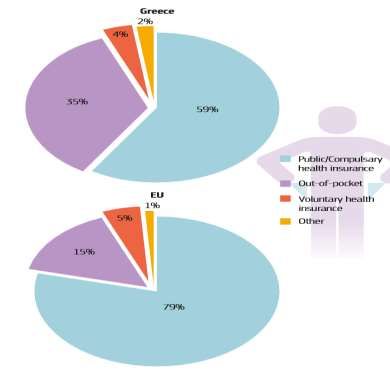
    Population ageing will increase the needs for health and long-term care,
     while there will be fewer working-age people to respond to these needs
How to ensure universal access to
 health care in a context of population
    ageing, now and in the future?

(Access = Affordability + Accessibility to services)
The 2016 Law to provide minimum public health insurance coverage for all the
        population has been an important step towards universal health coverage
      Before, 2016, Greece was lagging behind nearly all                         And a growing proportion of poor people was
      EU countries in health insurance coverage…                                 reporting unmet health care needs due to cost
                  Total public coverage      Primary private health coverage
                      Croatia                           100.0
             Czech Republic                             100.0
                    Denmark                             100.0
                                                                                % of population             Poorest income quintile
                      Finland                           100.0                   20
                       Ireland                          100.0                                               Richest income quintile          17.4
                          Italy                         100.0                   18                                                    16.4
                        Latvia                          100.0
                    Lithuania                           100.0                   16
                         Malta                          100.0                                                               13.9
                     Portugal                           100.0
                                                                                14
                     Slovenia                           100.0
                     Sweden                             100.0                                                       11
                                                                                12                         10.1
             United Kingdom                             100.0
                       Austria                           99.9
                                                                                10
                       France
                                                                                              8.4
                                                         99.9                                       7.8
                         Spain                          99.1              0.8          7
                                                                                8
                    Germany                    88.9               10.9
                 Netherlands                             99.8
                     Belgium                            99.0
                                                                                6
                Luxembourg                            95.9                                                 3.3                                2.8
                     Hungary                         95.0
                                                                                4                                   2.2
             Slovak Republic                        94.2                              0.9     0.6   0.8
                      Estonia                       93.9
                                                                                2                                           0.2        0
                       Poland                     91.3
              Bulgaria (2013)                  88.2
                                                                                0
                    Romania                  86.0                                    2008    2009   2010   2011    2012    2013       2014   2015
               Greece (2015)                 86.0
               Cyprus (2013)              83.0

                                  70            80          90          100
                                                  % of population in 2015
Source: OECD (Health a t a Glance: Europe 2016).                                                                    Source: Eurostat (EU-SILC).
But it is also important to consider the comprehensiveness of health
insurance coverage: what is covered and what proportion is covered?
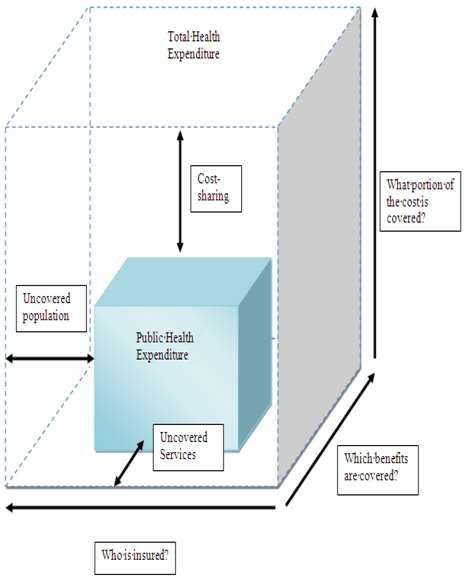
                                     Only about 60% of health spending in Greece is
                                   publicly funded, compared with about 80% in the EU

                                              Source: OECD Health Statistics (data refer to 2015).
Effective access to care also needs to address other barriers beyond coverage
  Many Greek people report having difficulties accessing doctors or a health centre not only because of cost,
   but also because of distance to the doctor’s office and waitings to get an appointment and see a doctor

                                                     Italy   Spain EU               Portugal           Greece
   Distance to doctor’s
                 office                0%                            20%                             40%                         60%

                                             Spain             EU     Italy   Portugal                                             Greece
 Cost of seeing doctor
                                       0%                            20%                             40%                         60%

                                                                           Spain   Italy        EU                Portugal     Greece
         Delay in getting
           appointment                 0%                            20%                             40%                         60%

                                                                                    Italy Spain        EU          Portugal         Greece
 Waiting time to see a
    doctor on the day                  0%                            20%                             40%                         60%

 Response to the question: “Thinking about the last time you needed to see or be treated by a GP, family doctor or health centre, to what extent
 did any of the following make it difficult or not for you to do so?” (% of respondents answering “very difficult” or “a little difficult”).
 Source: Eurofound (European Quality of Life Survey 2016).
The main problem is not a lack of doctors, but a lack of generalists, the uneven
      geographic distribution of doctors, and the lack of doctors in public facilities

                                                                                                                                      Generalists,
                                                                                                                                         6%

                                                                                                                           Other doctors
                                                                                                                           (not defined),
                                                                                                                                19%

                                                                                                                                                                             Specialists,
                                                                                                                                                                                75%

                                                                                                            Greece

Note: In Portugal and Greece, data refer to all doctors licensed to practice, resulting in a large over-estimation of practising doctors (e.g. of around 30% in Portugal).
       In Austria and Greece, the number of nurses is under-estimated as it only includes those w orking in hospital.
Sources: Eurostat Database and Health at a Glance 2017.
Primary Care Plan launched in 2017 is another step in the right direction
• Creating an effective network of primary care services is one of the most urgent
  priorities to respond effectively to the needs of (ageing) population and reduce
  over-crowding of emergency departments and unnecessary hospital admissions

• Other EU countries can provide some inspiration to strengthen primary care:
    •   Portugal: Since 2007, a growing number of Family Health Units based on multi-
        professional teams (with 3-8 GPs and same number of nurses) responsible for
        delivering primary care to around 12000 people each (about 500 FHUs now)

• But there is probably “no one fits all” solution, and various primary care
  models probably need to coexist and continue to evolve over time

• The success of the primary care reform in Greece will likely depend on:
     Having sufficient financial resources to support creation and development
     Supporting innovative ways to deliver services effectively (e.g. telemedecine)
     Coordinating effectively the various primary care units (regional authorities)
Universal and fairly comprehensive health coverage can be fiscally
                    sustainable in Greece, provided that…

 Efforts continue to reduce waste in health spending to ensure
that resources are used effectively to respond to changing needs
and ensure continued support for publicly-funded system

The revenue base to finance public spending on health is
broadened to rely less on payroll taxes to raise sufficient
resources to meet future needs
Wasteful spending can occur at all levels of the system for many reasons

                Patient
                                                      Ineffective/inappropriate (low value) care
                                                                                                        Wasteful
                                                              Duplication of services
                                                                                                        clinical care
                                                           Preventable adverse events
               Clinician
   Actors

                                                           Paying an excessive price
                                                          Discarding unused inputs                     Operational waste
              Manager                                 Overusing high-cost inputs (e.g. hospitals)

                                                                                                       Governance-related
                                                      Ineffective administrative procedures
                                                                                                       waste
              Regulator                               and expenditure

                                            Errors & poor               Poor                       Poor            Fraud and
                Drivers
                                            decisions                   organisation               incentives      corruption
Source: OECD, Tackling Wasteful Spending on Health.
                                                              Unintentional                                 Intentional
Despite many recent efforts to reduce hospital and pharmaceutical cost, most health
  spending in Greece continues to be allocated for these two big spending items
                              %
                                    Inpatient care        Outpatient care     Long-term care        Medical goods    Collective services
                              100                                                                          4
                                    5                8             6           7                                     5                5
                                                                                               9
                              90                                                                                                     12
                                                                                                           20
                                                                   21         19               14                    22
                                    28               20
                              80
                                                                                                           2
                              70                                                               18                    9               26
                                                                   10         15
                                    2                12
A relatively small share of   60
spending is allocated to
                                    25
outpatient care and long-     50
                                                     26            31
                                                                                                           48
                                                                              30               30                    38
term care                     40                                                                                                     34

                              30

                              20    40
                                                     33            32         30               29          26        26
                              10                                                                                                     23

                               0

                                                          Note: Countries are ranked by inpatient care as a share of health expenditure .
                                                          Source: OECD Health Statistics 2017 and Eurostat Database (data refer to 2015).
A lot of efforts have been made in recent years to reduce pharmaceutical spending
                                              Introduction of prescription guidelines,
                                              coupled with country-wide prescription
                                              system to monitor doctors’ prescribing and
Million (€)                                   pharmacies’ dispensing
                                                                                Introduction of reference pricing for
7 000                                                                           branded drugs based on the three lowest
                                                                                EU prices and setting a maximum pricing
6 000
                                                                                level for generics
5 000                                                                                              Promoting use of generics in pharmacies and
4 000
                                                                                                   hospitals (although there is still room for
                                                                                                   further progress)
3 000

2 000                                                                                                  Share of generic market (in volume, 2015)
1 000                                                                                             %
                                                                                                 100
     0
      2005    2006   2007    2008    2009    2010    2011    2012     2013    2014     2015       75

                                                                                                  50

                                                                                                  25

                                                                                                   0

      Note: The dotted line between 2007 and 2009 indicates estimates to fill missing data.
      Source: OECD Health Statistics 2017.
Broadening the revenue base to pay for growing public spending on health

• Payroll taxes have historically been the main source of public funding
  in social health insurance systems, but:
     Rationale to rely on employee and employer contributions is reduced when
      health insurance coverage becomes universal (not linked to employment status)
     Excessive reliance on payroll taxes reduces incentives for people to work and
      employers to recruit (negative impact on employment)
     May not provide sufficient revenue base to respond to future health care needs
      given demographic changes (shrinking size of working-age population)

• In France, recent tax reform (since 1 January 2018) eliminated employee
  contributions for health care and replaced it by increase in a more general
  taxation covering broader revenue sources (capital gains, pensions, others)

• But tax reforms are never easy to implement (there are “winners” and “losers”)
Key Findings from Greek Country Health Profile
• Life expectancy has continued to increase in Greece, but population ageing
  will continue to add pressures on health and long-term care systems
• Despite difficult economic and budgetary context, recent important
  reforms have started to address many barriers to access to care:
     The 2016 Law has been an important step forward to provide minimum health
      insurance coverage to previously uninsured people
     The 2017 Primary Care plan has started to address an urgent priority to
      strengthen access to primary care, but successful implementation will require
      sufficient funding over several years and innovative ways to deliver primary care
      services efficiently for the whole population
• Looking forward, universal and fairly comprehensive health coverage can be
  financially sustainable, provided that efforts continue to be made to reduce
  wasteful health spending and the revenue base to finance public spending
  on health continues to be broadened
For more information on State of Health in the EU

                                 ec.europa.eu/health/state
               oecd.org/health/health-systems/country-health-profiles-EU.htm
   euro.who.int/en/about-us/partners/observatory/publications/country-health-profiles-EU
You can also read