GREEN BOND INVESTOR PRESENTATION - August 2021 - NIBC Bank
←
→
Page content transcription
If your browser does not render page correctly, please read the page content below

GREEN BOND
INVESTOR PRESENTATION

August 2021

                        1
TABLE OF CONTENTS

       INTRODUCING NIBC

       SUSTAINABILITY AT NIBC

       GREEN BOND FRAMEWORK

       NIBC CREDIT PROFILE

       CONTACT DETAILS & EXTERNAL LINKS
                                          2
INTRODUCING NIBC

                   3
INTRODUCING NIBC
Our business model

 CORPORATE CLIENT OFFERING                              RETAIL CLIENT OFFERING
 ■ Focus on mid-market corporate clients                ■ Mortgages ranging from owner occupied, buy-to-let,
                                                        both own book and Originate-to-Manage
 ■ Focus on specific sectors and product solutions,
 ranging from advice and structuring to financing and   ■ Mortgage origination for institutional investors
 investments
                                                        ■ Online savings
 ■ Using both own balance sheet and Originate-to-
                                                        ■ Brands: NIBC Direct, Lot Hypotheken, Hypinvest
 Manage concepts
                                                        Hypotheek, NIBC Vastgoed Hypotheek, Lendex
 ■ Growth engines, such as leasing, originating more
                                                        EUR 18.8 billion client exposures
 granular exposures in niche markets
                                                        Typical ticket size: EUR 0.1 - 2.5 million
 ■ Brands: NIBC, OIMIO, Beequip, yesqar
 EUR 9.5 billion client exposures
 Typical ticket size: EUR 0.1 - 50 million

                                                                                                             4
INTRODUCING NIBC
Our markets – Focus on north-western Europe

       Netherlands (The Hague)
   1   EUR 18,742 million Retail exposure
       EUR 5,667 million Savings
       EUR 6,836 million Corporate exposure
       656 FTE                                        1
                                              4
       Germany (Frankfurt am Main)
                                                  3
   2   EUR 11 million Retail exposure
                                                          2
       EUR 3,681 million Savings
       EUR 1,387 million Corporate exposure
       47 FTE
       Belgium (Brussels)
   3
       EUR 1,136 million Savings
       6 FTE
       United Kingdom (London)
   4   EUR 1,234 million Corporate exposure
       24 FTE

                                                              5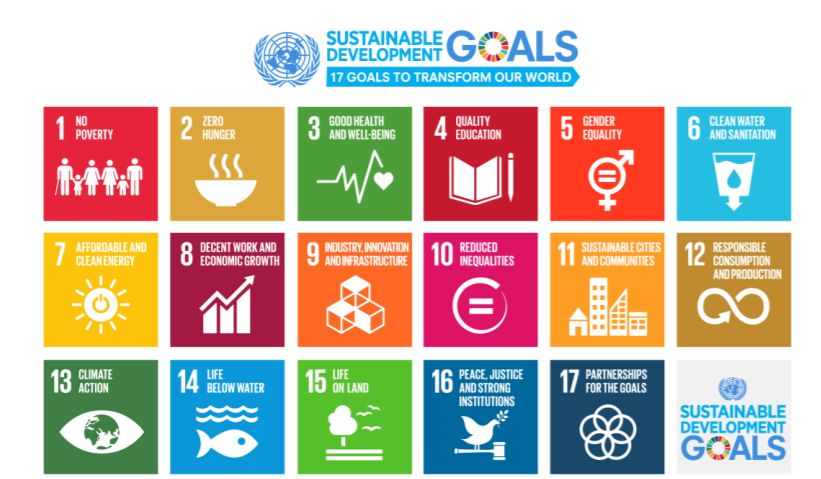
SUSTAINABILITY AT NIBC

                         6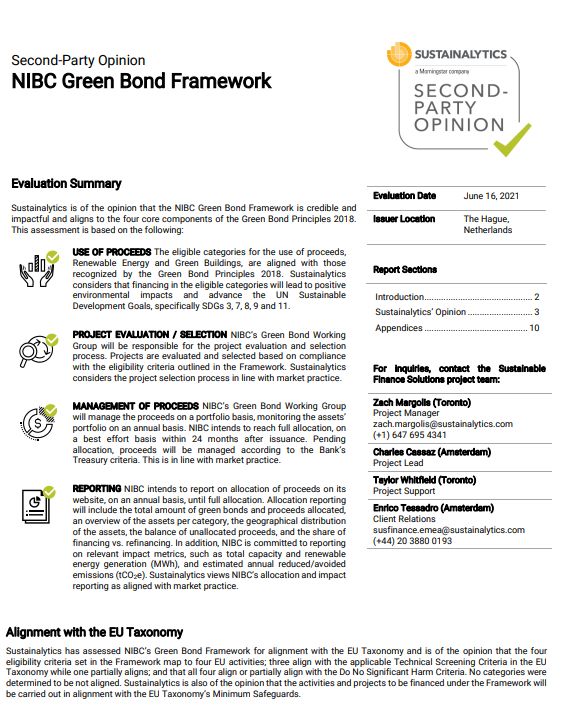
SUSTAINABILITY RATINGS AND CREDENTIALS
                                                                                      STRONG SUSTAINABILITY RATINGS

    Our target with respect to sustainability ratings:                                 ISS ESG (formerly OEKOM)
                                                                                                                  C+/Prime
                       To maintain our position in the top quartile among our peers
                                                                                       SUSTAINALYTICS
                                                                                                            22/Medium Risk
                                                                                                                    199 out of 1006

    We are proud to have received strong sustainability ratings from many of           MSCI¹
    the main global sustainability rating providers.
                                                                                                                            AA
                                                                                       REPRISK

                                                                                                                            AA

                                                                                                                                 7
1   NIBC Bank rating
NIBC IS STRONGLY ROOTED IN ITS OBLIGATIONS TOWARDS
SOCIETY
▪ NIBC was established in 1945 to help rebuild the
  Netherlands after the Second World War.
▪ Today our purpose is much the same – making a
  difference at decisive moments.

 “Our purpose is to create a sustainable franchise
     for the future, so we can continue to make a
 difference for our clients by focusing on their most
       decisive moments in business and in life.”

▪ We view sustainability as an opportunity for our
  stakeholders and ourselves. It’s an opportunity to
  engage with our diverse stakeholders, to work with
  clients to overcome challenging issues and to
  innovate and develop better ways of doing business.

                                                        8
SUSTAINABILITY EMBEDDED IN OUR STRATEGY
Supporting companies and consumers in their transition towards a sustainable future
Our starting points: ▪ Tone from the top
✓ We work in a professional manner and ▪ Clearly defined corporate purpose
with integrity and values, emphasis on being
NIBC
✓ We comply with all relevant legislation responsible and doing responsible Purpose
business
✓ We look to treat people, the environment & Values
and the communities in which we ▪ Integrated approach
operate, with the greatest possible care ▪ Clear governance structure Risk
Management
Sustainability
Framework
✓ We strive to ensure our services are ▪ Managing Board is ultimately Framework
responsible and sustainable responsible for all sustainability
Business Risk
✓ We strive that the companies we finance matters Strategy Strategy
operate in a sustainable manner ▪ Sustainability integral to the way we
✓ We aim to support our clients in do business and embedded
achieving their ambitions and enable throughout NIBC’s strategy Funding Strategy
Responsible Investors, Green Bonds
them to build a better society for future framework
generations
Functional Strategies
IT, HR, Operations
9SUSTAINABILITY EMBEDDED IN OUR STRATEGY
Supporting companies and consumers in their transition towards a sustainable future
NORTH WESTERLY VI ESG CLO
• UN PRI: ESG best practice in securitised products
• IFLR Structured Finance and Securitisation Deal of
Our long-term targets: the Year
• Innovation ESG screening, due diligence, scoring
and transparent investor reporting
• First fully ESG-compliant CLO
▪ Zero greenhouse gas emissions before 2050
SHIP RECYCLING STANDARDS
▪ At least a 55% emission reduction by 2030 • Founded by NIBC and two other peer banks,
currently involves 11 leading ship financiers
• Aims to improve human rights, environmental,
and transparent practices throughout the
shipping value chain
Supporting our clients to Continue to take steps in • Promotes responsible business aligned to the
OECD Guidelines, UN Guiding Principles on
transition and adapt our own operations Business & Human Rights
LOT HYPOTHEKEN
• Reduced rates for energy-efficiency
improvements
• Free energy audits, independent advice
• Two trees planted for every mortgage closed –
Green asset ratio for 100% 0 one in the NL and one abroad
corporate loan portfolio ESG due diligence and Fines or sanctions for non-
YE20201: assessments for new compliance with laws and NGO BOULEVARD
4% corporate loans (2019;
2020; H1 2021)
regulation (2019; 2020;
H1 2021)
• In 2015, we launched the NIBC NGO Boulevard
• NIBC houses 5 NGOs operating from our
headquarters in The Hague
10
1Based on first estimates, unaudited. NIBCs corporate exposures are comprised of 132 NACE activities. Of these, draft taxonomy alignment coefficients (TACs) were available for 19. For NACE activities where a TAC was not
available, we have conservatively assumed a TAC of 0. Only the objective Climate Change Mitigation is considered in the coefficients.SUSTAINABILITY GOVERNANCE
Supervisory Board NIBC Supervisory Board’s Risk Policy & Compliance Committee monitors and periodically discusses
sustainability matters. Sustainability is discussed quarterly with NIBC’s Supervisory Board.
Managing Board & ExCo NIBC's Managing Board is ultimate responsible for all sustainability matters. ExCo members discuss and
advise on sustainability strategy, targets, planning and budget.
Risk Management Committee New sustainability policies and material changes to NIBC’s Sustainability Framework and underlying
policies are reviewed and approved by NIBC’s Risk Management Committee.
Transaction, Investment & Sustainability risks related to corporate clients and transactions are presented in transaction proposals at
the relevant risk committee. The Sustainability Officer reviews assessments and is invited to join
committee meetings in the event increased sustainability risks have been identified and further
Engagement Committee discussions are warranted.
Asset & Liability Committee NIBC’s Asset & Liability Committee is responsible for any Green Bond issuance.
Internal Audit Processes and controls are audited by NIBC’s internal auditors.
Senior Sustainability Officer Responsible for overseeing NIBC's sustainability agenda.
11COMMITMENTS, FRAMEWORKS AND POLICIES, REPORTING
Commitments
Commitments Frameworks and policies Reporting
A number of externally-developed economic, environmental and social charters, principles, or other initiatives are
endorsed and applied within NIBC’s sustainability and corporate governance policies. Additional principles and charters
applied by NIBC are mentioned in our sector and issue-specific policies.
▪ Dutch Banking Codes ▪ Universal Declaration of Human Rights (by policy) ▪ UN Declaration on the Rights of Indigenous Peoples
(by policy)
▪ Equator Principles (member institution) ▪ OECD Guidelines for Multinational Enterprises (by
policy) ▪ UNICEF Convention on the Rights of the Child (by
▪ UN Global Impact (signatory) policy)
▪ ILO Core Conventions (by policy)
▪ UN Guiding Principles on Business and Human ▪ Wolfsberg Principles (by policy)
Rights (by policy) ▪ UN Principles for Responsible Investment – UNPRI
(by policy) ▪ FATF recommendations (by policy)
▪ IFC Performance Standards (by policy)
▪ UNEP FI (by policy) ▪ Partnership for Carbon Accounting Financials –
▪ Dutch IMVO/SER banking sector agreement PCAF (member institution)
(signatory) ▪ UN Convention on the Elimination of All Forms of
Discrimination again Women (by policy)
12COMMITMENTS, FRAMEWORKS AND POLICIES, REPORTING
Frameworks and policies
Commitments Frameworks and policies Reporting
As part of our client risk-assessment process, the sustainability standards we expect our clients to meet are clearly set
out in our Sustainability Policy. We also operate a Sustainability Framework, which describes the processes and tools we
use and designates those responsible for these processes at NIBC.
▪ Sustainability Framework ▪ Industrials Manufacturing Policy ▪ All corporate clients and transactions at NIBC
undergo robust human rights, environmental and
▪ Sustainability Policy ▪ Infrastructure Policy governance due diligence;
▪ Human Rights Policy Supplement ▪ Offshore Energy Policy ▪ Positive and negative screening;
▪ Environment Policy Supplement ▪ Renewables Policy ▪ Meaningful activity exclusions, among others, oil &
tar sands and shale oil & gas (fracking)
▪ Commercial Real Estate Policy ▪ Retail Services
(please refer also to the slide ESG at NIBC in practice)
▪ Financial Institutions Policy ▪ Shipping & Intermodal Policy
▪ Food, Agri, Retail & Health Policy ▪ Weapons and Defense Policy
▪ Indirect Investment Policy
13COMMITMENTS, FRAMEWORKS AND POLICIES, REPORTING
Reporting
Commitments Frameworks and policies Reporting
▪ NIBC Bank’s 2020 annual report has been prepared in accordance with the Global Reporting Initiative (GRI)
Standards: Core option. Our GRI Content Index and a materiality assessment can be found on the NIBC Annual Report
website.
▪ Our annually updated Sustainability Report serves as the main sustainability report for both NIBC Holding and NIBC
Bank and as a public guide to our policies and practices. It also supplements the most material sustainability aspects
and statements which are disclosed in our Annual Reports.
▪ Our Taskforce on Climate-Related Financial Disclosures (TCFD) Report serves as NIBC’s climate risk disclosure and our
UN Global Compact Communication on Progress (COP) serves as NIBC’s sustainable development goal (SDG) report.
▪ For an overview of all our commitments, frameworks, policies and reports with respect to sustainability, please visit
our dedicated webpages at https://www.nibc.com/about-nibc/sustainability/ and https://www.nibc.com/about-
nibc/sustainability/sustainability-governance/
14ESG AT NIBC IN PRACTICE – CORPORATE CLIENT OFFERING
Before NIBC engages with a new corporate client the business team is responsible for completing the following steps:
Engagement Approval NIBC Sustainability toolkit
Risk
classification +
Evaluation of engagement to determine:
Sustainability risk
assessment appropriate
the potential level of
next steps if it involves any
ESG risk associated with activities which are
each client or excluded by policy
Transaction Approval transaction
Complete transaction ESG risks
process
Human
Climate Biodiversity Other
rights
Monitoring
15ESG AT NIBC IN PRACTICE – SECTOR EXAMPLES
▪ NIBC recognises that the development of any infrastructure project can have potential environmental and human
rights (ESG) impacts and that these make infrastructure development a sensitive sector if these impacts are not
Infrastructure managed appropriately.
▪ NIBC is committed to taking ESG criteria into account in every aspect of our decision-making for financings and
investments in the infrastructure sector.
▪ NIBC Infrastructure provided John Laing Environmental Assets Group (JLEN) with the required capital to acquire a
range of renewable energy assets across the UK and Europe, to maintain its status as one of the leading
renewable energy investment funds in the UK.
▪ The interest charged in respect of the revolving credit facility is linked to the Company’s ESG performance, with
JLEN incurring a premium or discount to its margin and commitment fee based on performance
defined targets.
▪ Imagine is an innovative Irish company that provides broadband to
underserved rural areas in Ireland, a critical service, even more following
the COVID-19 pandemic.
▪ Having financed many broadband fibre network companies across Europe,
NIBC was able to draw on this experience to design a flexible finance
structure.
16ESG AT NIBC IN PRACTICE – SECTOR EXAMPLES
▪ NIBC aims to improve the energy, water and waste efficiency of our CRE portfolio each year, in support of national
and international efforts aligned to local, national and international efficiency goals and the UN SDGs.
Commercial Real Estate
▪ We estimate that up to 20% of our CRE portfolio is improved on one or more of these sustainability aspects each
year. All our development and construction financing projects have superior energy qualifications and contribute to
the reduction of the substantial Dutch housing shortage. More than two thirds of NIBC’s investments in office
buildings already have an energy label of C or higher.
▪ NIBC financed the construction of a student housing project in Utrecht,
named The Cube, taking off pressure from the currently overheated
Utrecht student housing market.
▪ The sustainability aspect is very high; there are numerous solar panels
on the roof, LED lightning and the use of sustainable construction
materials.
▪ NIBC closed a development financing for The Grace towers in The
Hague.
▪ The Grace is a highly sustainable project with a global innovation, which
makes it the first fully electric skyscrapers powered by a solar field as
wide as 4.500 m².
▪ Sustainable and energy-efficient materials will be used for construction.
17ESG AT NIBC IN PRACTICE – RETAIL CLIENT OFFERING
Lot Mortgages
▪ Maximum Loan-to-Value above 100% possible, up to
106% in case of energy saving facilities
▪ Free energy audit
▪ Separate sustainability mortgage to finance energy-
efficiency improvements at reduced interest rates
▪ Two trees planted for every sustainability mortgage
closed
▪ Mortgage label Lot has a focus on NHG mortgages,
which are particularly suitable for first time buyers
NIBC Direct
▪ Maximum Loan-to-Value above 100% possible, up to 106% in
case of energy saving improvements
▪ Tailor made mortgage solution for seniors
▪ Possibility to obtain a mortgage for self-employed
▪ Offers NHG mortgages, which are particularly suitable for first
time buyers
18ESG AT NIBC IN PRACTICE
Our own operations
Promoting Diversity &
36 Gender pay ratio
66% / 34% Nationalities across Close to 1
Inclusiveness male / female ratio 4 countries from
At every level
which we operate
▪ Improvement to average energy label A for
our building complex in The Hague, from
average energy label D in 2012
▪ CO2 neutral head office
NIBC Environmental ▪ Energy-star certified equipment
Management Program ▪ Equipment recycling and school donation
program
▪ Electric charge-points for employees and
visitors
▪ Certified gold-standard carbon offsets
purchased from NGOs to compensate for
any remaining Scope 1 & 2 emissions
19ESG AT NIBC IN PRACTICE - ASSETS
Estimated emissions related to NIBC financings 2020 2019
Residential mortgages by energy label,
and investments (1,000 tCO2e)
own book1
30%
Retail real estate portfolio 193 239
Commercial real estate emissions n/a n/a
Corporate client emissions 612 830
20%
Factor for emissions we can not yet estimate 228 228
Total 1,033 1,295
10%
Total estimated tCO2e per mln NIBC balance sheet 49.98 57.93
% of NIBC total exposures included in emissions 86% 84%
estimate
0%
▪ Exposures to governments and central banks are not currently included in the estimates above.
Estimated emissions for Commercial real estate is currently not available as we continue our
Definitive Preliminary
work to build estimates for this portfolio.
▪ Across our full CRE portfolio, about 42% of collateral objects have label A, B or C. 13% have label
D, E, or F. Finally, 32% are not yet known or are currently in development and 14% are ineligible.
1 Per 30 June 2021
20
.UN SUSTAINABLE DEVELOPMENT GOALS
▪ NIBC has been a signatory of UN Global Compact (UNGC) since 2010
and supports the ten principles of the Global Compact with respect to
human rights, labour, environment and anti-corruption as well as the
broader UN goals.
▪ Several UN SDGs are prioritised as part of our business strategy. This is
based both on internal reflections as well as on discussions with clients
and other stakeholders. These SDGs include Responsible Consumption
and Production (SDG12), Economic Growth (SDG8), Industry &
Innovation (SDG9), Sustainable Communities (SDG11) and Clean
Energy (SDG7).
▪ By focusing on these SDGs, we believe we will also contribute towards
several other goals including Good Health (SDG3), Gender Equality
(SDG5) and Climate Action (SDG13) among others.
▪ Each year, we have published a Communication on Progress (COP) on
our corporate website and on the UNGC website.
21GREEN BOND FRAMEWORK
22RATIONALE FOR ISSUING GREEN BONDS
NIBC aims to issue green bonds in order to…
Address our role in and Live up to our purpose to create a Strengthen our funding profile
responsibility towards society sustainable franchise for the future
▪ Enhance and underline our ▪ Support the origination of ▪ Foster long-term investor
commitments sustainable fields of businesses relationships
▪ Recognize the role and ▪ Incentivize to increasingly ▪ Diversify our investor base
importance of financial integrate sustainability in products
▪ Diversify our funding profile
institutions to promote climate and policies
and environmental objectives
23USE OF PROCEEDS
Green Category Definition Eligibility criteria UN SDG
Renewable Energy The financing or refinancing of ▪ Wind energy
renewable energy in the EU and UK
▪ Solar Energy
Green Buildings The financing or refinancing of ▪ Buildings with the construction
energy efficient commercial or year 2021 or later: Energy
residential real estate in the performance is at least 10%
Netherlands lower than NZEB¹ requirements
▪ Buildings constructed prior to
2021: The better of
1. EPC Label A or higher registered after
1/1/2013 or the construction date after
1/1/2013 (residential real estate only), or
2. Top 15% low-carbon residential or
commercial buildings in the Netherlands
24
1 Nearly Zero-Energy Building requirements in the Netherlands implementing Directive 2010/31/EU of the European Parliament and of the Council.GREEN BOND ELIGIBLE ASSETS
▪ The current green bond eligible assets represent part of NIBC’s
EUR 1,241 million balance sheet for which Taxonomy alignment can be verified by
Green bond eligible residential real
estate assets1 means of readily available internal or external data.
▪ We are in the process of verifying Taxonomy compliance for other
sectors and sub-sectors.
▪ As such, we have taken a conversative approach in determining our
EUR 191 million green bond eligible asset base and we intend to expand our
Green bond eligible commercial real
estate assets1 framework with other Taxonomy aligned activities.
EUR 20 million
Green bond eligible renewable
energy infrastructure assets1
1 Per 30 June 2021
25
.PROJECT EVALUATION AND SELECTION
▪ NIBC’s Green Bond Working Group (GBWG) is responsible for approving asset selection, guided by the Green Bond
Framework. The GBWG monitors that all Green Eligible Assets comply with national and international environmental
and social standards, the EU Taxonomy and its technical screening criteria (TSC) and do no significant harm criteria
(DNSH), and local laws and regulations.
▪ The GBWG will manage any future updates to the Framework, including expansions to the list of Eligible Categories,
and oversee its implementation. Changes to the Framework will be subject to the approval of NIBC’s Asset & Liability
Committee (ALCO).
▪ The GBWG is chaired by NIBC’s Sustainability Officer.
NIBC Green Bond Working Group
Corporate client Retail client Treasury Sustainability
offering offering department
26MANAGEMENT OF PROCEEDS
▪ The Green Bond proceeds will be managed by NIBC on a portfolio basis.
▪ As long as Green Bonds are outstanding, it is intended to exclusively allocate an amount equivalent to net proceeds of
these instruments to a portfolio of Green Eligible Assets which meet the eligibility criteria and other criteria as described
in the Framework.
▪ If an Eligible Asset is divested or does no longer meet the eligibility criteria as outlined in the Framework, NIBC will
remove this asset from the portfolio and will strive to replace it with another Eligible Asset as soon as reasonably
practicable.
▪ Pending the allocation of the net proceeds of issued Green Bonds to the portfolio of Eligible Assets, or in case insufficient
Eligible Assets are available, the Issuer commits to manage the unallocated proceeds in line with its Treasury criteria.
▪ The allocation of the net proceeds of issued green finance instruments to the portfolio of Eligible Assets will be reviewed
and approved by NIBC’s Green Bond Working Group on at least an annual basis, until full allocation of the net proceeds
of issued green finance instruments.
▪ NIBC intends to reach full allocation, on a best effort basis within 24 months after issuance.
▪ NIBC may issue Green Bonds in different structures, such as Senior (Non-)Preferred Notes and Covered Bonds
27REPORTING
▪ NIBC commits to report in line with market practice.
▪ NIBC intends to appoint one or more external verifiers that are asked to provide a pre-issuance verification and a
post-issuance verification.
Allocation Reporting
Total amount of Total amount of An overview of An overview of The balance of The share of new
Green Bonds Green Bond Green Eligible geographical unallocated financing and
Outstanding proceeds allocated Assets per distribution of proceeds (if any) refinancing
category allocated assets
Impact Reporting
Renewable Energy ▪ Total capacity and renewable energy Green Buildings ▪ Estimated annual reduced/avoided
generation (estimated) in MWh emissions in t CO2e
▪ Estimated avoided emissions in kt CO2e
28EXTERNAL REVIEW
Sustainalytics is of the opinion that the NIBC Green Bond Framework is
✓ Credible
✓ Impactful
✓ Robust
✓ Transparent
✓ Aligns to the four core components of the Green Bond Principles 2018.
Sustainalytics has assessed NIBC’s Green Bond Framework for alignment
with the EU Taxonomy and is of the opinion that
✓ The four eligibility criteria set in the Framework map to four EU activities.
✓ Three align with the applicable Technical Screening Criteria in the EU Taxonomy while
one partially aligns.
✓ All four align or partially align with the Do No Significant Harm Criteria.
✓ No categories were determined to be not aligned.
✓ The activities and projects to be financed under the Framework will be carried out in
alignment with the EU Taxonomy’s Minimum Safeguards.
29NIBC CREDIT PROFILE
30NIBC PERFORMANCE IN H1 2021
▪ NIBC had a strong half year, with operating income benefitting from positive results of the equity
investment portfolio and an increase in fee income
▪ Interest income equals EUR 188 million (-9%), following development of both portfolio volumes and
spreads. The net interest margin (1.87%) showed resilience, benefitting from lower funding costs
▪ Cost/income ratio of 46%, including continued investments in both strategic initiatives and projects to
address new regulatory requirements and process improvements
▪ Credit losses have decreased considerably to EUR 14 million in H1 2021 (from EUR 84 million in H1 2020),
reflecting the improved economic situation and outlook
▪ Continued strong capital position with a CET 1 ratio of 20.0% (2020: 19.9%) and an ROE of 10.2% (H1
2020: 0.3%)
▪ All-in-all, this has led to a net profit attributable to shareholders of EUR 91 million (H1 2020: EUR 3
million)
31ADDRESSING THE CHALLENGES FROM COVID-19
First priority remains safeguarding health of our staff and families and ensuring business continuity
OUR PEOPLE OUR BUSINESS OUR CLIENTS
Our People s Our Clients
▪ The COVID-19 pandemic deeply changed our ▪ As was the case in 2020, alertness on business ▪ NIBC continued to prudently extend credit to
ways of working, maximizing working from home continuity under COVID-19 continues, managed by businesses of all sizes for working capital and
both the CRO and CFO with bi-weekly update calls general corporate purposes
▪ During H1 2021, supported by increased
vaccination levels and technological innovation, ▪ The focus on liquidity management remains a ▪ Intensified client interaction and increased
more working from the office in a safe way was priority in the COVID-19 environment, maintaining monitoring and reporting on the portfolio (also
made possible NIBC’s liquidity buffers at a high level. using the tools of our partner OakNorth) have
helped to address issues head on
▪ Intensified communication to all staff ▪ There are no material funding transactions
implemented during 2020 continued in 2021, maturing in the remainder of 2021 ▪ Cautious origination on the corporate client side;
with regular Corona news releases and periodic with a focus on specific asset classes and on
▪ In July 2021 NIBC Bank announced the acquisition
video updates by an ExCo member portfolio management
of the loan portfolio of EUR 1.5 billion of
▪ Intensified contact by managers with their teams Finqus B.V. The closing is expected to take place in ▪ NIBC actively continued to support the growth
with increased one on one meetings Q4 of 2021 (subject to approval by the regulators initiatives Beequip, yesqar, OIMIO and Lendex to
DNB and ACM) support new client groups. All these initiatives
displayed growth in H1 2021
▪ Overall, our clients have weathered COVID well as
also displayed by the decreased level of credit
losses
32FOCUSED TRANSFORMATION
Continued rebalancing of our portfolios towards more resilience
NIBC PORTFOLIO TRANSFORMATION SINCE 2019
COMPOSITION NIBC’S
H1 2021 CLIENT OWN BOOK ASSETS
in EUR billion H1 2021 FY 2019 vs. FY 2019 COMMENTS
Energy 0.4 0.7 -51% H1 2021 ▪ The overall decrease in all portfolios are due to two
Shipping 0.8 1.0 -21% factors:
Financial Sponsors & ▪ Lower origination during 2020 due to COVID-19
Leveraged Finance 0.7 1.0 -27%
Commercial Real Estate (incl. ▪ The deliberate reduction of certain asset classes
44.3% Retail continued in H1 2021
OIMIO) 1.3 1.6 -17%
EUR 18.1 bn
Fintech & Structured finance 0.8 1.0 -26% 55.7% Corporate ▪ Total client assets - including originate-to-manage -
Mobility (incl. yesqar) 0.6 0.7 -2% increased by 14% since 2019
Infrastructure 1.7 1.7 -4% ▪ Clients’ assets for NIBC’s own book displayed
Mid Market Corporates 0.6 1.1 -44% continuous rebalancing towards a higher share of
Total corporate loans (drawn retail and other granular asset classes:
& undrawn) 6.9 8.9 -22% ₋ Growth of the mortgage book by 2%
Beequip and other lease FY 2019 ₋ Growth of higher margin businesses such as
receivables 0.7 0.5 41%
leasing incl. Beequip (+41%) and Buy-to-Let
Investment loans 0.2 0.2 -28%
(+25%)
Equity investments 0.3 0.3 -17%
Total corporate client assets 8.0 9.9 -19% ₋ Decreased exposure in the cyclical sectors
Owner-occupied mortgage Retail
Shipping, Energy and Leveraged Finance by 31%
50.4%
loans 9.2 9.0 2% EUR 19.6 bn
49.6% Corporate ▪ Strong growth of the originate-to-manage offering
Buy-to-Let mortgages 0.9 0.7 25% from EUR 5.1 billion in 2019 to EUR 10.1 billion in H1
Total retail client assets 10.1 9.7 4% 2021
OTM Retail client assets 8.7 4.3 101%
OTM Corporate client assets 1.4 0.8 87%
33
Originate-to-manage assets 10.1 5.1 99%RETAIL CLIENT OFFERING
Strong mortgage origination results in market share of 4%, despite price volume competition
MORTGAGE LOAN ORIGINATION GROWTH CLIENTS
STRONG ORIGINA TION MARKET SHARE ORIGINATION¹ ▪ Number of clients +6% since 2020
▪ Total number of clients 141k
2.5bn 4% ▪ Total number of clients 310k
MORTGAGE LOAN PORTFOLIO
In EUR bn LOW RISK PORTFOLIO FACTS AND FIGURES
▪ Strong growth OTM portfolio from EUR 7.5
18.7 billion to EUR 8.7 billion
7.9
17.4 NIBC DIRECT
14.0
▪ Total OTM mandates over EUR 12 billion CUSTOMER SURVEY
8.7 ▪ Growth in the Buy-to-Let portfolio of 25% since
7.5 SCORE SAVINGS
4.3 2019
0.7 0.9 0.9
8.0
9.2 ▪ 64% loan to value on own book residential NIBC DIRECT
9.0 9.0
mortgage portfolio CUSTOMER SURVEY
2019 2020 H1 2021
Owner-occupied Buy-to-let Originate-to-Manage
▪ Retail savings increased in 2021 by 7% to EUR SCORE MORTGAGES
10.5 billion
34
1 Based on market volumesCORPORATE CLIENT OFFERING
Progressing with rebalancing and de-risking strategy, ready to grow again
CORPORATE LOAN ORIGINATION REBALANCING THE PORTFOLIO ENTREPRENEURIAL SPIRIT OF NEW GROWTH
ENGINES IN 2021
SELECTIVE ORIGINA TION ACTIVELY MANAGED CORPORATE
EXPOSURE
1.6 bn 8.0 bn
In EUR bn
▪ The lease receivables portfolio incl. BEEQUIP
1.6 ▪ Increased origination following the subdued displayed growth in H1 2021 of 14%
level in 2020 during COVID-19 pandemic
▪ OIMIO - the Bank's commercial real estate
▪ Continued de-risking in Energy and Leveraged offering for small Dutch SMEs launched in 2020
1.0
Finance - grew its book by 55% to more than EUR 100m
0.6 ▪ Continued focus of margin over volume in H1 2021
▪ Increased focus in H1 2021 on growing ▪ yesqar - the Bank's asset data driven auto-
in Infrastructure, Commercial Real Estate and motive offering launched in Q3 2020 - grew to a
H1 2019 H1 2020 H1 2021 portfolio of nearly EUR 30 million in H1 2021
Leasing
35INCOME STATEMENT
Strong performance in H1 2021, re-bouncing from the subdued level in 2020
INCOME STATEMENT PROFIT AFTER TAX AND RETURN ON EQUITY COMMENTS
H1 2021 ▪ The overall performance for H1 2021 is strong
H1 H1 vs. 11.8% ▪ The profit after tax is back to our pre-COVID-19 levels
in EUR millions 2021 2020 2020 2019 H1 2020 10.2%
11.4% ▪ Increased operating income displays the balance of:
Net interest income 188 208 403 426 -9%
201 • High investment income from successful exits and
Net fee and commission income 21 19 43 40 7%
(7) positive revaluations in our equity portfolio
Investment income 43 5 7 60 >100% 194
Other income -8 -17 -21 10 -54%
3.4% • Increased fee income on the back of further growth in
Operating income 244 215 431 537 14% 0.7%
the originate-to-manage portfolios
2.6% 91
60
• Subdued net interest income from lower origination of
Personnel expenses 54 55 108 119 -2% 0.3% 91 corporate loans in 2020 as well as decreasing spreads
(13)
Other operating expenses 44 49 102 97 -10%
7 47
in the mortgage market
Depreciation and amortisation 3 3 6 6 -12% (4)
Regulatory charges and levies 13 10 16 15 26% 3
2019 H1 2020 2020 H1 2021
▪ The decrease in operating expenses reflects active cost
Operating expenses 113 117 232 237 -3%
Profit after tax excl non-recurring Non-recurring
management on the bank's base activities, ensuring the
Net operating income 131 98 199 300 34%
Profit after tax ROE
ability to continue to invest in new initiatives and
ROE ex non-recurring improvement projects, strengthening the Bank's processes
Impairments of financial and non
financial assets 14 84 141 49 -84%
60 ▪ Credit loss expenses are significantly lower than in H1 2020,
Tax 21 5 -2 45 >100% which were elevated due to the COVID-19 pandemic
Profit after tax 97 9 59 206 >100%
Profit attributable to non-controlling
shareholders 6 6 12 12 0%
Profit after tax attributable to
shareholders of the company 91 3 47 194 >100%
36PERFORMANCE H1 2021
Strong performance on profitability, cost control and capital in H1 2021
MEDIUM-TERM
METRICS OBJECTIVES H1 2021 COMMENTS
▪ Profitability improved to 10% ROE from the subdued level in 2020,
Return on Equity
(Holding)
10 - 12% 10.2% reflecting a H1 2021 net profit of EUR 91 million
▪ The fully-loaded cost/income ratio improved in H1 2021 to 46%,
from 54% in H1 2020
Cost/income
< 45% 46%
(Holding) ▪ The CET 1 ratio of 20.0% increased marginally from the year-end
2020-level and displays a significant buffer above minimum SREP
requirements
CET 1
≥ 14% 20.0% ▪ Following the decision by the ECB to not extend its
(Holding)
recommendation that banks limit dividend payments beyond 30
September 2021, the management and supervisory boards of NIBC
Dividend pay-out deem payment of the final dividend 2019 to its two previous major
≥ 50% TBD
(Holding)
shareholders J.C. Flowers & Co. and Reggeborgh Invest B.V. feasible
and appropriate. As this remaining part of the final dividend 2019
Rating has been recorded as a dividend liability, pay-out will not affect
BBB+ BBB+ Stable Outlook
(Bank) NIBC's capital ratios.
.
37
Rating reflects S&P’s long-term issuer credit rating on NIBC BankPORTFOLIO VOLUMES AND SPREADS
Successful development towards a more granular portfolio, decreasing cyclical exposures
CORPORATE LOAN SPREADS & VOLUMES COMMENTS
RETAIL ASSET SPREADS & VOLUMES
▪ Retail client assets:
₋ The own book portfolio of mortgage loans increased in
H1 2021 by 2% to EUR 9.2 billion, with continued
pressure on origination spreads
4.94% 4.89% 4.96%
3.68% 3.66% ₋ Buy-to-let increased by 3% to EUR 0.9 billion at stable
3.45%
origination spreads
2.30% 2.17% 3.15% 3.25% ₋ OTM assets increased by 15% to EUR 8.7 billion and the
2.10%
mandate further increased from EUR 9.8 billion to EUR
2.70% 12.2 billion
1.88% 1.91% 1.86%
2.52% 2.77% 2.81%
▪ Corporate client assets:
2019 2020 H1 2021 2019 2020 H1 2021
Portfolio spread (%) Origination spread BTL (%) ₋ The rebalancing was accompanied by an increase in the
Portfolio spread (%) Origination spread (%)
Origination spread owner occupied (%) Beequip portfolio spread (%) average portfolio spread to 2.8%, mainly driven by a
further increase of the average origination spread
9.9
9.7 9.9 10.1 0.3 ₋ The sectors targeted for growth all displayed an
8.1
0.9 8.0
0.7 0.9 0.5 0.2
0.3 0.3 increase, mainly in commercial real estate incl. OIMIO
0.6
0.2
0.7
0.1 (+19%), the lease portfolio incl. Beequip (+14%), Core
infrastructure (+9%) and Mobility incl. yesqar (+2%)
9.0 9.0 9.2 8.7 8.9
7.5 7.1 6.8
₋ OTM assets increased by 36% to EUR 1.4 billion,mainly
4.3 driven by the North Westerly VII transaction, issued in
0.8 1.1 1.4 H1 2021
2019 2020 H1 2021 2019 2020 H1 2021
Owned Occupied Buy-to-Let Originate-to-Manage Corporate loans Lease receivables Investment loans
38
Equity investments Originate-to-ManageNET INTEREST INCOME
Decreased net interest income in 2021 is impacted by lower corporate origination in the previous year
NET INTEREST INCOME NET INTEREST MARGIN & FUNDING SPREAD COMMENTS
(EUR million)
▪ Net interest income decreased by 9% compared to
2.06% 2.01%
H1 2020 due to:
1.92% 1.87%
₋ downward pressure on the portfolio spread of
426 the mortgage loan portfolio
403 1.89% 1.85%
34 1.77% 1.73%
31 ₋ the lower volume of the corporate loan book
392
372
from low origination in 2020
208
▪ The average funding spread decreased by 3 basis
188 0.71% 0.71% 0.75% 0.72%
17 points, mainly driven by:
13
191
175 ₋ The issuance of a EUR 500 million covered bond
2019 H1 2020 2020 H1 2021 with a maturity of 10 years in Q2 2021
Net interest margin ₋ The increase of the volume in retail savings by
2019 H1 2020 2020 H1 2021 Net interest margin ex. IFRS 9 effect 7% combined with lower interest rates on the
Net interest income IFRS 9 impact Funding spread on-demand retail savings portfolio
39NET FEE AND COMMISSION INCOME
Focus on originate-to-manage continues to pay off
NET FEE AND COMMISSION INCOME COMMENTS
(EUR million)
▪ Total fee income increased in H1 2021 by 7% to EUR 21 million compared to H1
2020, fully driven by the increase in OTM fees from retail client assets, which
43 increased by over 20% from EUR 12 million to EUR 14 million
40 1 Brokerage ▪ This mirrors the growth of the underlying mortgage assets under management
4 OTM mortgage loans ▪ All other fee categories remained stable in H1 2021 at the H1 2020 levels
M&A
Lending related fees
15 27 OTM Loans
21
19 0
4
12 2 14
10
8
2 2
7 3 2
5
2 2
2019 H1 2020 2020 H1 2021
40OPERATING EXPENSES
Strong improvement of fully loaded cost/income ratio
DEVELOPMENT OF OPERATING EXPENSES COST/INCOME RATIO COMMENTS
(in EUR million) ▪ Operating expenses decreased by 3% to EUR 113
million due to continued active cost management
237 232 and lack of non-recurring expenses
Non-recurring
9 17 54% ▪ NIBC continues its efforts to increase efficiencies in
NIBC excl. non-
its base operations, allowing for additional
recurring investments in both new business opportunities and
1
50% 46% in further strengthening its operational and techno-
117 1 logical capabilities
42%
228 5 215 ▪ Overall, headcount is relatively stable, with a minor
44% movement towards the growth initiatives
112 113 ▪ In the 2021 cost base there are significantly higher
direct regulatory costs (+ EUR 3 million) related to
2019 2020 H1 2021 the DGS, partially driven by the relative position of
cost/income ratio NIBC in Dutch savings volumes
2019 H1 2020 2020 H1 2021 cost/income ratio ex. non-recurring
▪ Higher income and lower expenses led to an
improvement of the cost/income ratio from 54% at
year-end 2020 to 46% at H1 2021
41
1 There are no non-recurring items in H1 2021CREDIT LOSS EXPENSES
Credit loss expense rebounds back to a lower level than 2020
DEVELOPMENT OF COST OF RISK AND IMPAIRMENT RATIO KEY FIGURES ASSET QUALITY COMMENTS
H1 2021 2020 2019
▪ Credit loss expenses are significantly lower than in H1
1.75% 2020 as a result of an improved economic situation, in
combination with continued active portfolio
Impairment coverage ratio 35% 36% 33% management and de-risking
0.63%
0.40% Non-performing loan ratio 2.7% 2.0% 2.4% ▪ Credit loss expenses of the corporate client offering of
0.80% EUR 16 million include:
0.29% Exposure corporate arrears >
147 0.16% 90 days 3.0% 2.1% 1.2%
• EUR 20 million additions on stage 3 and POCI
assets, mainly related to specific impairments in
Exposure residential mortgage the Energy and Fintech & Structured Finance
loans arrears > 90 days 0.1% 0.2% 0.1% portfolios
LtV Dutch residential • a release of EUR 5 million on the stage 1 and
mortgage loans 64% 64% 68% stage 2 corporate exposures, including lease
receivables
137
LtV BTL mortgage loans 53% 53% 52% ▪ Credit loss expenses of the Retail Client Offering
52
displayed a small release, mainly driven by increasing
house prices, improving the loan-to-value of the
49 existing portfolio
16
3 10 14 ▪ In line with the end of 2020, NIBC continued to apply
2
a management overlay of EUR 15 million reflecting
2019 2020 H1 2021
Credit losses FVtPL loans Credit losses on AC loans the still uncertain external environment. The amount
Cost of risk¹ Impairment ratio² is unchanged and therefore has no impact on credit
loss expenses in H1 2021
42
1. Cost of risk = annualised credit loss expense and other credit losses divided by average RWAs
2: Impairment ratio = annualised credit loss expense divided by average assets loans & mortgagesFUNDING PROFILE DOMINATED BY LONGER MATURITIES
No material redemptions in the remainder of 2021
FUNDING COMPOSITION COMMENTS
▪ NIBC's funding profile continues to benefit from a diversified funding composition
▪ Retail savings increased by 7% in H1 2021 to EUR 10.5 billion
20%
9%
▪ NIBC has a range of wholesale funding instruments available to access various segments of
Shareholders equity the funding market
Retail funding
1% ▪ In Q2 2021 we issued a EUR 500 million covered bond with a maturity of 10 years.
2% Secured (wholesale) funding
H1 2021 The transaction was met with strong demand from across Europe, evidenced by a final
ESF deposits orderbook of EUR 1.35 billion
TLTRO
19% 49%
Unsecured (wholesale) funding
▪ NIBC’s liquidity position is strong:
• NIBC increased its liquidity buffers further in H1 2021, also in preparation of the closing
(anticipated in Q4 2021) of the acquisition of the EUR 1.5 billion Finqus mortgage loan
portfolio
MATURING FUNDING AS OF 30/06/2021
• Comfortable and high liquidity ratios improved in H1 2021 to 258% (LCR) and 131%
in EUR billion H2 2021 2022 2023 2024 2025 2026 (NSFR)
Covered bonds - 0.5 - - - 0.5
Other secured funding - 0.1 0.5 - - -
Senior unsecured 0.1 0.6 0.9 0.5 0.7 -
Subordinated - - - - 0.1 -
Total: 0.2 1.1 1.4 0.6 0.7 0.6
43
Financials for NIBC Holding as per 30 June 2021CAPITAL POSITION
Strong solvency ratios COMMENTS
▪ NIBC has a strong capital position reflected in a CET 1 ratio of 20.0% at H1 2021,
CET 1 DEVELOPMENT IN H1 2021 displaying a marginal increase compared to the 2020 level of 19.9%
▪ As per H1 2021 CRR II is implemented:
• In H1 2021 this resulted in an increase in our RWA position from the
implementation of SA-CCR for corporate derivatives
• The implementation of the prudential backstop did not have any effect in H1 2021.
▪ The RWA-level compared to 2020 is mainly impacted by the reduced corporate
exposures, increasing the CET1 ratio with 0.2%-points.
8,841
7,981 8,004
22.1% 22.1%
20.5%
2.1%
1.2% 1.1% 1.2% 1.0%
1.3%
19.9% 20.0%
17.1%
2019 2020 H1 2021
CET1 Tier 1 Tier 2 RWA
44CONTACT DETAILS AND EXTERNAL LINKS
Hans Starrenburg Robin Willing
Head of Treasury Sustainability Officer
Tel: +31 (0)70 342 9839 Tel: +31 (0)70 342 5446
Mob: +31 (0)6 53 99 65 14
Hans.Starrenburg@nibc.com Robin.Willing@nibc.com
Seva Nefedov Toine Teulings
Treasury Funding Management Treasury Funding Management & Debt IR
Tel: +31 (0)70 342 5569 Tel: +31 (0)70 342 9836
Mob: +31 (0)6 15 82 67 62 Mob: +31 (0)6 53 64 22 26
Seva.Nefedov@nibc.com Toine.Teulings@nibc.com
Frameworks, policies and reports with respect to sustainability (including Sustainalytics SPO):
https://www.nibc.com/about-nibc/sustainability/
https://www.nibc.com/about-nibc/sustainability/sustainability-governance/
Debt Investor Relations:
https://www.nibc.com/about-nibc/investor-relations/debt-investors/
45Notes to the presentation
Parts of this presentation may contain inside information within the meaning of article 7 of Regulation (EU)
No 596/2014 (Market Abuse Regulation). This public announcement does not constitute an offer, or any
solicitation of any offer, to buy or subscribe for any securities in NIBC Holding N.V.
Forward-looking Statements
This presentation may include forward-looking statements. All statements other than statements of historical
facts may be forward-looking statements. These forward-looking statements may be identified by the use of
forward-looking terminology, including but not limited to terms such as guidance, expected, step up,
announced, continued, incremental, on track, accelerating, ongoing, innovation, drives, growth, optimising,
new, to develop, further, strengthening, implementing, well positioned, roll-out, expanding, improvements,
promising, to offer, more, to be or, in each case, their negative or other variations or comparable
terminology, or by discussions of strategy, plans, objectives, goals, future events or intentions. The forward-
looking statements included in this presentation with respect to the business, results of operation and
financial condition of NIBC Holding N.V. are subject to a number of risks and uncertainties that could cause
actual results to differ materially from such forward-looking statements, including but not limited to the
following: changes in economic conditions in Western Europe, changes in credit spreads or interest rates, the
results of our strategy and investment policies and objectives. NIBC Holding N.V. undertakes no obligation to
update or revise any forward-looking statement to reflect events or circumstances that may arise after the
date of this release.
46You can also read