Furnished as of November 5, 2021 - UNAUDITED - Healthcare Trust of America, Inc.
←
→
Page content transcription
If your browser does not render page correctly, please read the page content below
Furnished as of November 5, 2021 - UNAUDITED
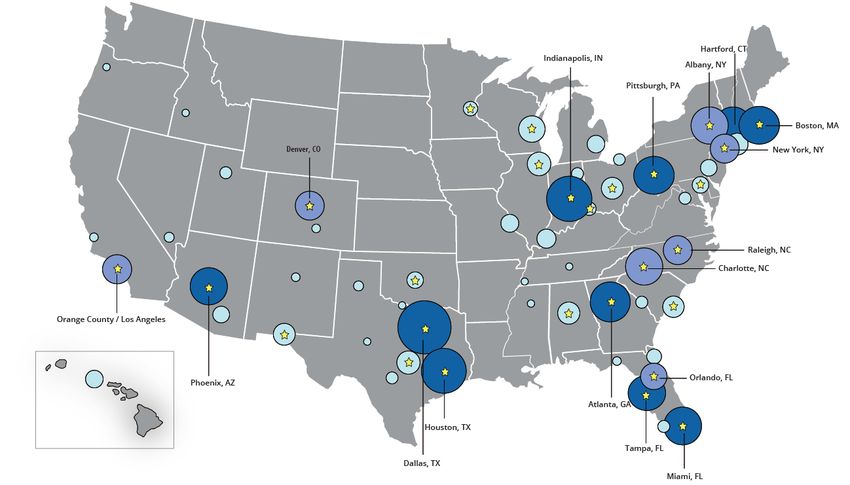
Table of Contents

Company Overview
   Company Information                                                                                                                       3
   Recent Highlights                                                                                                                         6
   Financial Highlights                                                                                                                      8
   Company Snapshot                                                                                                                          9
Financial Statements
   Condensed Consolidated Balance Sheets                                                                                                    10
   Condensed Consolidated Statements of Operations                                                                                          11
   Condensed Consolidated Statements of Cash Flows                                                                                          12
Financial Information
   FFO, Normalized FFO, Normalized FAD and Adjusted EBITDAre                                                                                13
   Debt Composition and Maturity Schedule                                                                                                   14
   Capitalization and Covenants                                                                                                             15
Portfolio Information
   Same-Property Performance and NOI                                                                                                        16
   Investment Activity                                                                                                                      17
   Development/Redevelopment Summary and Property Capital Expenditures                                                                      18
   Net Asset Value Components                                                                                                               19
   Key Markets in Top 75 MSA Concentration                                                                                                  20
   Portfolio Diversification by Type, Historical Campus Proximity and Ownership Interests                                                   21
   New and Renewal Leasing Activity, Historical Leased Rate and Tenant Lease Expirations                                                    22
   Tenant Profile, Tenant Specialty and Top MOB Tenants                                                                                     23
Reporting Definitions                                                                                                                       24

Forward-Looking Statements:
Certain statements contained in this report constitute forward-looking statements within the meaning of the safe harbor from civil liability
provided for such statements by the Private Securities Litigation Reform Act of 1995 (set forth in Section 27A of the Securities Act of 1933,
as amended, and Section 21E of the Securities Exchange Act of 1934, as amended, or the Exchange Act). Such statements include, in
particular, statements about our plans, strategies, prospects and estimates regarding future medical office building market performance.
Additionally, such statements are subject to certain risks and uncertainties, as well as known and unknown risks, which could cause actual
results to differ materially and in adverse ways from those projected or anticipated. Therefore, such statements are not intended to be a
guarantee of our performance in future periods. Forward-looking statements are generally identifiable by the use of such terms as “expect,”
“project,” “may,” “should,” “could,” “would,” “intend,” “plan,” “anticipate,” “estimate,” “believe,” “continue,” “opinion,” “predict,” “potential,” “pro
forma” or the negative of such terms and other comparable terminology. Readers are cautioned not to place undue reliance on these
forward-looking statements. We cannot guarantee the accuracy of any such forward-looking statements contained in this report, and we do
not intend to publicly update or revise any forward-looking statements, whether as a result of new information, future events, or otherwise,
except as required by law. Any such forward-looking statements reflect our current views about future events, are subject to unknown risks,
uncertainties, and other factors, and are based on a number of assumptions involving judgments with respect to, among other things, future
economic, competitive and market conditions, all of which are difficult or impossible to predict accurately. To the extent that our assumptions
differ from actual results, our ability to meet such forward-looking statements, including our ability to generate positive cash flow from
operations, provide dividends to stockholders, and maintain the value of our real estate properties, may be significantly hindered. Forward-
looking statements express expectations of future events. All forward-looking statements are inherently uncertain as they are based on
various expectations and assumptions concerning future events and they are subject to numerous known and unknown risks and
uncertainties that could cause actual events or results to differ materially from those projected. Due to these inherent uncertainties, our
stockholders are urged not to place undue reliance on forward-looking statements. Forward-looking statements speak only as of the date
made. In addition, we undertake no obligation to update or revise forward-looking statements to reflect changed assumptions, the
occurrence of unanticipated events or changes to projections over time, except as required by law. These risks and uncertainties should be
considered in evaluating forward-looking statements and undue reliance should not be placed on such statements. Additional information
concerning us and our business, including additional factors that could materially affect our financial results, is included herein and in our
filings with the SEC.

                                                                                                                       3Q 2021 I Supplemental Information
                                                                                                                       Healthcare Trust of America, Inc. I 2
Company Information

Healthcare Trust of America, Inc. (NYSE: HTA) is the largest dedicated owner and operator of medical office buildings (“MOBs”) in the United
States, with assets comprising approximately 25.8 million square feet of gross leasable area (“GLA”), and with $7.7 billion invested primarily
in MOBs. HTA provides real estate infrastructure for the integrated delivery of healthcare services in highly-desirable locations. Investments
are targeted to build critical mass in 20 to 25 leading gateway markets that generally have leading university and medical institutions, which
generally translates to superior demographics, highly-educated graduates, intellectual talent and job growth. The strategic markets HTA
invests in support a strong, long-term demand for quality medical office space. HTA utilizes an integrated asset management platform
consisting of on-site leasing, property management, engineering and building services, and development capabilities to create complete,
state of the art facilities in each market. We believe this drives efficiencies, strong tenant and health system relationships, and strategic
partnerships that result in high levels of tenant retention, rental growth and long-term value creation. Headquartered in Scottsdale, Arizona,
HTA has developed a national brand with dedicated relationships at the local level.
Founded in 2006 and listed on the New York Stock Exchange in 2012, HTA has produced attractive returns for its stockholders that have
outperformed the US REIT index. More information about HTA can be found on the Company’s Website (www.htareit.com), Facebook,
LinkedIn, Instagram and Twitter.

Senior Management

Peter N. Foss I Interim President and Chief Executive Officer
Robert A. Milligan I Chief Financial Officer, Secretary and Treasurer
Amanda L. Houghton I Executive Vice President - Asset Management
David A. Gershenson I Chief Accounting Officer
Caroline E. Chiodo I Senior Vice President - Acquisitions and Development
Brock J. Cusano | Senior Vice President - Operations

Contact Information

Corporate Headquarters
Healthcare Trust of America, Inc. I NYSE: HTA
16435 North Scottsdale Road, Suite 320
Scottsdale, Arizona 85254
480.998.3478
www.htareit.com

Follow Us:
Investor Relations
Robert A. Milligan I Chief Financial Officer, Secretary and Treasurer
16435 North Scottsdale Road, Suite 320
Scottsdale, Arizona 85254
480.998.3478
info@htareit.com

Transfer Agent
Computershare
P.O. Box 505000
Louisville, KY 40233
888.801.0107

                                                                                                              3Q 2021 I Supplemental Information
                                                                                                              Healthcare Trust of America, Inc. I 3
HTA: LARGEST DEDICATED OWNER OF MEDICAL OFFICES

      $7.7B                     ~25.8M GLA                              240%                       BBB/Baa2
                                                                TOTAL SHAREHOLDER                 INVESTMENT GRADE
GROSS INVESTMENTS              ACROSS 465 BUILDINGS                  RETURNS
                                                                    (Since December 2006)
                                                                                                    BALANCE SHEET

                                  BEST IN CLASS PORTFOLIO FOCUSED
                                         IN 20-25 KEY MARKETS

                                                The HTA Difference

Industry Leading Portfolio: Core, critical MOBs where healthcare demand is growing: on-campus, core community
outpatient, and academic locations. With limited ground lease restrictions.

Key Market Focus: Investing in high growth markets where we can achieve operational scale. 10 markets of ~1MM
square feet of GLA and 17 markets >500k square feet of GLA.

Unique, Vertically Integrated Operating Platform: The strength of a dedicated, national platform delivering tenant
satisfaction, performance and growth in our key markets.

Strong and Diverse Tenant Base: Partnered with leading healthcare providers in our markets. ~74% of tenants are
Health Systems or National/Regional providers. 60% of tenants are credit rated or affiliated with credit rated parties.

Steady and Consistent Performance: Delivering earnings growth to the bottom line, even during COVID.

Dividend Growth: Only MOB REIT to raise dividend in each of the last 8 years.

Investment Grade Balance Sheet: HTA believes its $1.2 billion in liquidity and low leverage positions it for future
growth and stability.

                                                                                                 3Q 2021 I Supplemental Information
                                                                                                 Healthcare Trust of America, Inc. I 4
FINANCIAL PERFORMANCE: HISTORY OF VALUE CREATION
Normalized FFO/Share Same Store Growth
$0.45 4%
$0.44 $0.44 $0.44
$0.43 $0.43
$0.42 $0.42 $0.42 $0.42 $0.42 $0.42
$0.41 $0.41 $0.41 $0.41 $0.41 $0.41 3.2%
3% 3.1%
$0.40 $0.40 2.4%
2.9% 2.9% 2.9% HTA
$0.4 2.8%
$0.39 2.7% 2.7% 2.7% Avg.
2.6%
2.5% 2.5% 2.5% 2.5% 2.5% 2.3%
2.3% REIT
2% MOB
2.1%
Avg.
1.6%
$0.35
1%
0.6%
0.5%
$0.3 0%
4Q16 1Q17 2Q17 3Q17 4Q17 1Q18 2Q18 3Q18 4Q18 1Q19 2Q19 3Q19 4Q19 1Q20 2Q20 3Q20 4Q20 1Q21 2Q21 3Q21 4Q16 1Q17 2Q17 3Q17 4Q17 1Q18 2Q18 3Q18 4Q18 1Q19 2Q19 3Q19 4Q19 1Q20 2Q20 3Q20 4Q20 1Q21 2Q21 3Q21
DELIVERING SHAREHOLDER VALUE
8.3% Annualized Average Total Returns Since First Distribution in 2006 to September 30, 2021
Top MOB Tenants Steady & Growing Dividend $0.325
» AdventHealth » Harbin Clinic $0.320
$0.32
$0.315
» Ascension » HCA Healthcare
$0.310
» Atrium Health » Highmark-Allegheny Health Network
$0.305
» Baylor Scott & White Health » Mercy Health $0.300
$0.3
» Boston Medical Center » Steward Health Care
» CommonSpirit Health » Tenet Healthcare Corporation
» Community Health Network » Tufts Medical Center
$0.28
» Community Health Systems » UNC Health Care
4Q16 1Q17 2Q17 3Q17 4Q17 1Q18 2Q18 3Q18 4Q18 1Q19 2Q19 3Q19 4Q19 1Q20 2Q20 3Q20 4Q20 1Q21 2Q21 3Q21
3Q 2021 I Supplemental Information
Healthcare Trust of America, Inc. I 5Company Overview
Recent Highlights
Third Quarter 2021 Highlights:
• Reported net income attributable to common stockholders of $0.10 per diluted share.
• Reported Funds From Operations (“FFO”), as defined by NAREIT, of $0.44 per diluted share, an increase of 41.9% compared
to Q3 2020.
• Reported Normalized FFO of $0.44 per diluted share, an increase of 2.3% compared to Q3 2020, which includes the impact
of costs related to the whistleblower investigation and leadership transition.
• Reported Normalized FAD of $77.8 million, a decrease of 5.7% compared to Q3 2020.
• Reported Same-Property Cash Net Operating Income (“NOI”) growth of 2.5% compared to Q3 2020.
Year-to-date 2021:
• Reported net income attributable to common stockholders of $81.7 million, or $0.37 per diluted share.
• Reported FFO of $1.31 per diluted share, an increase of 15.9% compared to 2020.
• Reported Normalized FFO of $1.32 per diluted share, an increase of 3.1% compared to 2020.
• Reported Normalized FAD of $247.5 million, an increase of 4.3% compared to 2020.
Portfolio Performance
• As of September 30, 2021, our portfolio’s leased rate increased 40 bps from 89.3% as of Q2 2021 to 89.7% by gross
leasable area (“GLA”) and an occupancy rate of 88.0% by GLA.
• During Q3 2021, HTA executed leases of 670 thousand square feet of GLA, including 227 thousand square feet of GLA in
new leases and 443 thousand square feet of GLA in renewals. Re-leasing spreads were 2.9% and tenant retention for the
Same-Property portfolio was 83% by GLA.
• Year-to-date, HTA executed leases of approximately 2.0 million square feet of GLA, including 586 thousand square feet of
GLA in new leases and 1.4 million square feet of GLA in renewals. Re-leasing spreads were 2.7% and tenant retention for
the Same-Property portfolio was 76% by GLA.
Investment Activity
• During Q3 2021, HTA closed on four medical office building investments totaling $135 million with 469,000 square feet of GLA
at anticipated in-place year one yields of 5.7%, increasing market densification in HTA's existing key markets. Subsequent to
quarter end, HTA closed on a medical office portfolio encompassing two medical office buildings and a garage for $66 million
spanning 293,000 square feet of GLA. As of today, HTA has closed on $248 million of medical office investments totaling
920,000 square feet of GLA with an additional $93 million of investments encompassing more than 260,000 square feet of
GLA under contract or exclusive letters of intent, subject to customary closing conditions, expected to close in the fourth
quarter.
• For the year, HTA anticipates 2021 investment activity to total over $400 million, which includes $342 million of medical office
investments closed or under exclusive letters of intent, and $69 million in loan funding commitments to projects in the Texas
Medical Center in Houston.
• From a development perspective, HTA's existing projects have all been completed as scheduled. In the third quarter, HTA
completed core and shell construction on its 109,000 square feet Class A medical office development located on HCA's new
Medical City Heart & Spine Hospital in Dallas, TX. This building is currently 74% pre-leased with cash rents expected to
commence in the fourth quarter of 2021.
HTA's development pipeline consists of five projects in the pre-leasing process, totaling over 850 thousand square feet of
GLA. These projects are located in Houston, Orlando and Raleigh and are highlighted by HTA's previously announced
strategic partnership with Medistar Corporation to co-develop the Texas A&M Innovation Plaza - Horizon Tower located in
Houston, Texas, a 485,000 square foot medical office and life sciences tower with anticipated costs of $215 million expected
to commence construction in 2022.
• For the nine months ending September 30, 2021, we closed on the disposition of 14 MOBs in non-key markets with a gross
sales price of $68.1 million, resulting in a net gain on sale of approximately $32.9 million. Subsequent to September 30,
2021, we closed on the sale of one MOB in Ohio for a gross sales price of $20.2 million at a cap rate of 4.2%.
3Q 2021 I Supplemental Information
Healthcare Trust of America, Inc. I 6Company Overview
Recent Highlights Cont'd
Capital Activity and Liquidity
• HTA ended Q3 2021 with total leverage of (i) 31.4%, measured as debt less cash and cash equivalents to total capitalization,
and (ii) 6.2x net debt to Adjusted Earnings before Interest, Taxes, Depreciation and Amortization for real estate (“Adjusted
EBITDAre”). Including the impact of the unsettled forward equity agreements, leverage would be 29.2% and 5.8x,
respectively.
• HTA ended Q3 with total liquidity of $1.2 billion, inclusive of $950.0 million available on our unsecured revolving credit facility,
$218.8 million of unsettled equity forward transactions, and $12.8 million of cash and cash equivalents and $1.7 million of
restricted cash for funds held in a 1031 exchange account.
• As of the end of the quarter, HTA had $218.8 million of equity, based on an average initial forward price of $29.49 per share,
to be settled on a forward basis with the issuance of approximately 7.4 million shares of common stock, subject to adjustment
for costs to borrow under the terms of the applicable equity distribution agreements.
Subsequent Events
• Other Investment: On October 1, 2021, HTA made a $6 million investment in Series A Preferred Stock of Pivotal Analytics,
Inc. (“Pivotal”), a data analytics platform. Pivotal’s proprietary model integrates demographic data and provider-specific,
point-of service claims data from various sources to allow its users to anticipate trends in healthcare, including insight into
patient demand and corresponding provider mix in virtually all geographic areas across the United States. As an early
adopter and minority investor of this operational platform, we have the exclusive ability to steer the platform to best suit our
needs as an owner of medical office space. With this investment, we have further enhanced our capability to serve our
healthcare tenants by allowing for programmatic portfolio management through targeting and anticipating space needs in our
existing locations, assisting in identifying opportunities for new ground-up development and redevelopments, and supporting
us in the evaluation and underwriting of acquisitions.
• Debt: On October 6, 2021, HTA entered into a third amended and restated $1.3 billion revolving credit and term loan
agreement, refinancing the existing $1.3 billion unsecured credit agreement, lowering HTA's borrowing costs and extending
maturities to October 2025. Based on HTA's current investment grade ratings, the revolving credit agreement will initially be
priced at LIBOR plus 105 bps, inclusive of a 20 bps facility fee, and the term loan will initially be priced at LIBOR plus 95 bps.
The credit agreement also includes a sustainability-linked feature, which allows for a reduction in pricing based on HTA's
realization of certain sustainability ratings.
• Dividends: On November 4, 2021, HTA’s Board of Directors announced a quarterly cash dividend of $0.325 per share of
common stock, and per Healthcare Trust of America Holdings, LP Operating Partnership Unit, to be paid on January 11, 2022
to stockholders and unitholders of record on January 4, 2022.
2021 Guidance:
HTA updates its 2021 guidance range as follows:
Annual Expectations
Low to High
Net income attributable to common stockholders per share $ 0.44 $ 0.48
Same-Property Cash NOI 2.0 % 2.5 %
FFO per share, as defined by NAREIT $ 1.73 $ 1.77
Normalized FFO per share $ 1.75 $ 1.77
The 2021 guidance includes the following additional assumptions:
• $400 - $500 million of investments at an average 5.5% to 6.0% yield;
• $88 - $125 million of dispositions at a 5.0% to 6.5% yield;
• general and administrative costs of $43 - $46 million;
• average fully diluted shares of between 224 and 225 million fully diluted shares of common stock outstanding, with proceeds
from equity previously raised on a forward basis being utilized to fund acquisitions as they close; and
• developments being substantially completed as planned.
• The lower end of the range assumes settlement of forward equity agreements without deployment of cash proceeds for
investments.
• HTA expects leverage, measured as (i) debt less cash and cash equivalents to total capitalization, and (ii) measured as debt
less cash and cash equivalents to Adjusted EBITDAre to range between 5.5x and 6.0x throughout the year.
HTA’s 2021 guidance is based on a number of assumptions that are subject to change and many of which are beyond HTA’s control.
Additionally, HTA’s guidance does not contemplate impacts from gains or losses from dispositions, potential impairments, or debt
extinguishment costs, if any. If actual results vary from these assumptions, HTA’s expectations may change. There can be no
assurance that HTA will achieve these results.
3Q 2021 I Supplemental Information
Healthcare Trust of America, Inc. I 7Company Overview
Financial Highlights
(unaudited and dollars in thousands, except per share data)
Three Months Ended
3Q21 2Q21 1Q21 4Q20 3Q20
INCOME ITEMS
Revenues $ 191,262 $ 188,615 $ 191,493 $ 187,018 $ 187,326
NOl (1)(2) 131,694 131,206 131,914 130,469 130,078
(1)(3)
Adjusted EBITDAre, annualized 491,156 496,792 505,952 496,776 489,928
FFO (1)(3) 97,280 96,789 97,849 95,330 68,489
(1)(3)
Normalized FFO 97,787 97,583 98,308 96,450 96,235
(1)(3)
Normalized FAD 77,762 80,976 88,758 80,284 82,419
Net income attributable to
common stockholders per diluted share $ 0.10 $ 0.17 $ 0.10 $ 0.13 $ (0.03)
FFO per diluted share 0.44 0.44 0.44 0.43 0.31
Normalized FFO per diluted share 0.44 0.44 0.44 0.43 0.43
Same-Property Cash NOI growth (4) 2.5% 2.1% 1.6% 2.5% 0.5%
Fixed charge coverage ratio (5) 5.05x 5.07x 5.06x 4.94x 4.82x
As of
3Q21 2Q21 1Q21 4Q20 3Q20
ASSETS
Gross real estate investments $ 7,861,336 $ 7,845,368 $ 7,809,702 $ 7,812,884 $ 7,636,402
Total assets 6,775,631 6,725,404 6,696,591 6,790,692 6,774,572
CAPITALIZATION
Net debt (6) $ 3,064,628 $ 2,988,662 $ 2,997,742 $ 2,911,592 $ 2,799,396
(7)
Total capitalization 9,754,767 8,924,659 9,129,686 9,028,171 8,573,996
Net debt/total capitalization (6) 31.4% 33.5% 32.8% 32.3% 32.6%
(1) Refer to pages 24 and 25 for the reporting definitions of NOI, Adjusted EBITDAre, FFO, Normalized FFO and Normalized FAD.
(2) Refer to page 16 for a reconciliation of GAAP Net Income to NOI.
(3) Refer to page 13 for the reconciliations of GAAP Net Income Attributable to Common Stockholders to FFO, Normalized FFO, Normalized FAD and Adjusted EBITDAre.
(4) Calculated as the increase in Same-Property Cash NOI for the quarter as compared to the same period in the previous year.
(5) Calculated as Adjusted EBITDAre divided by interest expense and scheduled principal payments.
(6) Refer to page 15 for components of net debt.
(7) Calculated as the common stock price on the last trading day of the period multiplied by the total diluted common shares outstanding at the end of the period, plus net debt.
Refer to page 15 for details.
3Q 2021 I Supplemental Information
Healthcare Trust of America, Inc. I 8Company Overview
Company Snapshot
(as of September 30, 2021)
Investments in Real Estate (1) $ 7.7
Total portfolio GLA (2) 25.8
Leased rate (3) 89.7%
Same-Property portfolio tenant retention rate (YTD) (4) 76%
% of GLA managed internally 96%
% of GLA on-campus/adjacent 67%
% of invested dollars in key markets in top 75 MSAs (5) 95%
Weighted average remaining lease term for all buildings (6) 5.3
Weighted average remaining lease term for single-tenant buildings (6) 5.9
(6)
Weighted average remaining lease term for multi-tenant buildings 5.0
Credit ratings (Standard & Poor’s/Moody’s) BBB(Stable)/Baa2(Stable)
Cash and cash equivalents (2) $ 12.8
Net debt/total capitalization 31.4%
Weighted average interest rate per annum on portfolio debt (7) 2.86%
Building Type Presence in Top MSAs (8)
% of Portfolio (based on GLA) % of Portfolio (based on annualized base rent)
Hartford/New
Medical Office Buildings Haven, CT Atlanta, GA
95% Indianapolis, IN 4.4% 4.4%
4.5% Phoenix, AZ
4.4%
Miami, FL
Tampa, FL
5.4%
4.2%
Pittsburgh, PA
Boston, MA 3.5%
6.3%
Houston, TX
Senior Care 6.7%
1%
Hospitals
4%
Dallas, TX
9.5%
Remaining Top
All Other Markets MSAs
5.3% 41.4%
(1) Amount presented in billions. Refer to page 24 for the reporting definition of Investments in Real Estate.
(2) Amounts presented in millions. Total portfolio GLA excludes GLA for projects under development and includes 100% of the GLA of its unconsolidated joint venture.
(3) Calculations are based on percentage of total GLA, excluding GLA for development properties.
(4) Refer to page 25 for the reporting definition of Retention.
(5) Refer to page 24 for the reporting definition of Metropolitan Statistical Area.
(6) Amounts presented in years.
(7) Includes the impact of cash flow hedges.
(8) Refer to page 20 for a detailed table of HTA’ s Key Markets in Top 75 MSA Concentration.
3Q 2021 I Supplemental Information
Healthcare Trust of America, Inc. I 9Financial Statements
Condensed Consolidated Balance Sheets
(unaudited and in thousands, except share and per share data)
As of
3Q21 4Q20
ASSETS
Real estate investments:
Land $ 625,092 $ 596,269
Building and improvements 6,701,356 6,507,816
Lease intangibles 506,010 628,621
Construction in progress 28,878 80,178
7,861,336 7,812,884
Accumulated depreciation and amortization (1,747,354) (1,702,719)
Real estate investments, net 6,113,982 6,110,165
Assets held for sale, net 27,049 —
Investment in unconsolidated joint venture 63,213 64,360
Cash and cash equivalents 12,836 115,407
Restricted cash 6,628 3,358
Receivables and other assets, net 314,977 251,728
Right-of-use assets - operating leases, net 227,564 235,223
Other intangibles, net 9,382 10,451
Total assets $ 6,775,631 $ 6,790,692
LIABILITIES AND EQUITY
Liabilities:
Debt $ 3,079,190 $ 3,026,999
Accounts payable and accrued liabilities 178,024 200,358
Liabilities of assets held for sale 263 —
Derivative financial instruments - interest rate swaps 9,377 14,957
Security deposits, prepaid rent and other liabilities 82,852 82,553
Lease liabilities - operating leases 195,115 198,367
Intangible liabilities, net 31,473 32,539
Total liabilities 3,576,294 3,555,773
Commitments and contingencies
Equity:
Preferred stock, $0.01 par value; 200,000,000 shares authorized; none issued and outstanding — —
Class A common stock, $0.01 par value; 1,000,000,000 shares authorized; 220,839,006 and
218,578,012 shares issued and outstanding as of September 30, 2021 and December 31,
2020, respectively 2,208 2,186
Additional paid-in capital 4,973,001 4,916,784
Accumulated other comprehensive loss (11,327) (16,979)
Cumulative dividends in excess of earnings (1,857,714) (1,727,752)
Total stockholders’ equity 3,106,168 3,174,239
Non-controlling interests 93,169 60,680
Total equity 3,199,337 3,234,919
Total liabilities and equity $ 6,775,631 $ 6,790,692
3Q 2021 I Supplemental Information
Healthcare Trust of America, Inc. I 10Financial Statements
Condensed Consolidated Statements of Operations
(unaudited and in thousands, except per share data)
Three Months Ended Nine Months Ended
3Q21 3Q20 3Q21 3Q20
Revenues:
Rental income $ 189,832 $ 187,258 $ 569,676 $ 551,459
Interest and other operating income 1,430 68 1,694 488
Total revenues 191,262 187,326 571,370 551,947
Expenses:
Rental 59,568 57,248 176,556 170,310
General and administrative 10,765 10,670 32,254 32,348
Transaction 137 125 299 297
Depreciation and amortization 76,056 75,892 227,307 228,484
Interest expense 23,331 23,136 69,450 71,285
Impairment — — 16,825 —
Total expenses 169,857 167,071 522,691 502,724
Gain on sale of real estate, net 143 — 32,896 1,991
Loss on extinguishment of debt, net — (27,726) — (27,726)
Income from unconsolidated joint venture 400 422 1,198 1,223
Other income 94 117 401 290
Net income (loss) $ 22,042 $ (6,932) $ 83,174 $ 25,001
Net (income) loss attributable to non-controlling interests (370) 105 (1,461) (438)
Net income (loss) attributable to common stockholders $ 21,672 $ (6,827) $ 81,713 $ 24,563
Earnings per common share - basic:
Net income (loss) attributable to common stockholders $ 0.10 $ (0.03) $ 0.37 $ 0.11
Earnings per common share - diluted:
Net income (loss) attributable to common stockholders $ 0.10 $ (0.03) $ 0.37 $ 0.11
Weighted average common shares outstanding:
Basic 218,820 218,549 218,798 217,911
Diluted 222,811 218,549 222,470 221,521
Dividends declared per common share $ 0.325 $ 0.320 $ 0.965 $ 0.950
3Q 2021 I Supplemental Information
Healthcare Trust of America, Inc. I 11Financial Statements
Condensed Consolidated Statements of Cash Flows
(unaudited and in thousands)
Nine Months Ended
3Q21 3Q20
Cash flows from operating activities:
Net income $ 83,174 $ 25,001
Adjustments to reconcile net income to net cash provided by operating activities:
Depreciation and amortization 212,332 211,843
Share-based compensation expense 5,034 7,135
Income from unconsolidated joint venture (1,198) (1,223)
Distributions from unconsolidated joint venture 2,345 2,455
Impairment 16,825 —
Gain on sale of real estate, net (32,896) (1,991)
Loss (gain) on extinguishment of debt, net — 27,726
Changes in operating assets and liabilities:
Receivables and other assets, net (3,214) 3,282
Accounts payable and accrued liabilities (8,755) (11,787)
Security deposits, prepaid rent and other liabilities (2,029) 7,227
Net cash provided by operating activities 271,618 269,668
Cash flows from investing activities:
Investments in real estate (147,303) (52,553)
Development of real estate (48,482) (49,479)
Proceeds from the sale of real estate 67,621 6,420
Capital expenditures (78,047) (59,016)
Collection of real estate notes receivable 15,405 709
Advances on real estate notes receivable (66,526) (6,000)
Net cash used in investing activities (257,332) (159,919)
Cash flows from financing activities:
Borrowings on unsecured revolving credit facility 180,000 1,329,862
Payments on unsecured revolving credit facility (130,000) (1,429,862)
Proceeds from unsecured senior notes — 793,568
Payments on unsecured senior notes — (300,000)
Payments on secured mortgage loans — (114,060)
Deferred financing costs — (6,532)
Debt extinguishment costs — (25,938)
Proceeds from issuance of common stock 53,735 50,020
Issuance of OP Units — 1,378
Repurchase and cancellation of common stock (3,389) (5,094)
Dividends paid (210,047) (205,880)
Distributions paid to non-controlling interest of limited partners (3,886) (3,581)
Net cash (used in) provided by financing activities (113,587) 83,881
Net change in cash, cash equivalents and restricted cash (99,301) 193,630
Cash, cash equivalents and restricted cash - beginning of period 118,765 37,616
Cash, cash equivalents and restricted cash - end of period $ 19,464 $ 231,246
3Q 2021 I Supplemental Information
Healthcare Trust of America, Inc. I 12Financial Information
FFO, Normalized FFO, Normalized FAD and Adjusted EBITDAre
(unaudited and in thousands, except per share data)
FFO, Normalized FFO and Normalized FAD Three Months Ended Nine Months Ended
3Q21 3Q20 3Q21 3Q20
Net income (loss) attributable to common stockholders $ 21,672 $ (6,827) $ 81,713 $ 24,563
Depreciation and amortization expense related to investments in real estate 75,264 74,848 224,814 225,354
Gain on sale of real estate, net (143) — (32,896) (1,991)
Impairment — — 16,825 —
Proportionate share of joint venture depreciation and amortization 487 468 1,462 1,443
FFO attributable to common stockholders $ 97,280 $ 68,489 $ 291,918 $ 249,369
Transaction expenses 137 125 299 297
Loss on extinguishment of debt, net — 27,726 — 27,726
Non-controlling income from OP units included in diluted shares 370 (105) 1,461 438
Other normalizing adjustments (1) — — — 5,031
Normalized FFO attributable to common stockholders $ 97,787 $ 96,235 $ 293,678 $ 282,861
Non-cash compensation expense (368) 1,832 5,034 7,135
Straight-line rent adjustments, net (3,012) (5,711) (10,408) (12,673)
Amortization of (below) and above market leases/leasehold interests and
corporate assets, net 344 599 1,336 504
Amortization of deferred financing costs and debt discount/premium, net 1,156 1,275 3,484 3,262
Recurring capital expenditures, tenant improvements and leasing
commissions (18,145) (11,811) (45,628) (43,744)
Normalized FAD attributable to common stockholders $ 77,762 $ 82,419 $ 247,496 $ 237,345
Net income (loss) attributable to common stockholders per diluted share $ 0.10 $ (0.03) $ 0.37 $ 0.11
FFO adjustments per diluted share, net 0.34 0.34 0.94 1.02
FFO attributable to common stockholders per diluted share $ 0.44 $ 0.31 $ 1.31 $ 1.13
Normalized FFO adjustments per diluted share, net 0.00 0.12 0.01 0.15
Normalized FFO attributable to common stockholders per diluted share $ 0.44 $ 0.43 $ 1.32 $ 1.28
Weighted average diluted common shares outstanding 222,811 222,101 222,470 221,521
Adjusted EBITDAre (2) Three Months
Ended
3Q21
Net income $ 22,042
Interest expense 23,331
Depreciation and amortization expense 76,056
Gain on sale of real estate, net (143)
Proportionate share of joint venture depreciation and amortization 487
EBITDAre $ 121,773
Transaction expenses 137
Non-cash compensation expense (368)
Pro forma impact of investments/dispositions 1,040
Pro forma impact of developments 207
Adjusted EBITDAre $ 122,789
Adjusted EBITDAre, annualized $ 491,156
As of September 30, 2021:
Debt $ 3,079,190
Less: cash and cash equivalents (3) 14,562
Net Debt $ 3,064,628
Net Debt to Adjusted EBITDAre 6.2x
(1) For the nine months ended September 30, 2020, other normalizing adjustments includes the following: non-recurring bad debt of $4,672 thousand; incremental hazard pay to facilities
employees of $314 thousand; and incremental personal protective equipment of $45 thousand.
(2) Refer to page 24 for the reporting definitions of EBITDAre, as defined by NAREIT, and Adjusted EBITDAre.
(3) Cash and cash equivalents includes $1.7M of restricted cash for funds held in a 1031 exchange account pending re-investment.
3Q 2021 I Supplemental Information
Healthcare Trust of America, Inc. I 13Financial Information
Debt Composition and Maturity Schedule
(as of September 30, 2021, dollars in thousands)
Debt Composition
Deferred
Principal Financing (Discounts)/
Balance Costs, Net Premium, Net Total Stated Rate (1) Hedged Rate (2)
Unsecured senior note due 2026 $ 600,000 $ (2,258) $ 5,400 $ 603,142 3.50% 3.50%
Unsecured senior note due 2027 500,000 (2,433) (1,571) 495,996 3.75 3.75
Unsecured senior note due 2030 650,000 (4,553) (1,845) 643,602 3.10 3.10
Unsecured senior note due 2031 800,000 (6,136) (5,873) 787,991 2.00 2.00
Total unsecured senior notes $ 2,550,000 $ (15,380) $ (3,889) $ 2,530,731
Unsecured term loan due 2023 300,000 (626) — 299,374 1.23% 2.52%
Unsecured term loan due 2024 200,000 (915) — 199,085 1.08 2.32
Total unsecured term loans $ 500,000 $ (1,541) $ — $ 498,459
Unsecured revolving credit facility (3) 50,000 — — 50,000 1.13% 1.13%
Total debt $ 3,100,000 $ (16,921) $ (3,889) $ 3,079,190 2.65% 2.86%
Maturity Schedule (4)
$800,000
$800,000
$700,000
$650,000
$600,000
$600,000
$500,000
$500,000
$400,000
$300,000
$300,000
$200,000
$200,000
$100,000
$50,000
$0
2021 2022 2023 2024 2025 2026 2027 2028 2029 2030 2031
Period Ending
Unsecured Revolving Credit Facility Unsecured Senior Notes Unsecured Term Loans
(1) The stated rate on the debt instrument as of the end of the period.
(2) The effective rate incorporates any cash flow hedges that serve to fix variable rate debt, as of the end of the period.
(3) Rate does not include the 20 basis point facility fee that is payable on the entire $1.0 billion revolving credit facility.
(4) Maturity schedule does not reflect a new amended and restated $1.3B Unsecured Revolving Credit Facility and Term Loan Agreement entered into subsequent to
September 30, 2021 maturing in October 2025.
3Q 2021 I Supplemental Information
Healthcare Trust of America, Inc. I 14Financial Information
Capitalization and Covenants
(as of September 30, 2021, dollars and shares in thousands, except stock price)
Capitalization
3Q21
Unsecured revolving credit facility $ 50,000
Unsecured term loans 500,000 Equity
Unsecured senior notes 2,550,000 69%
Secured mortgage loans —
Deferred financing costs, net (16,921)
Discount, net (3,889)
Total debt $ 3,079,190
Less: cash and cash equivalents (1) 14,562
Net debt $ 3,064,628
Stock price (as of September 30, 2021) $ 29.66
Total diluted common shares outstanding 225,561
Unsecured
Equity capitalization $ 6,690,139 Debt
31%
Total capitalization $ 9,754,767
Total undepreciated assets $ 8,522,985
Gross book value of unencumbered assets $ 8,012,020
Total debt/undepreciated assets 36.1%
Net debt/total capitalization 31.4%
Available Capital:
Unsecured Revolving Credit Facility $ 949,690
Outstanding Forward Equity 218,800
Cash and Cash Equivalents 12,836
Restricted Cash (1031 Exchange Funds) 1,726
Total Available Capital: $ 1,183,052
Covenants
Bank Loans (2) Required 3Q21 Senior Notes Required 3Q21
Total leverage ≤ 60% 38% Total leverage ≤ 60% 37%
Secured leverage ≤ 30% 0%
Secured leverage ≤ 40% 0%
Fixed charge coverage ≥ 1.50x 5.05x
Unencumbered asset coverage ≥ 150% 267%
Unencumbered leverage ≤ 60% 38%
Unencumbered coverage ≥ 1.75x 5.49x Interest coverage ≥ 1.50x 5.12x
(1) Cash and cash equivalents includes $1.7M of restricted cash for funds held in a 1031 exchange account pending re-investment.
(2) Covenant calculations for the Bank Loans effective as of September 30, 2021. Subsequent to September 30, 2021 the unsecured term loan due 2023 was amended and
restated. Modifications to the covenant calculations reflected in the amended term loan agreement resulted in total leverage of 36%, unencumbered leverage of 36%, and
unencumbered coverage of 5.22x. All other covenant calculations remained unchanged.
3Q 2021 I Supplemental Information
Healthcare Trust of America, Inc. I 15Portfolio Information
Same-Property Performance and NOI
(as of September 30, 2021, unaudited and dollars and GLA in thousands)
Same-Property Performance
Three Months Ended Sequential Year-Over-Year
3Q21 2Q21 3Q20 $ Change % Change $ Change % Change
Rental revenue $ 127,601 $ 126,971 $ 124,727 $ 630 0.5% $ 2,874 2.3%
Tenant recoveries 38,556 38,427 37,971 129 0.3 585 1.5
Total rental income 166,157 165,398 162,698 759 0.5 3,459 2.1
Expenses 50,999 49,342 50,382 1,657 3.4 617 1.2
Same-Property Cash NOI $ 115,158 $ 116,056 $ 112,316 $ (898) (0.8%) $ 2,842 2.5%
Rental Margin (1) 90.2% 91.4% 90.0%
As of
3Q21 2Q21 3Q20
Number of buildings 421 421 421
GLA 22,326 22,324 22,319
Leased GLA, end of period 20,191 20,106 20,315
Leased %, end of period 90.4% 90.1% 91.0%
Occupancy GLA, end of period 19,919 19,914 20,233
Occupancy %, end of period 89.2% 89.2% 90.7%
NOI (2) Three Months Ended
3Q21 3Q20
Net income $ 22,042 $ (6,932)
General and administrative expenses 10,765 10,670
Transaction expenses 137 125
Depreciation and amortization expense 76,056 75,892
Interest expense 23,331 23,136
(Gain) loss on sale of real estate, net (143) —
(Gain) loss on extinguishment of debt, net — 27,726
Income from unconsolidated joint venture (400) (422)
Other income (94) (117)
NOI $ 131,694 $ 130,078
NOI percentage growth 1.2%
NOI $ 131,694 $ 130,078
Straight-line rent adjustments, net (3,012) (5,711)
Amortization of (below) and above market leases/leasehold interests, net and other GAAP
adjustments (538) (113)
Notes receivable interest income (1,264) (11)
Cash NOI $ 126,880 $ 124,243
Acquisitions not owned/operated for all periods presented and disposed properties Cash NOI (5,245) (2,245)
Redevelopment Cash NOI (116) (1,043)
Intended for sale Cash NOI (6,361) (8,639)
Same-Property Cash NOI $ 115,158 $ 112,316
Same-Property Cash NOI percentage growth 2.5%
(1) Rental margin presents Same-Property Cash NOI divided by Same-Property rental revenue.
(2) Refer to pages 24 and 25 for the reporting definitions of NOI, Cash NOI and Same-Property Cash NOI.
3Q 2021 I Supplemental Information
Healthcare Trust of America, Inc. I 16Portfolio Information
Investment Activity
(as of September 30, 2021, dollars and GLA in thousands)
2021 Investments
Date
Acquired/ % Leased at
Property Market Invested Acquisition Purchase Price (1) GLA
Acquisitions:
Mt. Carmel East MOB Columbus, OH January 92% $ 16,225 75
Duke Medical Plaza Raleigh, NC March 100 16,300 42
East Cooper MOB Charleston, SC April 100 20,000 40
Austin Bluffs MOB Colorado Springs, CO August 77 16,020 100
Twelve Oaks MOB Houston, TX August 71 26,000 140
Clint Moore Medical Facility Boca Raton, FL August 100 50,000 102
Houston Medical Center Houston, TX August 86 43,000 127
Total Acquisitions 187,545 626
Texas Medical Center Notes (2) Houston, TX June 53,672 —
Total Investments $ 241,217 626
2021 Dispositions
Property Market Date Disposed Sales Price GLA
Ballad Portfolio (13 buildings) Tennessee and Virginia May $ 67,500 410
Gallery Professional Building St. Paul, MN September 600 108
Total $ 68,100 518
Annual Investment Activity (3)
As of September 30, 2021, HTA has invested $7.7 billion primarily in MOBs, development properties and other healthcare assets comprising 25.8 million
square feet of GLA.
Annual Investment Activity
$2,800,000
$2,722,467
$2,450,000
$2,100,000
$1,750,000
$1,400,000
$1,050,000
$700,000 $802,148
$700,764
$542,976 $557,938
$350,000 $413,150 $455,950 $439,530
$397,826
$294,937 $271,510 $17,729
$191,963 $187,545
$0 $68,314
$(82,885) $(35,685) $(39,483) $(85,150) $(4,900) $(24,310) $(68,100)
$(308,550)
$-350,000
2007 2008 2009 2010 2011 2012 2013 2014 2015 2016 2017 2018 2019 2020 2021
Acquisitions Dispositions
(1) Excludes corporate assets and land only purchases.
(2) Represents mezzanine and mortgage notes funded through September 30, 2021. HTA has real estate loan commitments totaling $69,119, of which $15,447 was unfunded as of
September 30, 2021.
(3) Excludes real estate note receivables and corporate assets.
3Q 2021 I Supplemental Information
Healthcare Trust of America, Inc. I 17Portfolio Information
Development Activity and Property Capital Expenditures
(as of September 30, 2021, dollars and GLA in thousands)
Completed Development Projects (1)
Total
Total % Construction Completed Costs to Expected
Project MSA GLA Leased Cost Costs Complete Stabilization
Cary MOB Raleigh, NC 127 97 $ 43,897 $ 38,550 $ 5,347 2021
Memorial Hospital MOB Bakersfield, CA 84 90 29,258 27,054 2,204 2021
Jackson South MOB (2) Miami, FL 52 69 21,098 18,307 2,791 2021
(2)
Pavilion III MOB Dallas, TX 109 74 59,608 44,394 15,214 2022
Total Completed Development Projects 372 85 $ 153,861 $ 128,305 $ 25,556
Active Redevelopment Projects
Total
Total % Construction Costs to Estimated
Project MSA GLA Leased Cost LTD Costs (3) Complete Completion
Redevelopment:
Mission Medical Center Bldgs I & II Los Angeles, CA 105 27 22,087 21,041 1,046 2Q21
Westminster MOB Denver, CO 37 100 5,081 4,911 170 2Q21
Houston Methodist Houston, TX 49 63 6,684 6,223 461 3Q21
Total Active Redevelopment Projects 191 50 $ 33,852 $ 32,175 $ 1,677
Property Capital Expenditures Three Months Ended Nine Months Ended
3Q21 3Q21
Recurring capital expenditures $ 6,891 $ 15,857
Tenant improvements - 2nd generation 8,879 23,123
Lease commissions 2,375 6,648
Total recurring capital expenditures $ 18,145 $ 45,628
Capital expenditures - 1st generation/acquisition 5,563 12,484
Capital expenditures/tenant improvements - redevelopment 1,475 7,483
Tenant improvements - 1st generation/acquisition 1,146 4,168
Total capital expenditures incurred $ 26,329 $ 69,763
During the three and nine months ended September 30, 2021, approximately $1.0 million and $3.3 million of capital expenditures were incurred related to
environmental, sustainability or other conservation initiatives.
(1) HTA currently has five additional development projects at various stages of the pre-leasing phase, totaling over 850 thousand square feet of GLA with anticipated costs of over
$375 million.
(2) Annual Cash NOI upon full stabilization of recently completed development projects is expected to approximate $4.9 million. Costs to complete primarily represent tenant
improvements pending completion.
(3) Represents Life-to-Date (LTD) incremental construction costs for assets that have not been placed in service and excludes existing book value of development and
redevelopment assets.
3Q 2021 I Supplemental Information
Healthcare Trust of America, Inc. I 18Portfolio Information
Net Asset Value Components
(as of September 30, 2021, in thousands)
Cash NOI
3Q21 Incremental 3Q21 Annualized
Timing/Other NOI Upon Adjusted Adjusted
Cash NOI Adjustments (1) Stabilization (3) Cash NOI Cash NOI
Same-Store Cash NOI $ 115,158 $ — $ — $ 115,158 $ 460,632
(2)
Acquisitions/Dispositions Cash NOI 5,212 1,040 — 6,252 25,008
Unstabilized development assets Cash NOI 33 207 974 1,214 4,856
Intended for sale Cash NOI 6,361 — — 6,361 25,444
Redevelopment Cash NOI 116 (116) — — —
Total $ 126,880 $ 1,131 $ 974 $ 128,985 $ 515,940
Other Assets
Cash and cash equivalents and restricted cash $ 19,464
(4)
Receivables and other assets 117,917
Investment in unconsolidated joint venture 63,213
Redevelopment LTD costs (5) 32,175
Book value of redevelopment assets (6) 177,962
Land parcels held for development 31,991
Total $ 442,722
Obligations
Unsecured revolving credit facility $ 50,000
Unsecured term loans 500,000
Unsecured senior notes 2,550,000
Total debt $ 3,100,000
Accounts payable and accrued liabilities (7) 104,717
Security deposits, prepaid rent and other liabilities (8) 67,397
Total $ 3,272,114
Total Shares Outstanding
Total Diluted Common Shares Outstanding 222,811
(1) Timing and other adjustments include the pro forma impact of current quarter acquisitions and dispositions, the pro forma impact of development properties, as well as the
elimination of Cash NOI for redevelopment assets.
(2) Represents Cash NOI on acquisitions not owned/operated for all periods presented and disposed properties Cash NOI.
(3) Represents incremental Cash NOI on recently completed and unstabilized development assets only. Anticipated incremental Cash NOI upon stabilization of development and
redevelopment assets will be determined upon substantial completion of construction and/or stabilization.
(4) Includes tenant receivables of $7,460, other receivables of $6,106, prepaid expenses, deposits, equipment and other of $51,240 and real estate notes receivable, net of $53,111.
(5) Represents LTD costs on active redevelopment projects only.
(6) Represents existing book value on redevelopment assets not included in LTD costs, for which Cash NOI is excluded from 3Q21 Adjusted Cash NOI. Amount includes book value of
six properties undergoing substantial tenant improvement activities or in a pre-construction phase not included in Active Redevelopment Projects on page 18 in addition to three
Active Redevelopment Projects included on page 18. Amount does not include book value of unstabilized development assets or a recently completed development.
(7) Excludes accrued dividend distributions of $73,307 which represents our quarterly dividend being declared in one quarter and paid in the next. This accrual is excluded for
purposes of calculating net asset value to provide comparability to REIT peers whose dividends are declared and paid within the same quarter.
(8) Excludes finance right-of-use liability of $15,455.
3Q 2021 I Supplemental Information
Healthcare Trust of America, Inc. I 19Portfolio Information
Key Markets in Top 75 MSA Concentration
(as of September 30, 2021, dollars and GLA in thousands)
Key Markets in Top 75 MSA Concentration (1)
% of
Annualized Annualized Total GLA % of
Key Markets Base Rent (2) Base Rent (3)
% of Portfolio Investment Investment
Dallas, TX $ 54,430 9.5% 2,209 8.6% $ 907,237 11.8%
Houston, TX 38,462 6.7 1,935 7.5 534,869 6.9
Boston, MA 36,152 6.3 965 3.7 397,693 5.2
Miami, FL 30,654 5.4 1,329 5.2 358,449 4.7
Indianapolis, IN 25,843 4.5 1,396 5.4 281,768 3.7
Hartford/New Haven, CT 25,113 4.4 1,165 4.5 347,104 4.5
Atlanta, GA 25,058 4.4 1,121 4.3 338,886 4.4
Phoenix, AZ 24,884 4.4 1,313 5.1 267,781 3.5
Tampa, FL 24,289 4.2 954 3.7 347,764 4.5
Pittsburgh, PA 20,111 3.5 1,094 4.2 148,612 1.9
Charlotte, NC 19,237 3.4 922 3.6 214,887 2.8
Raleigh, NC 19,174 3.3 790 3.1 228,105 3.0
Orange County/Los Angeles, CA 17,234 3.0 719 2.8 326,070 4.2
New York, NY 15,626 2.7 615 2.4 256,144 3.3
Albany, NY 15,015 2.6 833 3.2 170,071 2.2
Chicago, IL 13,711 2.4 454 1.8 231,178 3.0
Denver, CO 13,473 2.4 607 2.4 265,807 3.4
Orlando, FL 12,752 2.2 513 2.0 156,300 2.0
Austin, TX 9,188 1.6 409 1.6 164,425 2.1
El Paso, TX 9,103 1.6 476 1.8 121,409 1.6
Top 20 MSAs 449,509 78.5 19,819 76.9 6,064,559 78.7
Additional Top MSAs 92,676 16.2 4,541 17.6 1,248,686 16.2
Total Key Markets in Top 75
MSAs $ 542,185 94.7% 24,360 94.5% $ 7,313,245 94.9%
All Other Markets 30,275 5.3 1,427 5.5 389,851 5.1
Total All Markets $ 572,460 100% $ 25,787 100% $ 7,703,096 100%
(1) Key markets are titled as such based on HTA’s concentration in the respective MSA
(2) Refer to page 24 for the reporting definition of Annualized Base Rent.
(3) Total portfolio GLA excludes GLA of projects under development and includes 100% of the GLA of its unconsolidated joint venture.
3Q 2021 I Supplemental Information
Healthcare Trust of America, Inc. I 20Portfolio Information
Portfolio Diversification by Type, Historical Campus Proximity and Ownership Interests
(as of September 30, 2021, dollars and GLA in thousands, except as otherwise noted)
Portfolio Diversification by Building Type
% of
Number of Number of Annualized Annualized % of Total
Buildings States Base Rent (1) Base Rent Total GLA (2) GLA
Medical Office Buildings
Single-tenant 127 18 $ 140,135 24.5% 5,817 22.5%
Multi-tenant 320 32 394,075 68.8 18,661 72.4
Other Healthcare Facilities
Hospitals 15 7 32,464 5.7 954 3.7
Senior care 3 1 5,786 1.0 355 1.4
Total 465 32 $ 572,460 100% 25,787 100%
Portfolio Diversification by Lease Type
% of Total % of
Annualized Annualized Occupied Occupied
Base Rent (1) Base Rent GLA (2) GLA
Triple-net $ 323,932 56.6 % 13,031 57.4 %
Modified gross 153,905 26.9 6,141 27.0
Absolute net 53,232 9.3 1,917 8.4
Full-service gross 41,391 7.2 1,599 7.0 %
Total $ 572,460 100 % 22,688 100 %
Historical Campus Proximity (3)
As of
3Q21 2Q21 1Q21 4Q20 3Q20
Off-Campus Aligned 26% 26% 26% 26% 26%
On-Campus 67 67 67 67 67
On-Campus/Aligned 93% 93% 93% 93% 93%
Off-Campus/Non-Aligned 7 7 7 7 7
Total 100% 100% 100% 100% 100%
Ownership Interests (4)
% of As of (5)
Number of Annualized Annualized
Buildings Base Rent (1) Base Rent GLA (2) 3Q21 2Q21 1Q21 4Q20 3Q20
Fee Simple 321 $ 360,386 63 % 16,227 63% 62% 62% 62% 63%
Customary Health System
Restrictions 137 202,837 35 9,191 36 36 36 36 36
Economic with Limited
Restrictions 6 8,770 2 334 1 2 2 2 1
Occupancy Health System
Restrictions 1 467 — 35 — — — — —
Leasehold Interest Subtotal 144 212,074 37 9,560 37 38 38 38 37
Total 465 $ 572,460 100% 25,787 100% 100% 100% 100% 100%
(1) Refer to page 24 for the reporting definition of Annualized Base Rent.
(2) Total portfolio and total occupied GLA excludes GLA of projects under development and includes 100% of the GLA of its unconsolidated joint venture.
(3) Percentages shown as percent of total GLA. Refer to page 25 for the reporting definitions of Off-campus/Non-Aligned and On-Campus/Aligned.
(4) Refer to pages 24 and 25 for the reporting definitions of Customary Health System Restrictions, Economic with Limited Restrictions, and Occupancy Health System Restrictions.
(5) Percentages shown as percent of total GLA.
3Q 2021 I Supplemental Information
Healthcare Trust of America, Inc. I 21Portfolio Information
New and Renewal Leasing Activity, Historical Leased Rate and Tenant Lease Expirations
(as of September 30, 2021, dollars and GLA in thousands)
New and Renewal Leasing Activity
Average Base Rent (2) Tenant Leasing
(1)
Total GLA Average Term Expiring Starting Improvements (2) Commissions (2)
1Q 2021
New Leases 209 4.4 $ 22.72 $ 22.34 $ 3.63
Renewal Leases 496 4.2 $ 24.92 25.69 5.03 2.21
Total 1Q 2021 705 4.2 $ 24.75 $ 10.32 $ 2.64
2Q 2021
New Leases 150 7.3 $ 24.96 $ 36.63 $ 4.31
Renewal Leases 497 3.6 $ 24.32 24.83 5.26 2.06
Total 2Q 2021 647 4.5 $ 24.86 $ 12.56 $ 2.58
3Q 2021
New Leases 227 7.1 $ 24.59 $ 43.87 $ 6.47
Renewal Leases 443 4.5 $ 22.85 23.52 11.04 2.27
Total 3Q 2021 670 5.4 $ 23.89 $ 22.93 $ 3.83
YTD 2021
New Leases 586 6.2 $ 24.02 $ 34.35 $ 4.90
Renewal Leases 1,436 4.1 $ 24.06 24.71 6.99 2.17
Total YTD 2021 2,022 4.7 $ 24.50 $ 15.16 $ 3.01
Historical Leased Rate (3)
As of
3Q21 2Q21 1Q21 4Q20 3Q20
Total portfolio leased rate 89.7% 89.3% 89.2% 89.8% 90.1%
On-campus/aligned leased rate 89.8 89.4 89.3 89.8 90.1
Off-campus/non-aligned leased rate 88.8 87.9 88.7 90.0 90.5
Total portfolio occupancy rate 88.0 87.9 87.9 89.1 89.5
Tenant Lease Expirations
Annualized Base % of Total
Number of Rent of Expiring Annualized Total GLA of % of GLA of
Expiration Expiring Leases Leases (4) Base Rent Expiring Leases (5) Expiring Leases
Month-to-month 138 $ 6,841 1.2% 257 1.1%
2021 121 10,873 1.9 395 1.7
2022 704 63,848 11.2 2,460 10.6
2023 574 60,351 10.5 2,671 11.6
2024 545 67,474 11.8 2,573 11.1
2025 394 54,010 9.4 2,153 9.3
2026 448 49,698 8.7 2,297 9.9
2027 247 63,144 11.0 2,322 10.0
2028 167 33,461 5.9 1,352 5.9
2029 223 43,585 7.6 1,772 7.7
2030 105 30,263 5.3 1,156 5.0
Thereafter 319 88,912 15.5 3,724 16.1
Total 3,985 $ 572,460 100% 23,132 100%
(1) Amounts presented in years.
(2) Amounts presented per square foot of GLA.
(3) Calculations are based on percentage of total GLA, excluding GLA for projects under development, and including 100% of the GLA of its unconsolidated joint venture.
(4) Refer to page 24 for the reporting definition of Annualized Base Rent.
(5) Total portfolio GLA excludes GLA of projects under development and includes 100% of the GLA of its unconsolidated joint venture.
3Q 2021 I Supplemental Information
Healthcare Trust of America, Inc. I 22Portfolio Information
Tenant Profile, Tenant Specialty and Top MOB Tenants
(as of September 30, 2021, dollars and GLA in thousands, except as otherwise noted)
Tenant Profile Tenant Specialty (2)
% of Specialty On-Campus Off-Campus Total
Annualized Annualized
Primary Care (3) 15.4% 17.2% 16.0%
Tenant Classification Base Rent (1) Base Rent
Health Systems/Universities $ 339,796 60% Orthopedics/Sports Medicine 8.7% 9.6% 9.0%
Obstetrics/Gynecology 9.0 3.7 7.2
National/Large Regional Providers 82,224 14
Cardiology 6.4 3.0 5.3
Local Healthcare Providers/Other 150,440 26 Oncology 3.7 2.3 3.2
Total $ 572,460 100% Imaging/Diagnostics/Radiology 3.0 4.9 3.7
Eye and Vision 2.9 3.4 3.1
General Surgery 2.6 3.1 2.7
Other Specialty 35.9 37.5 36.4
Credit Rated Tenancy
Specialty 72.2% 67.5% 70.6%
Investment Grade $ 278,468 49%
Ambulatory Surgery Center 3.7% 5.6% 4.4%
Other Credit Rated 64,061 11
Education/Research 3.1 1.9 2.7
Total Credit Rated $ 342,529 60% Pharmacy 1.1 0.5 0.9
Not Rated/Other 229,931 40 Other 4.5 7.3 5.4
Total $ 572,460 100% Total 100% 100% 100%
Top MOB Tenants (4)
Weighted
Average % of
Remaining Credit Annualized Annualized Total Leased % of Leased
Tenant Lease Term (5) Rating (6) Base Rent (1) Base Rent GLA (7) GLA
Baylor Scott & White Health 5 Aa3 $ 23,618 4.1% 828 3.6%
HCA Healthcare 6 Baa3 19,678 3.4 744 3.2
Highmark-Allegheny Health Network 8 Baa1 17,682 3.1 927 4.0
Tenet Healthcare Corporation 6 B2 14,896 2.6 596 2.6
Ascension 5 Aa2 11,752 2.1 482 2.1
Tufts Medical Center 6 Aa3 11,598 2.0 255 1.1
Steward Health Care 8 NR 10,644 1.9 380 1.6
AdventHealth 4 Aa2 9,972 1.7 402 1.7
CommonSpirit Health 8 Baa1 7,914 1.4 360 1.6
Community Health Systems 7 B3 7,909 1.4 385 1.7
Emblem Health 13 C+ 7,462 1.3 281 1.2
Trinity Health 6 Aa3 7,227 1.3 288 1.2
Harbin Clinic 6 NR 7,118 1.3 316 1.4
Mercy Health 5 A1 7,102 1.2 270 1.2
United Health Group 4 A3 6,425 1.1 280 1.2
Total $ 170,997 29.9% 6,794 29.4%
(1) Refer to page 24 for the reporting definition of Annualized Base Rent.
(2) Tenant Specialty includes the percentage of total GLA of multi-tenanted clinical MOBs.
(3) Primary Care includes Pediatrics, Family and Internal Medicine.
(4) Represents direct leases with leading MOB health systems and their subsidiaries. Parent tenant credit rating used where direct tenant is not rated.
(5) Amounts presented in years.
(6) Credit ratings from S&P, Moody's or AM Best where appropriate.
(7) Total leased and total portfolio GLA excludes GLA of projects under development and includes 100% of the GLA of its unconsolidated joint venture.
3Q 2021 I Supplemental Information
Healthcare Trust of America, Inc. I 23Reporting Definitions
Adjusted Earnings Before Interest, Taxes, Depreciation and Amortization for Real Estate (“Adjusted EBITDAre”): Adjusted EBITDAre is
presented on an assumed annualized basis. HTA defines Adjusted EBITDAre as EBITDAre (computed in accordance with NAREIT as
defined below) plus: (i) transaction expenses; (ii) gain or loss on extinguishment of debt; (iii) non-cash compensation expense; (iv) pro forma
impact of its acquisitions/dispositions; and (v) other normalizing adjustments. HTA considers Adjusted EBITDAre an important measure
because it provides additional information to allow management, investors, and its current and potential creditors to evaluate and compare its
core operating results and its ability to service debt.
Annualized Base Rent or (“ABR”): Annualized base rent is calculated by multiplying contractual base rent for the end of the period by 12
(excluding the impact of abatements, concessions, and straight-line rent).
Cash Net Operating Income (“Cash NOI”): Cash NOI is a non-GAAP financial measure which excludes from NOI: (i) straight-line rent
adjustments; (ii) amortization of below and above market leases/leasehold interests and other GAAP adjustments; (iii) notes receivable
interest income; and (iv) other normalizing adjustments. Contractual base rent, contractual rent increases, contractual rent concessions and
changes in occupancy or lease rates upon commencement and expiration of leases are a primary driver of HTA’s revenue performance. HTA
believes that Cash NOI, which removes the impact of straight-line rent adjustments, provides another measurement of the operating
performance of its operating assets. Additionally, HTA believes that Cash NOI is a widely accepted measure of comparative operating
performance of real estate investment trusts (“REITs”). However, HTA’s use of the term Cash NOI may not be comparable to that of other
REITs as they may have different methodologies for computing this amount. Cash NOI should not be considered as an alternative to net
income or loss (computed in accordance with GAAP) as an indicator of its financial performance. Cash NOI should be reviewed in
connection with other GAAP measurements.
Credit Ratings: Credit ratings of parent tenants and their subsidiaries.
Customary Health System Restrictions: Ground leases with a health system ground lessor that include restrictions on tenants that may be
considered competitive with the hospital, including provisions that tenants must have hospital privileges.
Economic with Limited Restrictions: Ground leases that are primarily economic in nature and contain no material restrictions on tenancy.
Earnings Before Interest, Taxes, Depreciation and Amortization for Real Estate (“EBITDAre”): As defined by NAREIT, EBITDAre is computed
as net income or loss (computed in accordance with GAAP) plus: (i) interest expense; (ii) income tax expense (not applicable to HTA); (iii)
depreciation and amortization; (iv) impairment; (v) gain or loss on the sale of real estate; and (vi) the proportionate share of joint venture
depreciation and amortization.
Funds from Operations (“FFO”): HTA computes FFO in accordance with the current standards established by NAREIT. NAREIT defines FFO
as net income or loss attributable to common stockholders (computed in accordance with GAAP), excluding gains or losses from sales of real
estate property and impairment write-downs of depreciable assets, plus depreciation and amortization related to investments in real estate,
and after adjustments for unconsolidated partnerships and joint ventures. HTA presents this non-GAAP financial measure because it
considers it an important supplemental measure of its operating performance and believes it is frequently used by securities analysts,
investors and other interested parties in the evaluation of REITs. Historical cost accounting assumes that the value of real estate assets
diminishes ratably over time. Since real estate values have historically risen or fallen based on market conditions, many industry investors
have considered the presentation of operating results for real estate companies that use historical cost accounting to be insufficient by
themselves. Because FFO excludes depreciation and amortization unique to real estate, among other items, it provides a perspective not
immediately apparent from net income or loss attributable to common stockholders.
Gross Leasable Area (“GLA”): Gross leasable area in square feet.
Investments in Real Estate: Based on acquisition price.
Leased Rate: Leased rate represents the percentage of total GLA that is leased (excluding GLA for properties under development), including
month-to-month leases and leases which have been executed, but which have not yet commenced, as of the date reported.
Metropolitan Statistical Area (“MSA”): Is a geographical region with a relatively high population density at its core and close economic ties
throughout the area. MSAs are defined by the Office of Management and Budget.
Net Operating Income (“NOI”): NOI is a non-GAAP financial measure that is defined as net income or loss (computed in accordance with
GAAP) before: (i) general and administrative expenses; (ii) transaction expenses; (iii) depreciation and amortization expense; (iv) impairment;
(v) interest expense; (vi) gain or loss on sales of real estate; (vii) gain or loss on extinguishment of debt; (viii) income or loss from
unconsolidated joint venture; and (ix) other income or expense. HTA believes that NOI provides an accurate measure of the operating
performance of its operating assets because NOI excludes certain items that are not associated with the management of its properties.
Additionally, HTA believes that NOI is a widely accepted measure of comparative operating performance of REITs. However, HTA’s use of the
term NOI may not be comparable to that of other REITs as they may have different methodologies for computing this amount. NOI should not
be considered as an alternative to net income or loss (computed in accordance with GAAP) as an indicator of HTA’s financial performance.
NOI should be reviewed in connection with other GAAP measurements.
3Q 2021 I Supplemental Information
Healthcare Trust of America, Inc. I 24You can also read