HBCUS: AMERICA'S INNOVATIVE ASSET - 30 JULY 2020 VICTOR MCCRARY, PHD VP FOR RESEARCH 202-274-7443 - NASA
←
→
Page content transcription
If your browser does not render page correctly, please read the page content below
HBCUs:
    America’s
    Innovative
    Asset

30 July 2020
Victor McCrary, PhD
VP for Research
victor.mccrary@udc.edu
202-274-7443
MINORITY SERVING
   INSTITUTIONS:
   America’s Underutilized
        Resource for
   Strengthening the STEM
         Workforce

      Free report available at:
https://www.nap.edu/catalog/25257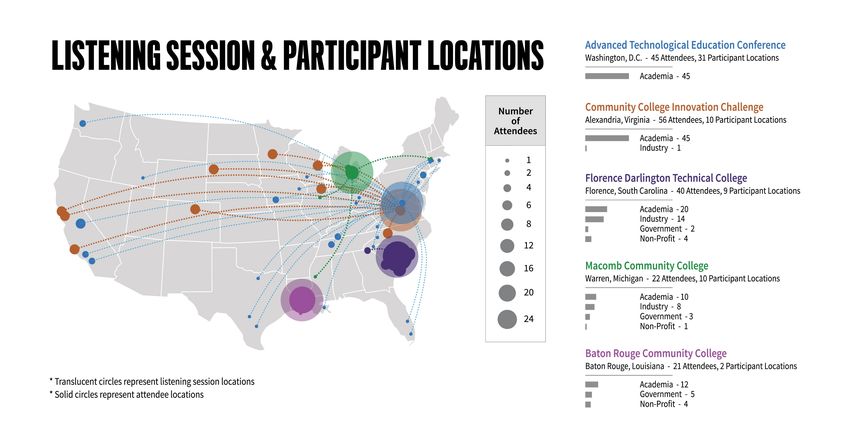
Authoring Committee
LORELLE ESPINOSA, co-Chair, American Council on   LEO MORALES, University of Washington School of
Education                                         Medicine
KENT MCGUIRE, co-Chair, William and Flora         ANNE-MARIE NÚÑEZ, The Ohio State University
Hewlett Foundation                                CLIFTON POODRY, Howard Hughes Medical
JIM BERTIN, Chief Dull Knife College              Institute
ANTHONY CARPI, John Jay College, CUNY             WILLIAM SPRIGGS, American Federation of Labor
APRILLE ERICSSON, NASA Goddard Space Flight       and Congress of Industrial Organizations; Howard
Center                                            University
LAMONT HAMES, LMH Strategies Inc.                 VICTOR TAM, Santa Rosa Junior College
WESLEY HARRIS, Massachusetts Institute of         CRISTINA VILLALOBOS, University of Texas Rio
Technology                                        Grande Valley
EVE HIGGINBOTHAM, University of Pennsylvania      DOROTHY YANCY, President Emerita of Shaw
SPERO MANSON, University of Colorado Denver       University and Johnson C. Smith University
JAMES MINOR, California State University          LANCE SHIPMAN YOUNG, Morehouse University
MSI Types
– Historically Black Colleges and Universities (HBCUs)
– Tribal Colleges and Universities (TCUs)
– Hispanic-Serving Institutions (HSIs)
– Asian American and Native American Pacific Islander-
  Serving Institutions (AANAPISIs)
– Alaska Native-Serving and Hawaiian Serving(ANNHIs)
– Predominately Black Institutions (PBIs)
– Native American-Serving Nontribal Institutions (NASNTIs)

Contributions and Reach
• Roughly 700 two- and four-year colleges and universities, enrolling
  nearly 30 percent of all undergraduates in U.S. higher education
• Constitute nearly a third of all two-year institutions or looked at
  another way, over half of all MSIs are two-year institutions
• More undergraduate students (from all backgrounds) are enrolled
  in STEM fields at four-year MSIs than at four-year non-MSIs
• Taken together, HBCUs, HSIs, and AANAPISIs produce one fifth
  (20%) of the nation’s STEM bachelor’s degrees

HBCU: Fast Facts*

         • 101 Accredited HBCUs
         • HBCUs are 3% of the Nation’s Colleges &
           Universities
         • HBCUs enroll 10% of the Nations Black
           students (300,000)
         • HBCUs produce 20% of all Black graduates
         • HBCUs generate $14.8B in economic impact
         • HBCUs account for 24% of Blacks in STEM
           fields (30% in engineering at the bachelors
           level)
         • The top eight institutions which produced
           Blacks who went on for STEM PhDs were
           HBCUs

           * Source: UNCF
HBCUs: Where Are They Located
Carnegie             Research       NSF*         NSF*
                              Moody’s                                             Endowment
 University       Designation         Expenditures Expenditures Expenditures
                               Rating                                             (2016-2019)
                     2020                (2018)       (2018)       (2016)
 Clark-Atlanta        R2        Ba2        $8M              $1.9M        $1.5M        $69M
Delaware State        R2        Aa3        $21M             $3.3M        $5.4M       $28.6M
    FAMU              R2       Baa1        $40M             $3.0M        $2.4M        $98M
   Hampton            R2        Aa2        $14M             $3.2M        $3.8M      $263.2M
   Howard             R2        Ba1        $46M             $6.7M        $7.8M      $692.8M
 Jackson State        R2        Aa2        $19M             $6.5M        $6.0M        $60M
North Carolina
    A&T
                      R2        A1         $38M             $8.6M        $7.5M        $57M

 Morgan State         R2        A1         $13M             $1.0M        $1.0M       $32.9M

Tennessee State       R2        Aa1        $18M             $1.7M        $1.6M        $51M

Texas Southern        R2       Baa3        $4M              $0.5M        $0.8M        $54M

                                           $2.9M            $0.86M
     UDC              M2        Aaa
                                       (FY19 = $4.8M)   (FY19=$1.014M)
                                                                         $0.86M    $51M (FY19)

    UMES              R2        Aa1        $5M              $0.0M        $0.0M       $26.2M

       * Source: National Science Foundation FY18 HERD Survey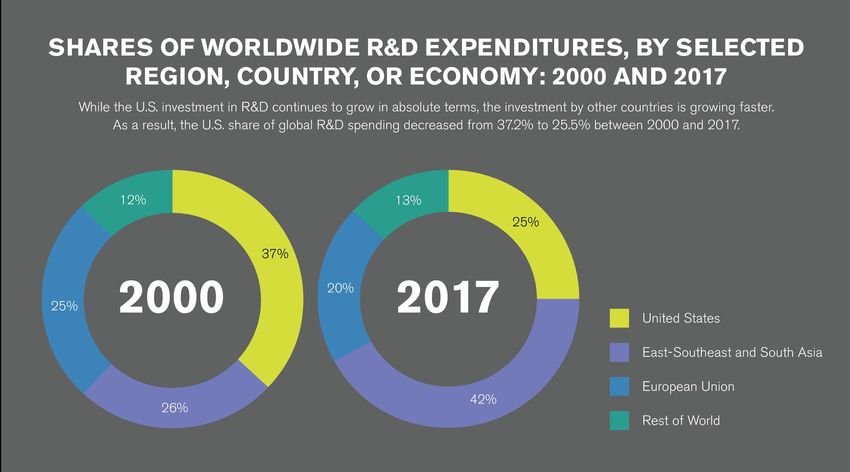
ABET ACCREDITED ENGINEERING HBCUs

• Alabama A&M University (M1)     • Prairie View A&M University
• Florida A&M University (R2)       (M1)
• Hampton University (R2)         • Southern University & A&M
                                    College (M1)
• Howard University (R2)
                                  • Tennessee State University (R2)
• Jackson State University (R2)
                                  • Tuskegee University (M2)
• North Carolina A&T State
  University (R2)                 • University of the District of
                                    Columbia (M2)
• Morgan State University (R2)
                                  • University of Maryland – Eastern
• Norfolk State University (M2)     Shore (R2)
                                  • Virginia State University (M2)     9
NASA and MUREP
       Investments and Engagement
at Historically Black Colleges and Universities
     Investment FY 2016 – FY 2018 / Engagement FY 2019 – FY2020
Funding from Agency to MSIs
(By Institution Type)
Out of the AGENCY dollars that went to all MSIs, what percentage went to each MSI type?
100%
80%
60%
40%
20%
0%
FY16 FY17 FY18 FY19
HBCU TCU HSI AANAPISI AIANSI PBI ANNH NASNTI
HBCU TCU HSI AANAPISI AIANSI PBI ANNH NASNTI
FY16 5% 1% 14% 50% 29% 1% 0% 0%
FY17 8% 1% 37% 43% 10% 1% 0% 0%
FY18 5% 0.35% 44% 45% 5% 0.20% 0% 0%
FY19 8% 0.54% 54% 18% 0% 0.40% 17% 2%
Note: ANNH and NASNTI did not exist as a separate category in 2018.
This chart further analyzes the funds that were awarded to the Minority Serving Institutions (MSIs) by MSI type.National Aeronautics and
Space Administration
MUREP FY2019 – FY2020 Engagement at HBCUsMUREP HBCU ENGAGEMENT
White House Initiative on HBCUs NASA Aeronautics Research Mission
CIAA Conference Support
Directorate (ARMD)
President/Chancellor Meetings Interagency Working Group
Student Engagement Two MUREP HighVolume Awardees –
Middle School Day
Strategic Planning Tuskegee/Virginia State;
High School Day
Training Workshops/Sessions New Lead HBCU – North Carolina A&T
Career Fair
Networking Additional Funding Opportunities
Exhibit BoothMUREP HBCU ENGAGEMENT
MSI Capability HBCU/MSI MUREP Institutional Research
Gateway Road Tour Opportunity (MIRO)
https://msigateway.larc.nasa.gov/ Agency 1% Contracting Seven HBCUs funded
Externally Available Goal for MSIs out of 20 Existing Awardees
Database of MSIs Training Workshops
Listing of Research Capabilities Networking
Searchable by HBCU MatchmakingSchool of Engineering and Applied Sciences - Research
Recent Awards
Professional Research Center of Research Center for Advanced AMP3
Engagement Excellence in Science & Manufacturing in Space Additive Manufacturing
Program (PREP) Technology (CREST) Technology & Applied Post Processing
$7M for 5 years $4.8M for 5 years Research Partnership
Advanced Manufacturing Nanotechnology $3M for 3 years $2.8M for 3 years
Research & Education Advanced Manufacturing UDC-led HBCU
ConsortiumNASA External Advisory Committee
UDC Research Faculty Recognition
Meeting February 7, 2020
BEYA Conference 2020 EAC Lead, Dr. Henry Molintas, Lead Mechanical
Engineering for Department of Defense Innovation
February 13-15, 2020 Program, Booz Allen Hamilton
UDC Visibility & Presence: Dr. Jack Price, Director of Research, Naval Surface
- Rodney Trapp – BEYA Seminar Moderator Warfare Center, West Bethesda, MD
- Pawan Tyagi – BEYA HBCU Innovator Awardee Susan E. Dunnings, the Vice President and
Associate General Counsel, Employment and Labor
- Lara Thompson – Tech Talk on Biomedical Engineering Law, for Lockheed Martin in Bethesda, Maryland
- Exhibit Booth – School of Engineering Walter Falconer, President of Space Consultant,
member of the NOAA Science Advisory Board as
- ~ 40 UDC students participated well as the NASA JPL Science Advisory Board
Patrick Hill, Parker Solar Probe project manager,
Space Department, Johns Hopkins University
Applied Physics Laboratory
Michelle Pourciau, Former Director, Department of
Transportation, Baltimore, MDTOTAL VALUE OF AGENCY AWARDS TO HBCUS
$23,330,270
$21,860,373
$20,974,794
$18,983,663
FY2016 FY2017 FY2018 FY2019
*FY2019 data is preliminary
17 17MUREP CONTRIBUTION
TO HBCU AWARDS
FY2016 FY2017 FY2018 FY2019
MUREP Funded
MUREP Funded MUREP Funded
MUREP Funded $3,461,188
$5,106,337 $6,565,892
$7,014,733 (18%)
(24%) (28%)
(32%)
Agency Funded Agency Funded Agency Funded
$14,845,640 $15,868,457 Agency Funded $16,764,378
(68%) (76%) $15,522,475 (72%)
(82%)
*FY2019 data is preliminary
18NUMBER OF AGENCY AWARDS TO HBCUS
313
290
236
189
FY2016 FY2017 FY2018 FY2019
*FY2019 data is preliminary
19 19Total U.S. R & D Expenditures in 2010 and 2011
$70,000,000,000
$65,073,411,000
$61,190,610,000
$60,000,000,000
$50,000,000,000
Majority
Universities
$40,000,000,000
$30,000,000,000
$20,000,000,000
HBCUs
(105)
$10,000,000,000
0.83% 0.83%
$542,471,000 $465,922,000
$0
2011 2010
Total R&D Expenditures Total HBCU R&D Expenditures
source: J. Lee, Association of Public & Land Grant UniversitiesCarnegie Research NSF* NSF*
Moody’s Endowment
University Designation Expenditures Expenditures Expenditures
Rating (2016-2019)
2020 (2018) (2018) (2016)
Clark-Atlanta R2 Ba2 $8M $1.9M $1.5M $69M
Delaware State R2 Aa3 $21M $3.3M $5.4M $28.6M
FAMU R2 Baa1 $40M $3.0M $2.4M $98M
Hampton R2 Aa2 $14M $3.2M $3.8M $263.2M
Howard R2 Ba1 $46M $6.7M $7.8M $692.8M
Jackson State R2 Aa2 $19M $6.5M $6.0M $60M
North Carolina
A&T
R2 A1 $38M $8.6M $7.5M $57M
Morgan State R2 A1 $13M $1.0M $1.0M $32.9M
Tennessee State R2 Aa1 $18M $1.7M $1.6M $51M
Texas Southern R2 Baa3 $4M $0.5M $0.8M $54M
$2.9M $0.86M
UDC M2 Aaa
(FY19 = $4.8M) (FY19=$1.014M)
$0.86M $51M (FY19)
UMES R2 Aa1 $5M $0.0M $0.0M $26.2M
* Source: National Science Foundation FY18 HERD SurveyCarnegie Research NSF NASA
Moody’s Endowment
University Designation Expenditures Expenditures Expenditures
Rating (2016-2019)
2020 (2018) (2018) (2018)
Clark-Atlanta R2 Ba2 $8M $1.9M $0.0M $69M
Delaware State R2 Aa3 $21M $3.3M $1.0M $28.6M
FAMU R2 Baa1 $40M $3.0M $0.083M $98M
Hampton R2 Aa2 $14M $3.2M $5.6M $263.2M
Howard R2 Ba1 $46M $6.7M $0.25M $692.8M
Jackson State R2 Aa2 $19M $6.5M $0.15M $60M
North Carolina
A&T
R2 A1 $38M $8.6M $0.3M $57M
Morgan State R2 A1 $13M $1.0M $4.4M $32.9M
Tennessee State R2 Aa1 $18M $1.7M $0.065M $51M
Texas Southern R2 Baa3 $4M $0.5M $0.050M $54M
UDC M2 Aaa
$2.9M $0.86M $0.033M $51M (FY19)
(FY19 = $4.8M) (FY19=$1.014M) (FY19= $0.0M)
UMES R2 Aa1 $5M $0.0M $0.0M $26.2M
* Source: National Science Foundation FY18 HERD SurveyCarnegie Research NSF* NASA*
Endowment
University Designation Expenditures Expenditures Expenditures
(2019)
2020 (2018) (2018) (2018)
Johns Hopkins R1 $2.2B $39M $264M $6.3B
U. Wash. R1 $989M $111M $20M $2.94B
U. Michigan R1 $850M $81M $29M $12.4B
Stanford R1 $711M $76M $22M $28B
UNC Chapel Hill R1 $701M $35M $1.8M $5B
U. Penn R1 $688M $45M $4.6M $14.7B
Columbia R1 $686M $87M $21M $11B
UC San Francisco R1 $669M $7.7M $0.5M $3.89B
Georgia Tech R1 $654M $66M $12.8M $2.17B
U. Pittsburgh R1 $649M $27.4M $1.1M $4.3B
Duke R1 $645M $38M $2.5M $3.8B
UC San Diego R1 $636M $82M $10M $1.73B
* Source: National Science Foundation FY18 HERD SurveyNSB Vision 2030 Task Force: Roger Beachy, Chair Ellen Ochoa, Vice Chair Vicki Chandler Bob Groves Julia Phillips Maria Zuber nsf.gov/nsb/publications/vision2030.pdf NSBVision@nsf.gov
FOCUS ON THE FUTURE:     DELIVER BENEFITS
                         FROM RESEARCH
NSB ROADMAP
                       DEVELOP STEM TALENT
                          FOR AMERICA

                       EXPAND THE GEOGRAPHY
                           OF INNOVATION

                        FOSTER A GLOBAL S&E
                            COMMUNITY
Developing STEM talent for America
DEVELOP STEM
TALENT FOR AMERICA
The U.S. must make education
a federal, state, and local
priority and hold itself
accountable with reliable,
up-to-date data.CONTEXT: U.S. SHARE OF R&D DECREASING
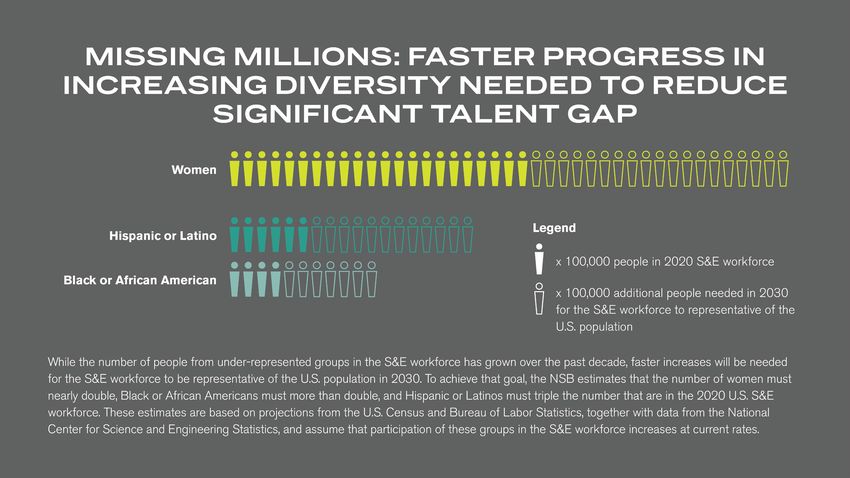
AS GLOBAL S&E GROWSThe Skilled Technical Workforce: Crafting America’s
Science & Engineering Enterprise
Victor McCrary, VP for Research & Graduate Programs,
University of the District of Columbia; Vice-Chair, National Science Board
National Science BoardWhy is NSB Focusing on the STW?
• Increased need for S&T skills and
knowledge across many sectors and
at all educational levels
• National prosperity and security in a
competitive, S&T-intensive world
• Long-term health of the U.S. S&E
enterprise
• Near-term workforce needs
• Opportunities for all Americans
National Science BoardNational Science Board
STW Data Portrait
Workers with high school or some post-secondary training: 2017
$50,000 6.0
Skilled technical
$45,000
workers
5.0
$40,000 All other workers
$35,000
4.0
$30,000
$25,000 3.0
$20,000
2.0
$15,000
$10,000
1.0
$5,000
Science & Engineering Indicators 2020, “S&E Labor Force”
$0 0.0 (forthcoming)
Salary Unemployment rate
National Science BoardSTW Data Portrait National Science Board
Momentum
                                                                                                                                          NSB Listening Session:
                                                                             NSB Policy Statement:                                              Advanced                             NSB STW Report
                                                  NSB Listening               “Our Nation’s Future               NSB Listening               Technological                               Release
                                                  Session: Baton             Competitiveness Relies           Session: Community          Education Conference                        September 2019
                                                Rouge Community               on Building a STEM-              College Innovation               October 2018      NSF Dear Colleague
                                                     College                 Capable US Workforce                   Challenge                                   Letter for Convergence
  First NSB discussion       NSB Meeting: STW      October 2017                   February 2018                       June 2018                                 Accelerator pilots: “AI
         on STW                                                                                                                  NSB Listening
                                  Panel                      NSB STW Task Force                  NSB Listening                 Session: Florence                  and Future Jobs” &
      February 2017                                                                                                                                                “National Talent
                                 August 2017                    Established                    Session: Macomb                Darlington Technical
                                                                  November 2017               Community College                     College                           Ecosystem
                                                                                                      April 2018                                                        March 2019
                                                                                                                                    September 2018

          2017                                                                2018                                                                                       2019

                                                   2017 Blue Collar                                                                          2018 Blue Collar      NASEM Report:
                            NASEM Report:                                           House Hearing:                                                STEM
                                                        STEM                                                         Executive Order:                             “MSIs: America’s   American
                          “Building America’s                                     Innovations in STEM                                          Conference
Senate Hearing: Closing                              Conference                                                      “Establishing the                              Underutilized Workforce Policy
                           Skilled Technical                                      Mentoring, Training,                                        November 2018
  the Skills Gap and                                November 2017                                                  President’s National                             Resource for   Advisory Board
                              Workforce”                                          and Apprenticeships
     Boosting US                                                                                                      Council for the                            Strengthening the   Priorities
                               May 2017                                               February 2018
   Competitiveness                                       House Briefing: “Blue                                      American Worker”                             STEM Workforce”     Released
         March 2017                                        Collar STEM: The                                             July 2018
                                                                                                                                                                     December 2018
                                                                                                                                                                                           June 2019
                                                          Future of the U.S.
                                                             Workforce”                                                                    White House 5-year STEM
                                                             November 2017                                                                  Education Strategic Plan
                                                                                                                                                     December 2018

                 National Science Board
Systemic Challenges and Opportunities
• Designing STW education to meet the needs of individuals
• Building partnerships among industry, government, and
educational institutions to leverage resources and knowledge, and
respond to local industry/community needs
• Conveying accurate information about the STW, including
employment and career opportunities
• Addressing data gaps and data silos to maximize effectiveness of
programs and initiatives
National Science BoardRecommendations • Change the Message: The NSB and NSF, and other S&E leaders should communicate the importance of the STW to the nation’s S&E enterprise, individual economic prosperity, national security, and U.S. global competitiveness • Focus on the Data: To understand and begin to address data gaps, NSF’s NCSES, with additional federal resources and collaborating with other statistical agencies, should collect nationally representative data on the education, skills, and workforce characteristics of the STW. NSF should promote partnerships between governmental and non-governmental (industry, academia) stakeholders in the STW to share data and develop tools for public use and workforce planning. National Science Board
S&E associate's degrees awarded in the U.S., by field: 2000–17
       50,000
       45,000
       40,000
                                                    Computer sciences
       35,000
       30,000
                                                                                  Social sciences
       25,000
       20,000
                                                                                                Psychology
       15,000
                          Biological and agricultural sciences                     Physical sciences
       10,000     Engineering                                    Mathematics and statistics
        5,000
           0
                2000 2001 2002 2003 2004 2005 2006 2007 2008 2009 2010 2011 2012 2013 2014 2015 2016 2017

           National Science Board
Recommendations • Leverage the Portfolio of Federal Investments: NSF should conduct a full portfolio analysis of its STW investments. The analysis could publicize and inform stakeholders about the breadth of NSF’s contributions to the STW, build awareness of funding opportunities, and maximize and leverage the impact of these investments. • Build Partnerships: Two-year colleges and four-year colleges (e.g. HBCUs) and universities should work as partners, together with business, to grow the STEM-capable U.S. workforce via programs tailored to the needs of local communities. Policymakers can encourage this by developing federal programs that require partnership participation from stakeholders in multiple sectors. National Science Board
Points to Consider Going Forward - PCAST
• Focus on nurturing, diverse domestic STEM talent:

- Establish research centers at HBCUs/MSIs for national priorities in
  AI, quantum information processing, and cyber

- Programs to introduce students early to National Security R&D and
  the value of holding a security clearance

  National Science Board
The Value Proposition of HBCUs:
“We Are Essential for the National Security
     of the US Research Enterprise”

       Omnibus Budget, signed into law March 23, 2018

                                               Science and Engineering Indicators 2018
Dr. Vic’s ‘Asks’ of the UAG • UAG members visit NASA-funded HBCUs this year • Increase NASA’s budget commitment to HBCUs (from
Thank You
Victor McCrary, PhD
VP for Research & Graduate Programs
202-274-7443
victor.mccrary@udc.edu
You can also read