Herself and her children - How worse off are they? Impact of COVID-19 in rural Bihar - International Growth Centre
←
→
Page content transcription
If your browser does not render page correctly, please read the page content below
Final report

Herself and
her children
How worse off are
they? Impact of
COVID-19 in rural
Bihar

Zakir Husain
Saswata Ghosh
Mousumi Dutta

February 2021

When citing this paper, please
use the title and the following
reference number:
COVID-19-20092-IND-1
CONTENTS

        Contents                                                  i
        List of Tables                                           iii
        List of Figures                                          v
        List of Abbreviations                                    vi
        Acknowledgements                                         vii

 1      COVID-19: A PERFECT STORM                                1
1.1     Background                                               1
1.2     COVID-19 and its impact on food security and nutrition   2
1.2.1   Experience of earlier crises                             2
1.2.2   Understanding the dynamics                               3
1.2.3   Empirical studies                                        6
1.2.4   Ensuring food security: Role of public safety nets       9
1.2.5   Who gets the benefits?                                   11
1.3     Research objective                                       11
1.4     Survey design                                            13
1.4.1   Sampling strategy in first phase                         14
1.4.2   Data collection in second phase                          16
1.4.3   Sample characteristics                                   17
1.5     Methodology                                              18
1.5.1   Consumption indicators                                   18
1.5.2   Dietary practices                                        19
1.5.3   Access to Government schemes                             21
1.5.4   Welfare change                                           21
        References                                               23

 2      IMPACT OF COVID-19 ON WOMEN AND CHILDREN IN RURAL        42
        BIHAR
2.1     Introduction                                             42
2.2     Dietary changes                                          42
2.2.1   Investigating deterioration for mothers                  44

                                              i
2.2.2 MDD and DS across socio-economic correlates 45
2.2.3 Changes in food basket of mothers 46
2.2.4 Econometric analysis for mothers 50
2.3 Dietary practices of children 51
2.3.1 Variations across household characteristics 51
2.3.2 Consumption of food groups 53
2.3.3 Econometric analysis for children 54
2.4 Access to welfare measures 59
2.4.1 Access to welfare measures across correlates 59
2.4.2 Access to benefits and political contacts 62
2.4.3 Econometric analysis 64
2.5 Welfare changes 68
2.6 Financial situation during lockdown 70
References 71
3 HERSELF, AND HER CHILD: HOW WORSE OFF ARE THEY? 73
3.1 Summary of findings 73
3.1.1 How worse were the mothers? 75
3.1.2 How worse were the children? 75
3.1.3 Access to safety nets 76
3.1.4 Welfare changes and future outlook 76
3.1.5 Clientilism at work 76
3.2 Discussion 77
3.3 Challenges for policy makers 78
3.4 Final words 82
References 83
iiLIST OF TABLES
1.1 Nutrition-related programmes affected by COVID-19 in South Asia 5
1.2 Selection of districts 14
A1.1 Selected maternal and child health indicators for Bihar and India 31
A1.2 Selected maternal and child health indicators for the surveyed districts 33
A1.3 List of districts, blocks and villages surveyed in first phase 35
A1.4 Profile of first phase respondents satisfying recruitment criterion: 37
Selected & not selected in second phase
A1.5 Mean, median and standard deviation of select variables 38
A1.6 Sample characteristics 40
2.1 Mobility indices for Dietary Score and Minimum Dietary Diversity 42
2.2 Changes in Dietary Score and Minimum Dietary Diversity for mothers 45
across asset groups
2.3 Changes in Dietary Score and Minimum Dietary Diversity for mothers 45
across educational levels
2.4 Changes in Dietary Score and Minimum Dietary Diversity for mothers 46
across socio-religious groups
2.5 Proportion of mothers consuming specific food groups in pre and 47
lockdown period
2.6 Changes in percentage of households consuming cereals and potatoes, 48
and pulses & nuts for households with and without ration cards
2.7 Proportion of mothers consuming fruits and vegetables by land holding 48
in pre- and lockdown period
2.8 Political contacts and change in Dietary Score 49
2.9 Summary results of regression models 50
2.10 Variations in Dietary Score of children across socio-economic correlates 52
2.11 Variations in percentage of children complying with Minimum Dietary 52
Diversity across socio-economic correlates
2.12 Change in consumption of food groups by children 54
2.13 Results of OLS model for change in Dietary Score of children 54
2.14 Results of multi-national model for change in proportion of children 56
iiicomplying with Minimum Dietary Diversity
2.15 Variations in Dietary Score and Minimum Dietary Diversity across age 58
groups
2.16 Proportion of beneficiaries across socio-economic correlates 60
2.17 Variations in access to benefits across socio-economic correlates 61
2.18 Variations in cash transfer across socio-economic correlates 62
2.19 Political contacts and access to programme 63
2.20 Benefits and political contacts 64
2.21 Results of probit models 66
2.22 Results of ordered probit models 67
2.23 Changes in welfare measured using pulse consumption for mothers and 69
youngest child
2.24 Variations in financial situation and outlook over asset groups, 70
occupation of husband and political contacts
ivLIST OF FIGURES
1.1 Modalities of benefit transfer under Mid-day meal scheme during COVID-19 10
pandemic
1.2 Map of Bihar showing survey districts 16
1.3 Willingness to pay and welfare 22
2.1 Change in Dietary Score for mothers and children—percentage 43
2.2 Change in attainment of Minimum Dietary Diversity for mothers— 44
percentage
2.3 Access to welfare schemes 59
2.4 Nature of contact and number of cash transfers to Jan Dhan accounts 64
2.5 Financial situation during lockdown and outlook in coming year 70
vLIST OF ABBREVIATIONS
APMC Agricultural Produce Marketing Committee
ASHA Accredited Social Health Activists
BPL Below Poverty Line
DBT Direct Benefit Transfer
DS Dietary Scores
FC Forward Caste
FPI Food Prince Index
HDDS Household Dietary Diversity Score
HNS Health & Nutrition Strategy
IGC International Growth Centre
JTSP JEEViKA Technical Support programme
LIC Low Income countries
LMIC Low Middle Income countries
MDD Minimum Dietary Diversity
OBC Other Backward Castes
OLS Ordinary Least Square
PDS Public Distribution System
PPS Probability proportional to size sampling
SARS Severe acute respiratory syndrome
WFP World Food programme
WHO World Health Organization
WTP Willingness to Pay
viACKNOWLEDGEMENTS
The study is funded by a research grant (Grant No. IND_20092) from The International
Growth Centre, UK. We are grateful to the staff at both the UK office and their Indian
counterparts for their co-operation and support in executing the study. Without the flexible
approach of the IGC team, it would have been impossible to complete the study within the
deadline.
We are grateful to JEEViKA for facilitating the first phase of the survey. Their feedback on
the first phase questionnaire helped us immensely, and enabled us to conceptualise the
proposal and end line survey. We thank the JEEViKA staff—particularly the State Program
Manager (Health and Nutrition Strategy), Mr Apollonerius Purty—for their assistance.
We would also like to thank Dr. Kausik Chaudhury, Leeds University Business School, for
his feedback on the project proposal. Unfortunately, due to official commitments, he could
not be associated with the study. Prof. Manisha Chakrabarty (Indian Institute of Management
Calcutta) and Dr. Diganta Mukherjee (Indian Statistical Institute Kolkata) for their feedbacks
on various methodological issues of the study.
We would not have been able to complete the study without the assistance provided by the
Research Assistants — Mr. Agnij Sur, Ms. Sampurna Kundu, and Ms. Poulami Das. They
worked hard and sincerely throughout their tenure, and steadily supplied us with inputs that
we had demanded at short notice. The survey was undertaken by Mr. Pankaj Kumar, Mr. Asit
Kumar, Mr. Megnath Mondol, Mr. Pranab Mazumdar, and Mr. Madhusudan Das. We thank
them for their hard work and sincere efforts. We are also grateful to respondents who shared
their personal information and experience with us.
Finally, we are grateful to the Hon’ble Vice Chancellor, Prof. Anuradha Lohia, for her
encouragement. Prof. Sankar Basu and Prof. Joydeep Mukhopadhyay, the present and
previous Deans of Mathematics and Natural Sciences helped us in various ways. The
administration — particularly, Dr. Debajyoti Konar (Registrar), Dr. Prithul Chakrabarty
(Finance Officer), Ms. Pritha Ghosh (Assistant Registrar), Mr. Anirban Saha (Accounts
Officer), and Supriya Banik — facilitated the survey and enabled its smooth execution. Prof.
Devasish Sen, Chairperson of the Institutional Ethical Committee of Presidency University
helped us to obtain the necessary ethical clearance smoothly. We would also like to thank our
Departmental colleagues and staff for their support and encouragement.
Zakir Husain
Saswata Ghosh
Mousumi Dutta
February 27, 2021
vii1
CHAPTER ONE
COVID-19: A PERFECT STORM
1.1 Background
On 24th March 2020, the Government of India had announced a national level lockdown to
contain the transmission of COVID-19 in India. The lockdown continued till 31st May, after
which sanctions were lifted in a phased manner. The study analyses the impact of this
lockdown on dietary practices of women and their youngest child in rural Bihar. It also
examines access of households to welfare measures of the Central and State governments,
and estimates change in welfare levels of women and children.
On 31 December 2019, the World Health Organization (WHO) China Country Office was
informed of the outbreak of pneumonia, whose cause was unknown, had been detected in
Wuhan, in the Province of Hubei, China. A total of 44 cases were reported between
31stDecember 2019 and 3rdJanuary 2020. On 7th January 2020, China reported that it had
identified a new type of coronavirus (2019-nCov). Confirmed cases were registered in other
parts of Hubei Province, and Shanghai, Beijing, and the Province of Guangdong. Between
13th and 20th January 2020, Thailand, Japan and Republic of Korea reported similar cases,
indicating that the disease had spread outside China(World Health Organization, 2020a).
WHO (2020b) subsequently observed that community transmission had started within China
and that “Currently, cases infected in China have been exported to the US, Thailand, Japan,
and Republic of Korea. It is expected that more cases will be exported to other countries and
that further transmission may occur” (World Health Organization, 2020b, p. 1).By 13th
March, the outbreak had spread to 114 countries with more than 118,000 cases and 4,291
deaths, leading WHO to declare it a pandemic(World Health Organization, 2020c).
COVID-19 is a group of viruses affecting human beings through zoonotic1 transmission. This
is the third instance of the emergence of a novel coronavirus—preceding ones being severe
acute respiratory syndrome (SARS) in 2003(Zhong et al., 2003), and Middle East respiratory
syndrome coronavirus (MERS-CoV) in 2012(Ramadan & Shaib, 2019). The major reason for
concern with COVID-19 is its “repeated emergence and global scale of transmission,
1
An infectious disease caused by a pathogen that has jumped from a non-human animal (usually a vertebrate) to
a human.2 significant number of deaths, infection and mortality of care providers and healthcare workers (HCWs), and higher risk of death in vulnerable or susceptible groups” (Chatterjee et al., 2020, pp. 147–148). In the initial phase, in the absence of a licensed vaccine or effective therapeutics for COVID-19, quarantining and social distancing2 was adopted as a strategy. Quite a few countries, including India (vide MHA Order No. 40-3/2020-D dated 24/3/2020), had even adopted the extreme step of a lockdown. Aid agencies, researchers, and policymakers expect that the impact of these measures will be substantially high in Low Income countries (LICs) and Low Middle Income countries (LMICs), and will be a threat to food security and nutrition. 1.2 COVID-19 and its impact on food security and nutrition 1.2.1 Experience of earlier crises Shocks from earlier pandemics have been shown to have substantial adverse consequences on livelihoods, food and nutrition security. COVID-19, too, is expected to have similar impacts in LICs and LMICs, particularly in countries with relatively weak healthcare systems. Analysis of the consequences of the HIV/AIDS pandemic reveals that such massive health shocks can generate “adverse cycles of upstream risk and downstream effects, particularly for the ultra-poor” (Gillespie & Whiteside, 2020). Tackling such shocks is difficult as such pandemics may have different drivers in different settings (Frega et al., 2010). Populations affected by HIV/AIDS were found to have experienced high levels of food insecurity (Anema et al., 2009). It has been estimated that HIV/AIDS led to an increase of undernourished persons by 75 million between 2005 and 2007; the study also reported that the majority of food-insecure individuals resided in Asia and Africa(United Nations & Food Agriculture Organization, 2008). The main cause of food insecurity was declining income, due to loss of livelihoods and unemployment. The income effect leads to a substitution of nutrient-rich, non-staple foods like eggs, fruits, and vegetables to cheaper calorie sources like rice, maize, wheat, or cassava, in order to preserve their caloric intake (D. Headey & Ruel, 2020). During the 1998 Indonesian financial crisis, for instance, when real wages fell by 33 percent and rice prices shot up by almost 200 percent, rice consumption continued to rise 2 “Social distancing is a non-pharmaceutical infection prevention and control intervention implemented to avoid/decrease contact between those who are infected with a disease-causing pathogen and those who are not, so as to stop or slow down the rate and extent of disease transmission in a community. This eventually leads to decrease in spread, morbidity and mortality due to the disease” (Ministry of Health & Family Welfare, 2020, p. 1).
3

during this period, while intake of egg, meat, and vegetable declined sharply. The change in
diet led to a sharp rise in child anaemia by 16 percentage points, while children’s mean
weight-for-height declined by over one-third of a standard deviation(D. Headey & Ruel,
2020). Similarly, the 2008 global food price crisis pushed an estimated 130 to 155 million
people into poverty, leading to a 50 percent increase in acute malnutrition in Bangladesh,
Cambodia and Mauritania, and a significant rise in stunting in LICs and LMICs (Shekar &
Okamura, 2020).

If pandemics lead to an increase in mortality among the elderly, pandemics may also lead to a
decline in elderly caregivers, especially in poorer households or where family members are
engaged in the informal sector. This may further raise the risk of children becoming
malnourished(Gillespie & Whiteside, 2020).

1.2.2Understanding the dynamics
Lockdowns to contain COVID-19 are expected to aggravate the global recessionary trends
resulting in declining income, unemployment, poverty, and inequality. Estimates indicate that
the number of people below the poverty line will increase by 140 million, of whom 42
million will be from South Asian countries (Laborde et al., 2020). This is expected to have a
substantial income effect on consumption levels, and the composition of consumption
baskets. Consumption is projected to decline by 3.7 percent in South Asia (Laborde et al.,
2020). Studies are also predicting a declining demand for vegetables, fruits, and animal-
sourced foods, which will affect the supply of essential micronutrients. It is the poorest
households, who are estimated to spend 70 percent of their incomes on food items, are likely
to be most susceptible to income shocks (Laborde et al., 2020). The number of people in
LMICs facing acute food insecurity is expected to double to 265 million by the end of
2020(World Food Programme, 2020).

The demand side shocks will be aggravated by supply -side effects in the form of disruptions
to the supply chain and logistics, particularly of highly perishable foods, through the closed
country and state borders, restrictions on movement, shutting down of mandis and
agricultural product markets, etc. (Swinnen, 2020). In India, for instance, the dairy sector is
expected to be severely hit (Bhandari & Ravishankara, 2020). The supply-side shocks are
expected to lead to inflation in food prices. In Addis Ababa, for instance, maize and rice
4

prices increased, particularly in urban areas;3 moreover, the inflation persisted even after the
unlocking of the economy (Adewopo et al., 2020).

In India, supply-side disruptions reversed the declining trend in food prices observed over the
past few years. Although the Retail and Wholesale Food Prince Index (FPI) has risen by only
three percent in the first quarter of 2020, this may hit households severely given the
widespread declining wages and loss of employment. However, the modest increase in FPI
hides the marked commodity-wise and regional variations in prices. Further, the gap between
wholesale and retail prices has widened in the post-lockdown period. Narayananan and Saha
reports that:
         “Average retail price increases are over 6% for several pulses, over 3.5% for most
         edible oils, 15% for potato, 28% for tomato in the 28 days post-lockdown compared
         to prices during the month preceding the lockdown. Chicken and mutton prices have
         increased dramatically over the past two weeks, even doubled in some cities.
         However, milk prices have been steady over this period” (Narayananan & Saha,
         2020).
As wholesale markets, where farmers typically sell, have been closed in most of the smaller
towns the price rise is sharper in such cities, compared to larger cities. On the other end of the
supply chain, closures and logistics-related risks of trading have reduced prices received by
farmers by almost half (Hirvonen et al., 2020).

As household and community dynamics change the gender balance the gender-based
disadvantage faced by women is likely to be aggravated (Swinnen & McDermott, 2020).
Factors like limited access to nutrient-rich diet, breakdown of nutrition services, increased
gender-based violence, restrictions on mobility, and reduced workforce participation are
expected to compromise the diet of women. Children will comprise another vulnerable
section of the population, as they are unable to compete with adults for food (Scott et al.,
2020). UNICEF reports that in the early months of the COVID-19 pandemic there was a 30
percent reduction in the coverage of essential nutrition services in LMICs (UNICEF, 2020).

3
  Although urban households tend to be richer and better able to absorb price shocks, the high degree of
inequality in urban areas, along with job loss and wage cuts, implies that the impact of inflation in food prices is
likely to be greater in urban areas, compared to rural areas (Adewopo et al., 2020). Other studies have also
argued that rural households are better able to adapt to the lockdown induced shocks vis-à-vis urban households
(Avula et al., 2020).
5
The situation in South Asia is concerning (Table 1.1). This will also affect the nutritional
status and health of children.
Table 1.1: Nutrition-related programmes affected by COVID-19 in South Asia
Nutritional programme Increase / No change Decrease
Nutritional support for pregnant and lactating
40 44
women
Safe and nutritious diet for children aged 6-23
55 49
months
Vitamin A supplement (children aged 0-59 months) 34 46
Nutrition programme in schools 14 45*
Food subsidies 38 4
Note: Reported drop in nutrition program in schools by 75-100%: 36 percent.
Source: UNICEF (2020) Tackling the situation of children during COVID-19. Accessed from
https://data.unicef.org/resources/rapid-situation-tracking-covid-19-socioeconomic-impacts-data-viz/ on 15
February 2021.
Along with the breakdown in health and nutrition intervention schemes, this is expected to
lead to:
“… a 14.3% increase in the prevalence of moderate or severe wasting among children
younger than 5 years due to COVID-19-related predicted country-specific losses in
GNI per capita. We estimate this would translate to an additional estimated 6.7
million children with wasting in 2020 compared with projections for 2020 without
COVID-19; an estimated 57.6% of these children are in South Asia and an estimated
21.8% in sub-Saharan Africa” (Derek Headey et al., 2020).
Moreover,
“The estimated increase in child wasting is only the tip of the iceberg. The COVID-19
pandemic is also expected to increase other forms of child malnutrition, including
stunting, micronutrient deficiencies, and overweight. The global community’s failure
to act now will have devastating long-term consequences for children, human capital,
and national economies” (Fore et al., 2020, p. 518).
A study published in Lancet Global Health estimates that there will be an increase of child
and maternal deaths by 2.53-11.57 lakhs and 0.12-0.57 lakhs, respectively; it represents a 9.8
to 44.7 percent increase in under-five child deaths per month and an 8.3 to 38.6 percent
increase in maternal deaths per month (Roberton et al., 2020).The number of people facing6 acute food insecurity is projected to rise from 135 million in 2019 to 265 million in 2020—an increase of 130 million(World Food Programme, 2020). There are apprehensions, therefore, that COVID-19 will undo the massive investments, made in the past decade, to improve maternal and child health, and render attaining associated Sustainable Development Goals almost impossible within the deadline of 2030. 1.2.3 Empirical studies Studies undertaken in various countries have generally reported a decline in consumption levels, along with a shift to low quality diet. A study of 2,680 respondents in Germany, Denmark, and Slovenia found that people tended to shop less frequently, and shifted from fresh food to items with long shelf lives (Janssen et al., 2021). In rural China, a study reported a loss of $100 billion in wage income, and poor households reducing expenditure on education, nutrition, and health (Rozelle et al., 2020). The majority of villagers were found to have reduced spending on food and adopted a strategy of buying more grains and staples in bulk at low cost instead of more expensive goods like meat and produce. With declining food expenditures, we observe diet changes already beginning to occur. A survey in Ethiopia found households to be less likely to report consuming fruits (declining from 81% to 60% of households), meat (65% to 54%) , and dairy (56% to 45%), suggesting that fears about declining nutrient density of diets are real (Hirvonen et al., 2020). In Zimbabwe, rising food prices were accompanied by a reduction in the supply of nutritious food consumption (Matsungo & Chopera, 2020). Another survey reports that, while overall food consumption was similar to pre-pandemic levels (even among households reporting a job loss), grain and staple consumption has risen on average, in both value and calorie terms, while vegetable consumption and the residual category “all other foods,” (including oils), have fallen. Consumption of other micronutrient-dense foods, such as animal-sourced foods and fruits, has remained steady on average. As vegetables are high in micronutrients this is potentially concerning (de Brauw et al., 2020). In India, food security was compromised even before the pandemic. A survey of five states in 2017 shows that the proportion of adult household members consuming a minimally diverse diet was as low as three-four percent in these states, with cereals, pulses, and other vegetables comprising the diet for the majority. Only three percent of the households were classified as being food secure, with the remaining 97 percent experiencing food insecurity in some form or the another (Raghunathan, 2020). Analysis of the data from the National Family Health
7

Surveys shows that the proportion of wasted children has increased from 19.5 (2005-06) to
21 percent (2015-16), while the proportion of underweight children has remained the same at
43 percent over the same period (Das & Mohanty, 2021). The Global Hunger Report found
hunger levels in India to be serious; out of 107 countries, India’s rank was 94 (von Grebmer
et al., 2020). The pandemic is expected to further aggravate a situation that is already serious,
and prevent the attainment of a malnutrition free India by 2022, as envisaged under the
Poshan Abhiyan (Raghunathan, 2020).

There have been several studies of the impact of the lockdown in India, mostly based on
telephonic surveys. They reveal a bleak financial outlook, with a large proportion of
respondents reporting job loss, hunger, and liquidity problems. The Centre for Sustainable
Environment, Azim Premji University conducted a survey of 5,000 workers over 12 major
states (Centre for Sustainable Environment, 2020). The study reports that 66 percent of the
workers had lost their jobs, of which the majority were migrants. Income declined by 64
percent, inducing a decline in consumption by 73 percent in rural areas (83 percent in urban
areas). It was also estimated that 35 percent of rural households did not have money to buy
even a week’s essentials (64 percent in urban areas). In case of rural Bihar, the study (Centre
for Sustainable Enviornment, 2020) found job loss among 46 percent of respondents, with a
consumption decline among 69 percent of households. About 37 percent of households did
not have resources to purchase essentials beyond a week. Coverage under welfare schemes
was poor, with 21 percent reporting that they had not obtained rations, and 40 percent
reporting that they did not benefit from any cash transfer.

The Dalberg study (Dalberg, 2020)—covering 18,000 Below Poverty Line (BPL) households
in ten states— reported an average income loss of 61 percent of the regular income of an
average BPL household. The study also reported that every fifth household had already run
out of money and supplies. Government support had started to reach the households; about 64
percent of eligible households had received some relief, but it was inadequate to meet the
requirements of these families.

A study by Gaon Connection and Lokniti-CSDS (Gaon Connection and Lokniti-CSDS,
2020)found that 68 percent of respondents faced considerable difficulty in meeting their food
requirements. Coverage under social safety measures was poor—60, 63, and 42 percent
8

received benefits under Kisan Samman Nidhi, Public Distribution System, and cash transfer
to Jan Dhan account, respectively.

A series of telephonic surveys in the National Capital Region of Delhi (NCAER, 2020a,
2020b, 2020c, 2021) found that half of the households reported a severe income decline,
while about a third of rural households reported a shortage, particularly in vegetables, fruits,
grain, cereals, and milk. About 47 percent received rations and 29 percent received cash
transfer to Jan Dhan accounts; this increased to 62 percent and 67 after the lockdown.

Another study by Population Council in Bihar and Uttar Pradesh (Acharya, 2020)found that
the decline in household income affected food intake; consumption levels fell in 45-59
percent of households, and 32-48 percent faced a food shortage in the last 30 days. The mean
DS was three, with consumption levels of fruits, vegetables, and meat being compromised.
Only 25-33 percent of households received Take Home Rations.

Analysis of the Consumer Pyramid data collected by the Centre for Monitoring Indian
Economy found that out of the 5779 households surveyed in 27 states, 84 percent reported a
loss in income, with the second and third quintile of the income distribution being affected
most (Chicago Boothand Rustandy Centre for Social Sector Innovation, 2020). In Bihar, this
figure is over 90 percent. Rural households were also affected severely. It was found that a
large proportion of households, particularly the urban poor, would not be able to survive any
longer without assistance. The study of 47,000 low- income households spread over 15 states
found that about 75 percent reported a loss in wages or jobs; 40 percent had fallen into debt.
Coverage under Public Distribution System (PDS) (90 percent) and cash transfer schemes (86
percent) was high.

A survey undertaken in May 2020 by ID Insight reports large drops in income and access to
jobs, especially among non-farm households (ID Insight et al., 2020a). Although monetary
transfers are inadequate to compensate for income loss, the coverage level is high. A
subsequent survey revealed that rural unemployment is rising, although it is still below
lockdown levels (ID Insight et al., 2020b). Farmers are adapting to changed circumstances by
planning an increase in sowing area under the kharif season. The coverage of beneficiaries
and access to entitlements is high, although food insecurity persists. It has also been reported
9

that farmers, particularly small holders, have been affected by high input costs and low output
prices, leading to a fall in their income (ID Insight India, 2021).

1.2.4 Ensuring food security: Role of public safety nets
COVID-19 and its associated challenges led policy makers into unchartered territories-
fraught with uncertainties. Forecasts of economic depression, food price inflation, large-scale
unemployment, shrinking income, and increase in poverty imply that policymakers will have
to gear up for a massive counter-cyclical and protective effort. The major challenges are,
however, in the field of health and food security.

The PDS is an important vehicle to combat hunger, given its huge coverage of about two-
third of the population and preventing duplication of benefits. In addition to the already
provisioned regular supply of the same quantity of wheat and rice at a highly subsidised price
of Rs 2 and Rs 3 per kg, the Government of India utilised the stocks available with the Food
Corporation of India to provide an additional free bundle of five kg staple food (wheat and
rice) per person per month for three months along with one kg of pulses. Since cereals and
pulses comprise 80 percent of the staple food consumption of a household, they helped to
mitigate the risks of hunger caused by income loss for a large section of the vulnerable
population(Chand, 2020).

However, given that the most important impact of the pandemic on food security is through
income declines that put food access at risk, cash transfer policies are particularly suited as
intervention measures. It will also enable households to consume non-food commodities that
are important to households. By June, most countries had introduced additional social
protection measures in response to COVID-19. Substantial enhancements in cash transfers
over a quarter became the most popular intervention strategy. In India, PDS entitlements
were complemented by cash transfers of Rs1,500 paid in three monthly instalments through
the Jan Dhan Yojana.4

In the agricultural sector, the Government of India undertook several supply -side measures
to ensure adequate food supply and protect rural income. Agri-food production and marketing
were treated as essential commodities, and exemption was granted to farmworkers and

4
    In Bihar, of course, the state government provided a cash transfer of Rs.1000 to ration card holders.
10
transfer of agricultural machinery and farm produce. Simultaneously, a decision was taken to
keep agricultural markets open. State governments relaxed Agricultural Produce Marketing
Committee (APMC) rules and allowed farmers to sell their produce directly to private traders.
Given that children constitute a vulnerable section of the population, food intervention
through schools potentially comprises an important form of intervention. In India, the Mid-
day meal provides free lunch to approximately 100 million children, aged 6-14 years, across
1.3 million government primary and upper primary schools, for at least 200 days a year (Scott
et al., 2020). The closure of schools affected the supply of nutrition- dense food to school-
going children (HLPE, 2020).In response, several state governments have taken steps to
adapt to the Mid-day meal scheme for children (Figure 2.1). The delivery mode of these
meals has been modified; parents collect dry ration or cash at the school, home delivery (by
cooks-cum-helpers, school staff, or other frontline workers) of rations, direct bank transfers,
and distribution at fair price shops. In Bihar, eligible households were given cash transfers.
Figure 1.1: Modalities of benefit transfer under Mid-day meal scheme during COVID-
19 pandemic
Source: Scott et al., 2020.11
1.2.5 Who gets the benefits?
Anderson et al. has argued that, in India, pro-poor programmes are implemented through
gram panchayats, “local elites are somehow able to capture majoritarian local institutions and
run them in their own interests” (2015, p. 1781).This is possible through a system of
“…buying of votes and hence power, by a cadre of political elite (patrons) in return-
for the delivery of direct benefits to the non-elite (clients) whose support is essential
for maintenance of power. Elite patrons control government but promote benefits to
their clients in a quid pro quo arrangement that may see direct transfers to clients, but
that will feature governance largely in the interests of the elite” (Anderson et al.,
2015, p. 1781).
Such “discretionary provision of private or local public goods or privileges by government
officials and political parties to particular groups of citizens, in exchange for their votes”
(Pranab Bardhan & Mookherjee, 2000, p. 2) has been reported in several studies in India (P
Bardhan & Mitra, 2014a; Pranab Bardhan et al., 2009; Dasgupta, 2017; Vora, 1996).
Studies have generally concluded that the Central and State governments have introduced
social safety measures. Further, it has been documented that these measures have had
adequate coverage in terms of the population served (Chicago Booth and Rustandy Centre for
Social Sector Innovation, 2020). However, no study has examined the type of households that
have secured such benefits. This is an important question given the leakages reported in the
implementation of such schemes in normal times (Dreze & Khera, 2013, 2015), and during
the lockdown (Khan, 2020a, 2020b; Press Trust of India, 2020; Singh, 2020).
1.3 Research objective
The above discussion shows that COVID-19 has created a perfect storm for global
malnutrition. The crisis is expected to adversely affect the nutritional status of households—
particularly vulnerable groups like women, children and the aged—through livelihood and
income losses related to government-mandated shutdowns and de-globalization, freezing of
food transfer schemes such as school feeding programs, supplementary nutrition programme
implemented under Integrated Child Development Scheme, breakdown of food markets due
to both demand shocks and supply constraints, and healthcare failures (as already -strained
healthcare systems are forced to divert resources from routine immunization, and a range of
nutritionally important functions—like antenatal care, micronutrient supplementation, and12
prevention and treatment of childhood diarrhoea, and acute malnutrition—toward combating
COVID-19) (D. Headey & Ruel, 2020). Although the Central and State governments have
both announced several relief measures, media reports that implementation of such measures
has been poor. Further, households with political links are often better able to access such
programmes (Anderson et al., 2015; P Bardhan & Mitra, 2014b; Pranab Bardhan &
Mookherjee, 2000; Dasgupta, 2017).
It is necessary, therefore, to undertake a study that will investigate the following issues:
(i) Examine the extent to which COVID-19 affects dietary practices of women and
children;
(ii) Assess whether households are able to access government programmes aiming to
mitigate such adverse effects;
(iii) Examine whether political connections of household members increase the access of
households to government schemes, thereby reducing welfare losses; and,
(iv) Quantify the change in the welfare of women and children based on a comparison of
consumer surplus in the pre-lockdown and lockdown periods.
It is expected that regions with high levels of poverty, maternal mortality, and infant
mortality, coupled with low coverage of public health and nutrition services, and poor health
care delivery system will be most affected (HLPE, 2020). Special focus, therefore, will have
to be paid to such states, like Uttar Pradesh and Bihar (Pandey, 2020). Our study focuses on
Bihar for the following reasons:
(i) Bihar is a resource-constrained state in India, having a high prevalence of
malnutrition and anaemia among under-five children and mothers for several past
decades (see Appendix A1.1). Maternal and child malnutrition has been the largest
risk factor driving death and disability in Bihar since the 1990s (Indian Council of
Medical Research et al., 2017).
(ii) The coverage of women and children under nutrition supplement programmes is very
poor—only 30 percent of pregnant and lactating women and 40 percent of children
are covered under supplementary food programme; such coverage rates are far below
the national average (Avula et al., 2020). This already vulnerable group is likely to
become even more vulnerable due to the shock of COVID-19 and the associated
lockdown.13
(iii) Finally, state -level estimates of supply- side susceptibility using an index (based on
indicators like cropped area, irrigated areas, cold storage density, supply procurement
of cereals, the density of APMCs, and rural haats) indicate that Bihar is not well
placed (value of 55, as compared to the national average of 59) (Saroj et al., 2020).
The now completed study analysed, inter alia, dietary practices of mothers and children aged
below three years. We proposed to undertake telephonic interviews of 1,200 randomly
selected respondents out of the 2,250 respondents for whom data had been collected between
January and March 2020 in the earlier study. Additional information was collected on
changes in financial status, change in dietary practices, access to Government support
schemes, and political links of family members.
Given that COVID-19 is projected to remain for the next two years, recurring in repetitive
waves(Leung et al., 2020), and that current relief measures have implementation and leakage
related issues(Khan, 2020a, 2020b; Press Trust of India, 2020; Singh, 2020), this knowledge
should be useful in designing bailout measures to ensure better targeting of relief measures
directed to ensure food security, reduce leakages, and make such policies more inclusive.
Further, the results of this study should also help to improve service delivery to vulnerable
sections in general and in the context of disasters.
1.4 Survey design
The data used in this study was collected through a two-phased primary survey. The first
phase was conducted between January to March 2020 and was part of a previous The
International Growth Centre (IGC) funded study to examine the prevalence of maternal and
child health practices (like contraception use, availing of antenatal and postnatal care
services, institutional delivery, exclusive breastfeeding of children below six months,
complementary feeding of children above six months, etc.) in rural Bihar, and test for the role
of peer effects in motivating the adoption of such practices.
The second phase was conducted between October-November 2020 and covered a sub-
sample of the respondents covered in the first phase through a telephonic survey. The two
phases represent pre-lockdown and lockdown periods. Since data was collected about the14
recent past in either case, there is minimal recall bias in our study. In the next section, we
discuss the sampling strategy employed.
1.4.1 Sampling strategy in first phase
A multi-stage sampling design was adopted in the first phase of the survey. In the first stage,
we selected 13 districts out of 38 districts of Bihar, where the JEEViKA Technical Support
programme (JTSP) and Health & Nutrition Strategy programme (HNS) were in place during
the last five years preceding the survey. In the second stage, these 13 districts were classified
into three tercile groups based on a composite index of human development indicators,
namely, percentages of non-SC/ST population, female literacy, and male non-agricultural
labourers – using data from the 2011 census. At the third stage, two districts from each tercile
group were selected randomly. The selected districts are Nalanda and Saharsha for the bottom
tercile; Begusarai and Muzaffarpur from the middle tercile; and Purba Champaran and
Katihar from the upper tercile (see Figure 1.1). Thus, a total of six districts were selected for
the study (Table 1.2). Some important maternal and child indicators for these districts are
given in Appendix Table A1.2.
After the selection of the study districts, i.e. at the fourth stage, four community development
blocks were selected in each district based on the implementation of the JTSP and HNS
programme. Two blocks were selected randomly where JTSP and HNS programme had been
implemented during the last five years, while another two blocks were also selected randomly
from the rest of the blocks. Thus, altogether 24 (=6´4) blocks were selected from the study
districts.
Table 1.2: Selection of districts
Rank District FLITa FCPOPb MALENONAGc INDEX
1 Nawada 46.70 72.95 41.23 53.63
2 Saharsa 39.20 82.21 42.75 54.72
3 Gopalganj 53.99 84.84 29.39 56.07
4 Patna 51.04 79.95 43.91 58.30
5 Nalanda 50.24 77.01 48.58 58.61
6 Samastipur 50.63 81.02 46.99 59.55
7 Muzaffarpur 52.27 83.52 44.09 59.9615 Rank District FLITa FCPOPb MALENONAGc INDEX 8 Begusarai 52.68 84.50 42.85 60.01 9 PashchimChamparan 42.46 78.25 60.18 60.29 10 Khagaria 48.30 84.73 49.30 60.78 11 PurbaChamparan 43.41 86.70 55.30 61.80 12 Purnia 39.28 83.57 63.93 62.26 13 Katihar 41.59 85.51 63.51 63.54 Notes a. 100 * (Literate female / Female pop aged above 7 years) b. 100 * (Population - SC & ST population) / population c. 100 - Male Agricultural Main & Marginal workers as %age of Total Male Main workers At the fifth stage, five villages from each block were selected by employing the probability proportional to size sampling (PPS) method. As the name suggests, in the PPS method, the likelihood of selecting large villages is higher, compared to relatively smaller villages. This ensures in capturing adequate socio-economic variations in the study samples and helps in the generalization of results from the study. A total of 120 villages (=6 districts ´4 blocks ´5 villages) were selected. At the last stage, 20 women comprising ten JEEViKA members and ten non-members were selected from each village. The recruitment criterion was that the respondent had at least one living child aged below three years, and was a permanent resident of the village. Thus, the total sample size of the study stands at 2400 (=6 districts ´4 blocks ´5 villages ´20 respondents). The final list of districts, blocks, and villages is given in Appendix Table A2.3. As some villages may ‘vanish’ over time – due to changes in the flow of the river, dwindling population, renaming, etc. – an additional village was identified for each block.
16

                       Figure 1.2: Map of Bihar showing survey districts

Data were collected by a trained group of Field Investigators using a structured questionnaire,
eliciting information on individual characteristics of the respondent, and consumption of the
respondent and children aged below three years. The questionnaires were pre-tested on 100
respondents at Vaishali village, in the Vaishali district on 23rd December 2019, followed by a
feedback session.5 In the third week of March, the outbreak of COVID-19 in India, followed
by the announcement of a national level lockdown, forced us to abandon the data collection
before it could be completed. At that point, data had been collected for 2250 respondents.

1.4.2 Data collection in second phase
In the second phase of the survey, a list of all respondents was prepared. Respondents who
had not provided us with their mobile numbers — either because they did not have any, or
because they did not want to give us their contact number — were dropped from the list.

5
  Before administering the questionnaires, investigators obtained verbal informed consent from the study
participants by reading out a statement explaining why the study was being conducted and guaranteeing that the
information provided by the participants would be kept confidential and used only for research purposes.
Moreover, the voluntary nature of participation in the study was emphasized in the statement of informed
consent.
17 Respondents with children below 3 months were also dropped. In view of travel restrictions, the remaining respondents were contacted over mobile and a telephonic survey was conducted,6 eliciting information on consumption of the original respondent and her youngest child, the financial status of the household, and access to government relief measures during the lockdown period, and political links of family members. Since the respondents were acquainted with our survey team, lengthy introductions at the onset of the telephonic interview were avoided. This shortened duration of the interview, reducing refusal rates. It also eliminated recall bias as information on the pre-COVID-19 period has already been collected. We had planned to cover 1200 respondents, out of 1,652 respondents who satisfied the recruitment criterion (having children aged between 3 to 36 months at the time of the first survey), but ultimately managed to cover 1148 respondents. The response rate was 70 percent, which is satisfactory. The main reason for refusal was the failure to contact the original respondent as the mobile was not working, or was switched off. Refusal after contact was negligible (and below five percent). The profile of age, education, asset score, socio- religious identity, and husband’s occupation of respondents who were selected in the second phase and who were not selected are given in Appendix Table A1.4. Selected respondents have higher asset scores; differences between the two groups with respect to other characteristics are marginal. 1.4.3 Sample characteristics The sample profile is given in Appendix Tables A2.5 (for continuous variables), and A2.6 (for categorical variables). The mean and median age of respondents is 25 years, with marginal variations across districts. Years of education have a mean and median of 5.74 and 6.00 years, respectively. It varies from 4.5 years (Saharsa) to 6.5 (in Begusarai and Katiahar). The mean and median age of first marriage is quite low (17 years), without inter-district variations. The mean number of living children is 2.67, while the median is 2.00. Marginal inter-district variations are noted. Asset scores range from -0.26 (Saharsa) to 0.70 (Nalanda), with a mean of 0.10 and a median score of 0.08. The district-wise distribution of categorical variables is given in Appendix Table A2.6. In Begusarai and Muzaffarpur the proportion of respondents without education is higher than in 6 The introduction of mobile phones has increased tele-density in India—it is 57.59 connections per 100 persons in rural areas (Telecom Regulatory Authority of India, 2020). Hence, telephonic survey is a viable survey method, even during COVID-19 (National Council of Applied Economic Research, 2020).
18

 other districts; in Nalanda and Katiahar, on the other hand, the proportion of respondents with
 11-17 years of education is higher vis-à-vis other districts. Overall, the highest proportion of
 respondents has 6-10 years of schooling, with 30 percent not having any education at all.

 Other Backward Castes (OBCs) comprise the majority of the sample (58 percent); the
 proportion of Hindu Forward Caste (FC) respondents is high in Nalanda, Muzaffarpur, and
 Purva Champaran. Muslims comprise about 21 percent of the sample in Katiahar. We find
 that 15 percent of the sample are engaged in any income -earning activity; the proportion is
 highest in Purva Champaran (23 percent), and lowest in Begusarai (6 percent). Family size is
 quite large, with about 86 percent of respondents residing in families with 6-10 members.
 Male children comprise a slightly higher proportion of the sample (53 percent); the
 percentage of male children is about the same in all districts.

 1.5 Methodology
 1.5.1 Consumption indicators
 The outcome variables studied relate to the consumption of specific food groups. The
 following food groups were considered for both the mother and child:
   (i)   Cereals and potatoes;
  (ii)   Pulses and nuts;
 (iii)   Eggs;
 (iv)    Fish and meat;
  (v)    Milk and dairy products;
 (vi)    Fruits that are yellow or orange inside;
(vii)    Dark green and leafy vegetables; and,
(viii)   Other fruits and vegetables.

 Information was collected on the number of times the child had been given the specific food
 group. The recall period for the child was the day preceding the survey in the first phase; in
 the second period, it was an average day during the lockdown. This was recoded in binary
 form, with zero and one being recoded as zero, and two and above being coded as one. In
 addition, a binary indicator for Minimum Dietary Diversity was estimated (USAID et al.,
 2010); its value was one if the child had partaken of items from at least four food groups, and
 zero otherwise.
19

The mother was asked whether she consumed items from each food group daily, weekly,
infrequently, or never. Responses were recoded as zero (if response was infrequently, or
never), and one (if response was daily, or weekly). The recall period for the mother was
weekly because the diet of adults is known to vary with exogenous causes like the presence
of guests, family occasions, etc. Using this information, a Minimum Dietary Diversity was
estimated if she consumed items from at least four food groups (FAO and FHI 360, 2016).
These indicators were estimated for both mother and child in both pre-lockdown and
lockdown periods. Another indicator of consumption used is the number of food groups
consumed by the mother and child, respectively. It is referred to as Dietary Score (Swindale
& Bilinsky, 2006).

1.5.2 Dietary practices
Using the above information, we created a transition matrix (Pk´k). The matrix indicates the
association between pre-lockdown and lockdown consumption levels. An element, pjk, in this
matrix indicates the probability that the lockdown consumption falls in the ith category, given
that pre-lockdown consumption was in the jth category. The diagonal indicates stability in
consumption levels, while above (under) diagonal cells indicate improvement (deterioration)
in consumption levels after lockdown. Using the matrix, we estimated four measures to
estimate whether consumption levels have remained stable, or changed over the study period.

The measures are:
       Shorrocks-Prais Index (Shorrocks, 1978):
               K-Trace(P)
                  K-1
                            , when K is the dimension of the symmetric matrix P
                                                      ∑i ∑j pij | i-j|
       Bartholomew Index (Bartholomew, 1973):            k(K-1)

       Eigenvalue-based index (Sommers & Conlisk, 1979):
               1 - |l2|, when l2is the second largest eigenvalue
       Determinant-based Index (Shorrocks, 1978):1 - |P|
The indices are estimated using the user-written package “igmobil” in Stata I/C version 15
(Savegnago, 2016).

Univariate statistical tests of means were used to test whether Dietary Score (DS) and
percentage of respondents complying with Minimum Dietary Diversity (MDD) have changed
over the study period, for different sub-samples. Specifically, we examined variations in
20
these indicators over the education of respondents, socio-religious identity, and asset holding
classes. Such analysis was followed by an econometric exercise that sought to identify
variables determining recoded versions of these two indicators. In the case of DS, for
instance, the regression was run on:
DDS = DSt+1 – DSt + 8
when DS is the Dietary Score of an individual, t represents the pre-lockdown period, and t+1
represents the lockdown period. The number eight is added to ensure that DDS did not have
negative values. It was done so that we could estimate both Ordinary Least Square (OLS) and
count models. Although both models were estimated, OLS models gave better results, and we
reported it.
In the case of MDD, we created four categories:
(i) Did not comply with MDD norms in either period;
(ii) Deteriorated: Complied with MDD norms before lockdown, but not subsequently;
(iii) Improved: Complied with MDD norms only in lockdown phase; and,
(iv) Complied with MDD norms in both periods.
Since it is difficult to ordinally rank these categories, we estimated a multinomial model. The
assumption of Independence of Irrelevant Alternatives has to be satisfied by multinomial
logit models; instead of testing whether this assumption is satisfied or not, we estimated the
multinomial probit model.
Given the clustered nature of our data, heteroscedasticity may occur, leading to
overestimation and underestimation of z-statistics. We, therefore, clustered the data at the
village level to obtain robust standard errors. The following possible determinants were
considered:
(i) Consumption of mothers: Age, education, and socio-religious identity of the
respondent, husband’s occupation, whether respondent worked, household size, asset
score, whether the husband was migrant, land ownership, ownership of the milch
animal, possession of ration card, and contacts with pradhan or ruling political party.
(ii) Consumption of children: Age, and gender of the child, education and socio-religious
identity of the mother, father’s occupation, whether mother worked, household size,
asset score, whether the father was migrant, possession of ration card, and contacts
with pradhan or ruling political party.21
1.5.3 Access to Government schemes
In addition, we also obtained information on whether the respondent had access to
government schemes. Access to the following schemes was examined:
a) Public Distribution System:
(i) Whether received cash transfer of Rs.1000 against ration card: Coded as No
(0) or Yes (1);
(ii) Whether received free rations of 5 kg rice and 1 kg pulses per person per
month: Coded as No (0) or Yes (1);
(iii) Number of months’ respondent’s family received 5 kg rice and 1 kg pulses;
b) Pradhan Mantri Ujjwala scheme:
(i) Whether received subsidised LPG cylinder: Coded as No (0) or Yes (1);
(ii) How many times respondent’s family received LPG cylinder: Coded as No (0)
or Yes (1);
c) Jan Dhan account:
(i) Whether received any transfer into Jan Dhan account; Coded as No (0) or Yes
(1);
(ii) How much money was received in Jan Dhan account: Coded as 0 (Did not
receive), 1 (Received Rs. 1, 000) and 2 (received Rs. 1,000, or more).
d) Mid-day meal scheme: Whether any children from family received cooked or
uncooked food under the Mid-day meal scheme.
After descriptive analysis, based on tabular and graphical analysis, we estimated probit
models (if the dependent variable is binary), and ordered probit models (if the dependent
variable has several ordered categories). A village- level clustering strategy was employed
when estimating these models. Explanatory variables included the socio-religious identity of
respondent, husband’s occupation, asset score, whether family belongs to the same caste as
pradhan, and contacts with pradhan or ruling political party.
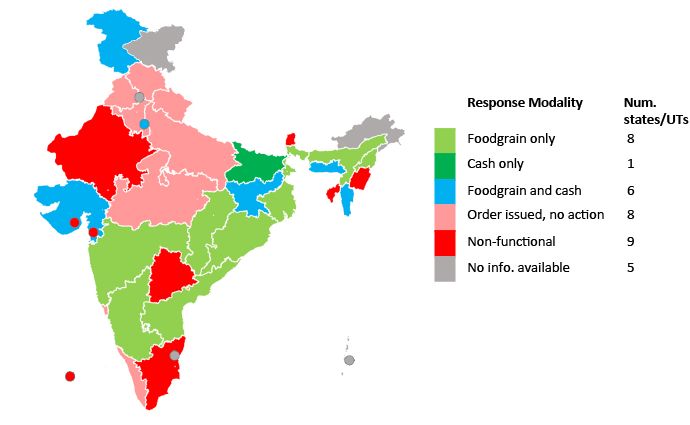
1.5.4 Welfare change
We have also estimated the welfare change of mothers and children using the Willingness to
Pay (WTP) approach (Fig. 1.2). Under this approach, the actual payment (OEDC) and
maximum WTP (OAB) are first estimated. The difference (EAD) is the consumer surplus. It
is estimated for the pre-lockdown and lockdown periods, and the difference in the consumer
surplus between the two periods is the welfare change.22
A
D
E
O
C B
Figure 1.3 Willingness to pay and welfare
Empirically, the WTP was estimated using a probit model (Lopez-Feldman, 2016). This
model regresses whether a person is willing to pay or not (= 0 if the actor is not willing to
pay, = 1 if the actor is willing to pay) upon bid levels and the socio-economic characteristics
of the respondents.
Yi = a + bBIDi+ cXi
when
Y = 0 if the actor is not willing to pay, = 1 if the actor is willing to pay;
BID is the amount requested from the actor; and,
X is a vector of control variables.
a + cX$i
The mean WTP is given by .
b
As our survey was undertaken over the telephone, a detailed Contingent Valuation type
survey could not be undertaken. Nor was it feasible to obtain prices of different commodity
items — even if the housebound women, who were our respondents, had the information.
Instead, we obtained information on the time taken to collect rations from the PDS shops
before and during the lockdown. These opportunity costs are taken to be a proxy of the actual
price paid by respondents. The dependent variable was whether pulses were consumed or not.
The control variables were whether the husband is a migrant (for mother), and age of the23
child, years of schooling of mother and whether the father is a migrant (for children).7 The
welfare change was estimated for the entire sample, as well as sub-samples based on asset
tercile classes. We had originally planned to estimate welfare change for cereals also;
however, as cereal consumption was universal, we estimated welfare change using only pulse
consumption.
REFERENCES
Acharya, R. (2020, July 1). Reduced food and diet quality, and need for nutrition services
during COVID-19: Findings from surveys in Bihar and Uttar Pradesh - IFPRI South
Asia Office. IFPRI -South Asia Blog. https://southasia.ifpri.info/2020/07/09/15081/
Adewopo, J., Hermosilla, G. S., Micale, F., & Cohen, L. (2020, November 17).
Crowdsourced data reveals threats to household food security in near real-time during
COVID-19 pandemic | IFPRI : International Food Policy Research Institute. IFPRI
Blog. https://www.ifpri.org/blog/crowdsourced-data-reveals-threats-household-food-
security-near-real-time-during-covid-19
Anderson, S., Francois, P., & Kotwal, A. (2015). Clientelism in Indian Villages. American
Economic Review, 105(6), 1780–1816. https://doi.org/10.1257/aer.20130623
Anema, A., Vogenthaler, N., Frongillo, E. A., Kadiyala, S., & Weiser, S. D. (2009). Food
insecurity and HIV/AIDS: Current knowledge, gaps, and research priorities. Current
HIV/AIDS Reports, 6(4), 224–231. https://doi.org/10.1007/s11904-009-0030-z
Avula, R., Kaur, S., & Menon, P. (2020, May 20). Protecting India’s health and nutrition
programs amidst COVID-19 pandemic - IFPRI South Asia Office. IFPRI -South Asia
Blog. https://southasia.ifpri.info/2020/05/20/protecting-indias-health-and-nutrition-
programs-amidst-covid-19-pandemic/
Bardhan, P, & Mitra, S. (2014a). Political participation, clientelism and targeting of local
government programs: analysis of survey results from rural West Bengal, India.
Working Paper, Boston University, 02215, 1–42.
http://www.isical.ac.in/~eru/erudp/2008-03.pdf
Bardhan, P, & Mitra, S. (2014b). Political participation, clientelism and targeting of local
7
In the first stage the probit model for mothers was estimated on BID, socio-religious identity, asset score,
household size, whether respondent works, occupation of husband, and whether he is a migrant; in case of
children, education of mother, age and gender of child, and number of living children was added. The variables
whose coefficients were insignificantly different from zero were dropped. WTP was estimated for the reduced
models. Stata codes were taken from Lopez-Feldman (2016).You can also read