HHL - Leipzig Graduate School of Management User Behavior in Second Life: An empirical analysis and its implications for marketing practice
←
→
Page content transcription
If your browser does not render page correctly, please read the page content below
HHL – Leipzig Graduate School of Management

        User Behavior in Second Life:
  An empirical analysis and its implications
             for marketing practice

                   Kathrin Jung

               Manfred Kirchgeorg

            HHL-Arbeitspapier Nr. 80

     Copyright: Lehrstuhl Marketingmanagement
                    Leipzig, 2007

    Jede Form der Weitergabe und Vervielfältigung
      bedarf der Genehmigung des Herausgeber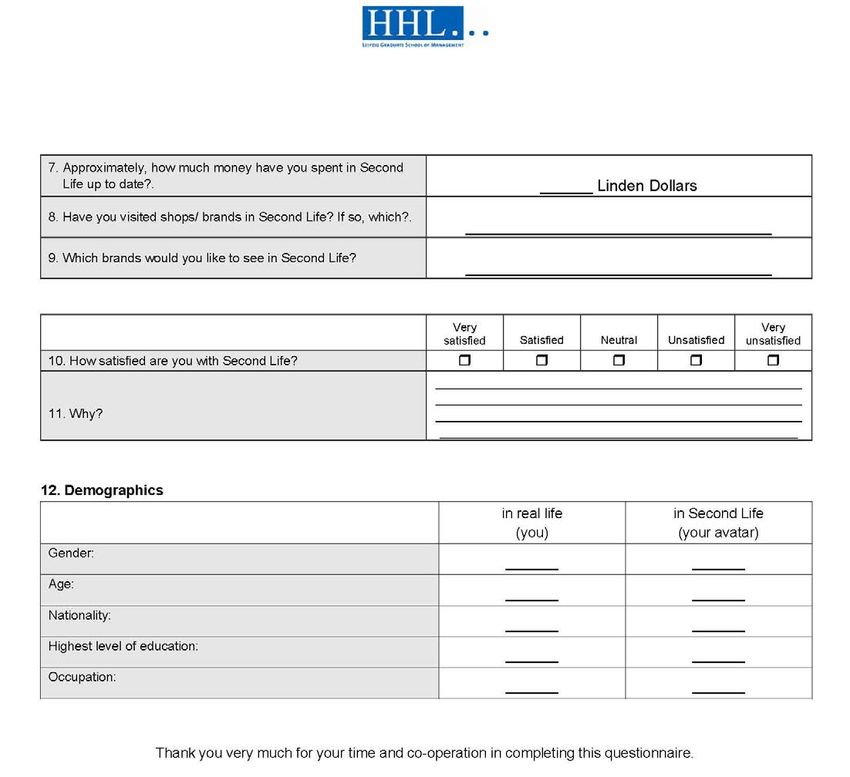
I

Summary

As changes in technology continue to advance and adapt to consumer needs, virtual
online worlds such as Second Life are spawning at a rapid rate providing customer
interaction and integration as well as new untapped portals for marketing science and
applications. This article summarizes results from an empirical research study in
Second Life undertaken by HHL – Leipzig Graduate School of Management in
Germany. The analysis focuses on selected aspects of user behavior and how
traditional marketing concepts may evolve with respect to these new virtual worlds.
The authors identify different user clusters in Second Life, including those
respondents who primarily seek contacts and those who wish to be someone
completely different.

Virtual online worlds do not simply represent an additional communication tool, but
rather require every aspect of marketing planning to be just as efficient, almost
doubling the communication planning efforts. This being said, it is demonstrated that
these virtual worlds offer various new opportunities for marketing. After comparing 3D
online worlds with other communication categories, a complete overhaul of traditional
communication mix instruments solely with e-marketing is not foreseeable.
II

Index

Index....................................................................................................................... II

List of Figures and Tables ..................................................................................... III

List of Abbreviations .............................................................................................. IV

1.      Introduction .................................................................................................... 1

2.      Methodology and Questionnaire .................................................................... 1

3.      Empirical Results ........................................................................................... 3
        3.1 Second Life Registration and Usage........................................................ 4

        3.2 Socio-demographics ................................................................................ 5

        3.3 Avatar Personality and Motives for Participation in Second Life .............. 8

        3.4 Activities and Expenditures within Second Life ...................................... 10

        3.5 Satisfaction with Second Life ................................................................. 13

        3.6 Segmentation of Second Life Users....................................................... 15

4.      Marketing Implications ................................................................................. 18

5.      Outlook......................................................................................................... 21

References ........................................................................................................... 23

Appendix I............................................................................................................. 26

Appendix II............................................................................................................ 27

Appendix III........................................................................................................... 28

List of HHL Working Papers ................................................................................. 30
III List of Figures and Tables Pic. 1: Theoretical framework of empirical study (SOR Model).............................. 2 Pic. 2: Second Life usage per week ..................................................................... 5 Pic. 3: Nationality of respondents .......................................................................... 6 Pic. 4: Age distribution within sample .................................................................... 7 Pic. 5: Avatar’s personality .................................................................................... 9 Pic. 6: Motivating factors for joining Second Life ...................................................10 Pic. 7: Activities within Second Life .......................................................................11 Pic. 8: Linden Dollars spent in Second Life at time of study .................................12 Pic. 9: Cluster results for motivation factors...........................................................17 Pic. 10: Second Life marketing as an integral part of the overall marketing mix......19 Table 1: Average duration of residency in Second Life ........................................... 4 Table 2: Comparison of communication categories..................................................20
IV

List of Abbreviations

a.o.             and others
edn.             edition
ed.              editor
et al.           et alii
etc.             et cetera
GMI              Global Market Insight (company name)
i.e.             for example (Latin: 'id est')
n                number of cases
no.              number
p                significance level
pic.             picture
sig.             significance
SL               Second Life
std. deviation   standard deviation
US               United States
vol.             volume
3D               three dimensional
1
1. Introduction
Over the past few months, interest in Second Life (SL) at both the personal and
corporate level has seen continuous growth. In August 2007, the population of SL
registered inhabitants easily surpassed 9 million thus sparking interest from
corporations and their marketing departments.1 As growth and investment continue2,
knowledge about this program and their users remains widely unknown. Given this
circumstance, HHL has conducted a research project in Second Life with the intent to
have a closer look at the current user structure and their needs. Key questions we
address include:
I.) What motivates people to join Second Life?
II.) Can we identify different homogenous groups within Second Life?
III.) Consequently, to what extent will this 3D online world3 impact the traditional
marketing mix?
This paper is divided into four parts: 1) the research methodology and questionnaire,
2) the study results consisting of mean comparisons and cluster analysis, 3)
marketing recommendations, and 4) the outlook.
2. Methodology and Questionnaire
The analysis is based on an empirical study which required interviewing active
Second Life users. 106 questionnaires were collected from respondents who have an
active avatar4 in Second Life. From April to May 2007, 30 interviewers collected data
by directly conducting 25 minute interviews with the participant’s avatar in Second
Life.* As data collection via this procedure showed to be very difficult and time
consuming, respondents were also targeted in Second Life online blogs, asking them
1
Source: Second Life official data (http://secondlife.com/whatis/economy_stats.php).
2
Forecast using fitted second-degree polynomial trends project 225 million total Second Life residents
by March 2008 (Fetscherin/Lattemann 2007, p.8).
3
The expression 3D online world, virtual online world, digital online world and virtual world are used
synonymously in the paper.
4
An avatar is graphically generated individual/ identity used in computer games, virtual online worlds
or on websites. It is created by a real person or company and either is similar to the real
personality of human being or purely invented.
* We wish to extent our special thanks to the students of course MM1- Spring Term 2007 at HHL-
Leipzig Graduate School of Management for their assistance with the data collection.
Furthermore, our thank you goes to Mr. Blake Giles from the University of Illinois at Urbana-
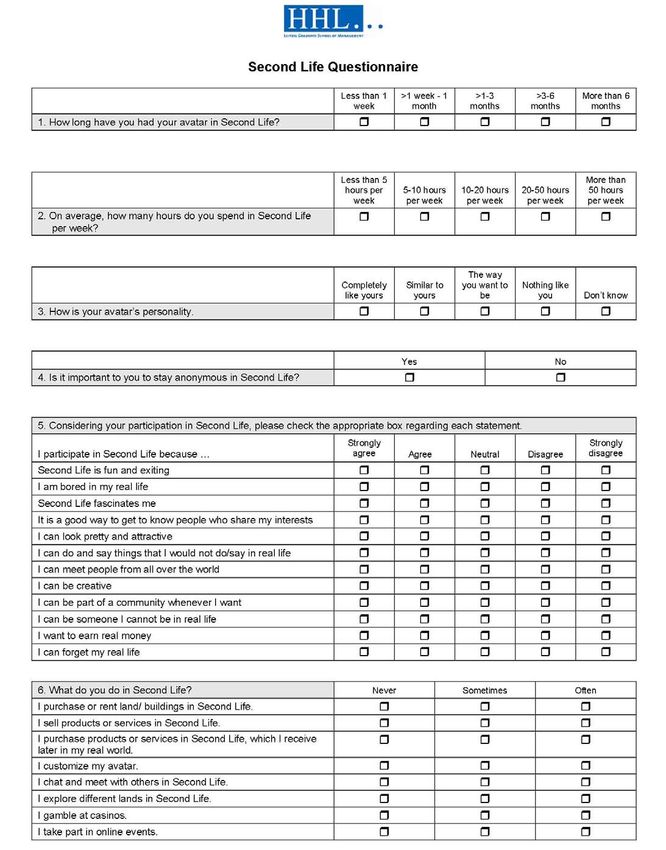
Champaign for his help in phrasing this article2 to respond to a questionnaire that would be sent to them via e-mail. Once again, the sole prerequisite for participants partaking in our survey was to be a registered, active participant in Second Life with their own avatar. Overall, the data collection is based on a convenience sample and no incentives were offered to respondents. The research study builds on the theoretical framework of a Stimulus-Organism- Response Model (pic. 1). It represents the basis for explaining SL user behavior (Sheth et al. 1999; Kroeber-Riel/ Weinberg 2003; Domjan 2005). After a pre-test, the questionnaire had to be reduced to fewer questions as too many respondents had walked away from the interview before it was completed. Hence questions regarding marketing stimuli were taken out and conclusions are based primarily on secondary data and partly drawn from open-ended questions. Pic. 1: Theoretical framework of empirical study (SOR Model) The final study questionnaire includes 12 questions, which at times consist of a long list of sub-items resulting in 40 individual questions. Measurements varying between a 3- and 5- point scales were applied. Various open-ended questions are included within the questionnaire to further shorten the length of the interview but still allow for sufficient participant feedback. The following sub-topics give an overview of the content structure of the final questionnaire:
3
Reasons for joining Second Life
Socio-demographic data for actual person and their avatar
Overall level of satisfaction and reasons
Desired brands for Second Life
Time of SL registration
Avatar personality
Usage duration per week
Activities within Second Life
Expenditures in Second Life
One example of the final questionnaire is attached in the appendix.
3. Empirical Results
The data analysis is conducted in SPSS (Statistical Package for Social Science)
using mean value comparisons and frequency tables based on a data set of 106
completed questionnaires. Finally, a K-mean cluster analysis leads to three clusters
of homogeneous respondents showing interesting response patterns.
Overall, the data is of good quality. Statistical tests prove the reliability of scales and
consistency of answers. Our ratio of questions given to responses received averages
around 85%. Socio-demographic questions for the avatar, such as “avatar
profession” and “avatar education” etc. were occasionally left blank. Taking into
account the open-ended questions and answers received, we are assuming that
respondents did not respond for one of the following reasons: a) they had not thought
about these details, perhaps because they may not be deemed relevant, b) they left
answers blank due to laziness or unwillingness, or finally c) they did not answer
because the user has not partaken in Second Life long enough to deem the question
as applicable.4
Although socio-demographic data given officially by Linden Lab5 varies slightly from
those in the sample, especially in terms of represented nationalities, it was decided
not to use weights for these groups of respondents as the data from Linden Lab only
displays user account statistics; showing, for example, whether or not the user is
registered but not whether or not he is truly active or inactive. Available statistics
show that around 18% of registered Second Life accounts can be considered active
residents.6
3.1 Second Life Registration and Usage
The survey sample includes short-term and long-term Second Life users. Table 1
shows the distribution. Almost one third of respondents can be characterized as
short-term residents meaning that they have had their avatar one month or less. 16%
of respondents fall into the category of long term Second Life inhabitants. Their
avatar’s lifetime accounts for at least six months at the time of the survey.7
Table 1: Average duration of residency in Second Life (n= 106)8
5
Linden Lab is the American company based in San Francisco which created and manages Second
Life.
6
Percentage is based on Linden Lab’s published information and estimations from other researchers.
We define an active user as having to be logged in Second Life at least once during a period of
60 days. The percentage also takes duplicate accounts into consideration.
7
Overall, we follow the argumentation of other researchers by stating that the current Second Life
userbase belongs to the group of innovators and early adopters (Fetscherin/Lattemann 2007, p.
13).
8
Within this paper all empirical results are stated in continental European format (i.e. 100,0%).5
Almost 30% of the respondents spend more than 20 hours per week in Second Life
(pic. 2). Comparing heavy users with light users, 9,4% of respondents fall into the
heavy user category meaning they participate in the virtual world more than 50 hours
per week. There is a significant positive correlation between date of user registration
for SL and time spent in SL, portraying that on average users find enjoyment being
active in 3D online worlds and tend to continue their participation. The cross
tabulation of usage and nationality did not lead to significant differences.
% of respondents
25%
23,7%
22,6% 22,6%
20% 21,7%
15%
10%
9,4%
5%
SL usage
0% per week
Less than 5 >5-10 hours >10-20 hours >20-50 hours More than 50
hours per per week per week per week hours per
week week
Pic. 2: Second Life usage per week (n=106)
3.2 Socio-demographics
Respondents within the sample come from 20 different nations, of which Germans
and Americans represent the largest groups (pic. 3). Given the original data statistics
from Linden Lab, we conclude that our sample may include a slight interviewer bias
resulting in an overrepresentation of German residents.9 Due to the fact that Second
Life was created in America, Americans probably represent the largest user group at
9
Hence, this study might be biased towards German users, thus results should be interpreted with
caution.6
present.10 The small size of the Asian group may be due to English language
problems and the fact that Hipihi (http:/hipihi.com) has been a successful duplicate of
the Second Life concept targeting Chinese users.
SL sample by nationality World Internet users June 2007
Pic. 3: Nationality of respondents (n=95) compared to world internet users per June
2007 (Source: www.internetworldstats.com)
The average age within the sample is 30,2 years and lies only marginal below the
official number of 33 years published by Linden Lab. The youngest respondent is 17
years old whereas the oldest ages 57. In general, Second Life is targeted at people
at least 18 years of age. Picture 4 shows the age distribution for the sample and
displays that the largest age group ranges from 21-25 years. The percentage of
users decreases for each age category after 21-25 with the exception of ages 41-45.
10
This fact is supported by a study including approximately 250 Second Life users done by M.
Fetscherin and C. Lattemann in June 2007. They prove that the majority of Second Life
inhabitants comes from the US by looking at the time distribution of online activities.7
% of respondents
35%
30% 30,9%
25%
23,4%
20%
15%
13,8% 13,8%
10%
8,6%
5% 7,4%
2,1%
Age group
0% (in real
life)
16-20 21-25 26-30 31-35 36-40 41-45 > 46
years years years years years years years
Pic. 4: Age distribution within sample (n=94)
Looking at the artificial age of the avatars, there are no major observable differences.
Respondents mostly keep their real age in Second Life. However, for 24% of the
target group, a difference in their actual age and their avatar’s age is observable. Of
these, most were older than 32 in real life and created avatars a few years younger.11
The proportion of female Internet users has been on the rise continuously over the
past years. Currently, 53,8% of German women and 67% of German men confirm
that they surf the World Wide Web ((N)Onliner Atlas 2007). Our sample includes
responses coming to 54,3% from men and to 45,7% from women. Comparing these
percentages to Internet user statistics, it can be concluded that the proportion of
women is a little higher in Second Life than in general Internet use.
11
This fact is supported by a study carried out by a market research solutions provider named Global
Market Insite (GMI) located in Seattle, USA. The company conducted a survey among 10.000
respondents, of which 479 were Second Life users. Although the sample seems slightly skewed,
the study shows as well that nearly a quarter play another gender. In addition, the study found that
the same percentage of Second Life users change to another race. On the other hand, our study
contradicts the GMI results of respondents changing nationalities. Within our survey, this was only
observed for 1% of the answers.8
More than half of the participants have received or are in the process of completing
some form of college degree.12 This high number may seem surprising, but the fact
that Second Life is only offered in English at this point means that a high proficiency
of English is required. This also will affect results in age and nationality. In addition,
the 3D world requires a complex understanding of its functionality. It can also be
assumed that various business men and academic researchers are currently
investigating Second Life for new opportunities in their respective fields. Thus, it
seems logical that the users of Second Life have a higher educational level
compared with the overall internet community.13 Various respondents do not give an
answer regarding their profession in Second Life. Students, representing 17% of the
total, are the largest group among the respondents, followed by managerial, technical
and sales professionals accounting each for 10% of the sample. We explain the high
percentage of students also with the fact that 28 of the 30 interviewers were students
who probably went to SL venues that are attractive to this sub-group. If an answer is
given, we noticed that respondents from the business sector switched their
profession to more creative categories such as a photographer or a designer.
3.3 Avatar Personality and Motives for Participation in Second Life
Various researchers have already dealt with the phenomenon of contemporary
avatars (Kolko 1999; Webb 2001; Cooper et al. 2006), as those have been used
either in online games or by companies as virtual sales agents on their websites.
Within our survey, we questioned respondents regarding their avatar’s personality.
The results display, that respondents can be categorized into two groups: those
whose avatars relate to their personality in actuality and those whose avatars differ
from their actual personality (pic. 5). Almost one fourth of respondents admit that
their avatar is a depiction of who they would like to be. For 55% of the respondents, it
is important to stay anonymous in Second Life.
12
Some form of diploma, bachelor or master’ degree.
13
This fact is supported by a representative analysis that was carried out by the Forschungsgruppe
Wahlen Online in Germany concluding that the higher the educational level the higher the
percentage of Internet involvement. The previous survey conducted by Global Market Inside
found that 65% of Second Life users have a college degree or higher, supporting our results, too.9
Question: How is your avatar's personality?
You don't know 2,8%
Nothing like you 21,2%
The way you want to
be
23,2%
Similar to yours 37,5%
Completely like yours 15,3%
% of
respondents
0% 10% 20% 30% 40% 50%
Pic. 5: Avatar’s personality (n=104)
Looking at the reasons for joining Second Life, most respondents state that their
primary reason for participation is to meet people from all over the world, they also
find Second Life to be extremely fun and fascinating (pic. 6). Currently, discussions
are intensifying that Second Life will lead to disturbed personalities and less face-to-
face interaction, hindering their real lives. However, within the study, reasons such as
“wanting to forget real life” and “being bored in real life” rank among the least
applicable.14
Nevertheless, looking at the individual questions, 20,8% of respondents stated that
they partake in Second Life because they are bored in the real world, and 14,1%
indicate that they want to forget their real life. As expected, both questions show a
significant correlation of 0,450. A cross-tabulation between the amount of time spent
in SL per week and the motives for Second Life activity reveals that there is a relation
between these dimensions (appendix I). The results indicate that those who have
problems with real world interpersonal relationships tend to spend more time in
Second Life than others.15 Although, the analysis does not allow us to conclude that
Second Life causes an increase in social anxiety, we identified a certain proportion of
14
These results go in line with an analysis done by De Nood and Atempa in 2006.
15
Findings of the GMI report display that 24% of the surveyed respondents want to escape real life,
which they were not satisfied with.10 the sample that is characterized by the use of Second Life to escape their real worlds. This group may face the danger of loosing touch with reality in the long run. There are other studies which have shown that social anxiety increases with longer usage times of online games (Cyranek 2002; Shao-Kang et al. 2005). Pic. 6: Motivating factors for joining Second Life (n=94, mean values) Looking at cross-cultural differences in the current study, again, no significant differentiation could be found. For the element “I can do/say things I could not do/say in real life”, Americans showed a tendency to higher agreement compared to Germans and other nationalities, whereas among German respondents more people confirmed the motivation of wanting to make money in Second Life. 3.4 Activities and Expenditures within Second Life The results based on current activities in SL clearly show that the life cycle of Second Life has just begun (pic. 7). Most respondents state that they enjoy chatting with
11

others as well as visiting other virtual lands, while others tell that they like
customizing their avatar. 56% admit participating in online events. At this point, only
2% state that they often purchase products or services in Second Life for their real
life. However, in the future this percentage is expected to increase significantly as
business presence will increase as well as assumed curiosity. Already today, 16% of
the respondents have admitted buying products in their real lives after a thorough
testing of those same products in Second Life at least sometimes. In countries where
SL has been in place for longer, interviewed Second Life inhabitants show a higher
percentage of real life purchases. This fact is supported by looking at cross-country
comparisons showing that Americans claim to sell products and services more often
than the total sample.16

In the future we believe virtual worlds such as Second Life will experience a growing
interest by information seekers. However, effective search mechanisms have to be
implemented.

     % of respondents                                         2,0%                                                           Never     Sometimes    Often

     100%
                13,5 %             15,7%                                                                                       11,8%               16,7%
      80%
                                                                         47,6%
                                                                                                             59,4%
      60%                                                                                  74,8%

      40%

      20%

       0%
             I purchase or    I sell products or      I purchase      I customize my   I chat and meet       I explore       I gamble at      I take part in
                rent land/        services in        products or          avatar.       w ith others in different lands in     casinos.      online events.
               buildings in      Second Life.        services in                         Second Life.      Second Life.
              Second Life.                           Second Life
                                                   w hich I receive
                                                   later in my real
                                                         w orld.

Pic. 7: Activities within Second Life (n=102)

The question regarding spent money is answered diversely as picture 8 illustrates. A
large group has spent no or very little money in Second Life thus far. The highest
amount mentioned is 600.000 Linden Dollars in expenditures which equals around

16
     Compare Fetscherin/Lattemann 2007, p. 16 for willingness to pay. Moreover, the study found that
       42% of the respondents are willing to use their credit card to purchase in Second Life.
12
2.200 US Dollars.17 Those more familiar with the system have discovered wide
opportunism where to receive virtual goods for free. In order, to be visible on the
Second Life virtual map, some companies have been paying Second Life users to
spend time at their Second Life venue. Overall, there is a small positive correlation on
a significant statistical level between amount of time and amount of money spent in
Second Life. Hence, the longer the time of SL residency, the more money users
spend.
% of respondents
35%
33,0%
30%
25%
20% 21,7%
15% 17,0%
10%
10,4% 10,4%
7,5%
5%
0% Linden
Dollars
0 >0-900 >900- >9.000- >90.000- No answer
9.000 90.000 600.000
Pic. 8: Linden Dollars spent in Second Life at time of study (n=98)
Moreover, 60% of respondents mention that they have visited shops in Second Life.
Two market segments are named more frequently than others: the clothing market,
referencing H&M, Reebok and Nike to name a few; and the electronic segment,
highlighting IBM, Dell and Sun Micro Systems. Also briefly stated were hotel and
tourism agencies, the automotive industry and Reuters publishing. When asked
which brands users would like to see in Second Life, most respondents stated that
they would like to see more representation of the luxury goods sector, perhaps
because it is an area many do not have easy access to in the real world due to social
class or income level. They express that well-known companies and designers
17
$ 1 US equals 268 Linden Dollars in Second Life. Linden Dollars is the artificial currency in Second
Life and can be exchanged from and into real world money.13
should establish themselves in Second Life markets as well, perhaps to preview
products before a real life purchase or to allow complete fulfillment of fantasies that
cannot be satisfied in the real world. Desired brands mentioned by the respondents
include Chanel, Gucci and Ferrari.
Based on the GMI survey, 78% of those surveyed said real world advertising in SL
would positively influence their real world purchasing decisions. Given these
answers, it could be concluded that the target groups seem to deem visual
attractiveness or status as a high priority in Second Life and perhaps in their real
lives as well. Earlier, we have described the higher educational level of the Second
Life users also having an impact on these findings. We believe that companies may
not be successful with simple combined presences in Second Life. Companies such
as Deutsche Telecom that have precisely re-copied their actual building into Second
Life with very little creativity have experienced drastic problems attracting visitors to
their virtual venue. Overall, the inspiring environment in this 3D world is a major
differentiating factor and emotionally-oriented business presentations seem to be the
most desired.
3.5 Satisfaction with Second Life
On a satisfaction scale with 1 meaning “very satisfied” and 5 meaning “very
dissatisfied”, Americans displayed the highest level of satisfaction (mean = 1,53) in
Second Life, whereas Germans average at 2,19 and the total sample at 2,01. Those
who were dissatisfied with Second Life usually encountered technical difficulties
which take away from the flow of the program and overall enjoyment. Those who
were satisfied expressed that they enjoy the freedom, the possibilities, and the
creativity of Second Life. In spite of the frequent occurrences of glitches, bugs,
updates or other technical setbacks, surprisingly, the overall satisfaction with Second
Life is high.18
18
Second Life is often classified as an “online game” and though it shares similar programming and
functionality to games like The SIMs or World of Warcraft, in which users portray themselves and
play as avatars. Second Life is really in a league of its own. Many users take offense when “game”
and Second Life are uttered in the same sentence. Though all are played by use of the computer,
(Fortsetzung der Fußnote auf der nächsten Seite)14
Satisfaction increases with an increasing amount of time spent in SL per week. A
two-tailed Pearson correlation gives a strongly significant coefficient of 0,251
(n=102). Examples of possible explanations for these feelings are: 1) as the user
becomes more familiar with Second Life, the level of fun and identification with the
avatar increases, or 2) as he or she is able to explore more possibilities (places,
functionalities) given in the virtual world, Second Life gets more interesting and also
useful.
To summarize, comparing our empirical analysis with other studies in Second Life,
we have been able to give more clarity to user characteristics in Second Life. We
believe that our results can provide guidance for future in-depth research identifying
causal relationships and other factors that we did not address. While an overall
interpretation of the results should be done with caution19, we draw the following
conclusions:
The average age among Second Life users lies around 30-33 years.
There are groups of users who are in Second Life with different means of
motivation. We will look more into that within the next paragraph.
Those present in the online world have a higher educational level than the
overall internet community.
As virtual online worlds such as Second Life are just at the beginning of their
lifecycle, more rational activities such as information seeking and purchases
will pick up in the future if the interface improves and the business community
increases. At this point, fascination, curiosity and meeting others are the major
modes of motivation.
within the world of Second Life, point systems and objectives do not exist. It is basically endless
with no determined “game over point”. Also, as of this moment, someone’s avatar creation does not
have health settings—it cannot get sick, it cannot die. In fact, Second Life is closer to the real world
than one might think. Experience and knowledge that can be obtained while in Second Life can
benefit and be applied to one’s own life. “New World Notes”, found at http://nwn.blogs.com, a
popular blog for users of Second Life, written by Wagner James Au shows that many users have
admitted that Second Life inspires them to learn new programming skills or skills in Adobe
Photoshop and they further state that these skills have helped them with their real jobs.
19
This is due to the bias that may be included in our sample due to the sampling method.15 3.6 Segmentation of Second Life Users The purpose of segmentation is to divide a market into distinct groups of customers with different needs, characteristics or behavior, who might require separate products and services, thus marketing mix activities (Weitz/ Levy 2007: 111). In the past, various researchers have made attempts to cluster internet users by a diverse set of characteristics (i.e. Bauer et al. 2004). Achieving a high level of compatibility between marketing tactics and the needs of relevant target groups in Second Life, a cluster- analysis seems also beneficial to bring more light into the user structure. Within point 3.3 we have already gained the impressions that differences between Second Life inhabitants exist. The following cluster analysis describes the user groups more clearly. We used several procedures to identify respondents with similar motives for registration or other similarities. The most reliable and plausible result was reached using the K-mean-clustering method based on motivation factors for Second Life participation. In the end, three clusters were identified. Those show significant differences and communalities. Each cluster depicts that Second Life is fun and fascinating. Furthermore, the ability to “meet people from all over the world” and “to be creative” received high results from each group of respondents (pic. 8). Cluster 1 is the largest cluster and consists of respondents who admit to being content in real life and insist that it is important not to forget actual reality. These participants have their avatars depicting their actual appearance - the ability to have a different appearance in Second Life holds little or no value for them. We call them “experimenting relativists”. These respondents in Second Life stay as true to real life as possible, refraining from the unrealistic. In addition, a cross tabulation interestingly displays that respondents within cluster one are also the least satisfied with their SL experience. Hence, not surprisingly the first cluster includes respondents who have been participating less frequently or beginners who are new to Second Life. Possible explanations could include that this target group does not yet find real benefits for themselves and that technical problems harm their efficiency orientation. Another reason for their dissatisfaction could be due to the fact that they stay as true to their real lives as possible and are happy with their lives thus experiencing less enjoyment while in front of a computer screen or even the fact that their avatars depict their true selves. As cluster 1 contains more realistic users, this is the target group that can be most easily addressed with real world business models and marketing efforts. Cluster 1 respondents may be those most likely to buy goods in Second Life that will be purchased at a later date in the real world though, at this
16

point, respondents from cluster 3 prove to be even more involved in this activity.
Cluster 1 includes the largest number of new Second Life inhabitants, who have a
higher desire to stay anonymous than clusters 2 and 3. An allocation of the different
nationalities to the clusters did not lead to significant results. However, there is an
indication that the Germans and those who have spent little or no money in Second
Life are over-represented within the first cluster.

Interestingly, males dominate cluster 1 whereas females represent the majority of
cluster 2. This group of people includes the most satisfied respondents (mean = 1,68)
and those who have been Second Life inhabitants the longest. These interviewed
respondents score the lowest (highest agreement) in all categories that refer to
changing someone’s real world appearance and character. A cross tabulation with
the question regarding their avatar’s personality displays that cluster 2 makes out the
largest part of those saying that their avatars are a depiction of how they would like to
be. They are also those, who are the busiest with customizing their avatars20.
Moreover, those respondents seem to be the most interested in the socializing and
community aspects offered in Second Life. Thus, we call them “socializing
dreamers”. Overall, cluster 2 displays higher interest in earning money throughout
their SL participation (mean 2,88). Cluster 2 also ranks highest for amount of time
spent in Second Life per week. These respondents seem to love the artificial
environment from Second Life in which they can thrive as a different personality.
Though to truly infer and make more precise assumptions, further research is
needed. Marketing tactics may change as avatars portray users’ desired personality
which may differ from real life. A more emotionalized marketing strategy to these
female respondents seems to be favorable.

20
     The GMI survey found that 45% who change their looks make themselves a better looking body
       image and physical appearance.
21
Cluster 1(39 respondents) Cluster 2 (26 respondents) Cluster 3 (29 respondents) Total sample (n=94)
5
4,5
4
5- totally disagree)21
See appendix II for specific values.
3,5
3
2,5
2
1,5
1
SL is fun and *** * Get to know *** *** * Can be Can be part of *** * ***
exiting Bored in my SL fascinates people w ho Can look pretty Can do/say Can meet creative a community Can be Want to earn Can forget my
RL me share and attractive things that I people from all w henever I someone I real money RL
interests w ouldn´t over the w orld w ant cannot be in
do/say in RL RL
*** highly significant, ** strongly significant, * significant
Pic. 9: Cluster results for motivation factors (mean values, scale: 1- totally agree/
1718 Cluster 3 mostly shows values that are in-between those of clusters 1 and 2. Respondents feel the same fascination for the 3D online world as the other respondents do, but on average we can observe at a statistically significant level that cluster 3 respondents spend the longest amount of time in Second Life per week. They also portray the weakest desire to meet people from all over the world in the virtual arena. The most significant aspect about this cluster is that these respondents score highest for participating in Second Life to forget real life and daily boredom. Consequently, we call them “bored escapers”. They also show the highest disagreement level regarding the desire to be creative. Analyzing the answers from the open-ended questions, reasons for satisfaction include aspects of amusement that lead to a positive assessment of Second Life. Overall, the satisfaction level of cluster 3 lies in-between (mean 2,02) the values for cluster 1 and 2. Looking at brands that appear within the open answers, respondents from cluster 3 make the clearest statement regarding luxury goods. Only seven out of the 29 members of the third cluster come from Germany. To summarize, the three clusters show no major significant differences in terms of nationality and average age. Still, it can be concluded, that the Second Life community is not a universal homogeneous group. The different characteristics from the three clusters in terms of motives for Second Life participation recommend that specific marketing techniques may be applicable, but require further analysis in order to give specific recommendations. 4. Marketing Implications There are various implications for marketers that can be drawn from the research results. The clustering approach gives an indication of three segments showing different characteristics regarding motivational factors for Second Life activity. It is expected that the Second Life population will experience continual growth, which is dependent on technical improvements on both the provider and user side. Furthermore, there is an indication that other virtual worlds are being established and are gaining in importance, thus maybe resulting in a fragmentation in the world of virtual environments on the web. Already today, other online 3D worlds such as Entropia Universe (more game oriented) and There (comparable to SL) are working
19

hard on establishing their virtual communities. We feel that one of these 3D online
worlds will become dominant, whereas the others represent smaller communities with
special characteristics22.

As companies continue to create a presence in the virtual world it will have a positive
direct correlation to the enjoyment of users resulting in a more interesting and
engaging online environment. However, in the long run only those companies will be
successful that 1) integrate their Second Life activities into their overall marketing
strategy, but also 2) don’t view Second Life merely as a single communication tool
but rather as a system requiring a whole marketing mix strategy (pic. 10). User
attendance rates show that a fast installation, disregarding market trends, may not be
a successful one.23

Pic. 10: Second Life marketing as an integral part of the overall marketing mix

22
     All over the internet one can read about countless rumours surrounding Google Earth, a direct
     representation of our earth, allows users to zoom in and view streets and buildings exactly as they
     are in real life. Production of an enhanced 3D version to compete with Second Life or to be in
     conjunction with is the current speculation. Those users who belong to the previously mentioned
     cluster of relativists (cluster 1) may be more likely to be attacked by the real world replica of Google.
23
     Whereas in Germany companies continue to be very active in creating their Second Life islands,
       journalists report that American companies are already leaving SL (Digital: next 2007).
20 Companies have to carefully balance the early mover advantage with the benefits of a SL-follower. A proper strategy outperforms a simple quick installation of their establishment. For example, a Second Life-shop may not be attractive if there is no shop assistant welcoming and taking care of the online visitor. Thus, in most cases, a Second Life shop runs not by its own, but it is intensively interlinked with real personnel, real company infrastructure and processes. Often, specialists argue that virtual online worlds like Second Life may replace other communication instruments. However, looking at the characteristics of the different communication categories (table 2), one can argue that Second Life will rather supplement and at most, partly replace other communication mix activities (Kirchgeorg/Jung/Klante 2007). Table 2: Comparison of communication categories
21

5.       Outlook

If users continue to accept virtual online worlds as a way to communicate24, seek
information and do business, the ongoing growth of private and corporate users will
continue – based on the diffusion curve model presumably at a slight lower rate
(Everett 2003). Set-backs could results from ongoing technical problems on provider
and user side. However, most likely aspects such as inefficient search mechanisms
surrounding a growing Second Life population may slow down growth. In addition,
criticism has arisen regarding the missing legal regulations and resulting problems for
private and corporate transactions (Lastowka/Hunter 2004). Virtual worlds are likely
to have wide impact on other stakeholders and real world infrastructure.25

Altogether, businesses could experience similar problems like in other marketing mix
areas. For example, space for interaction will become tied if the Second Life
population continues to grow so drastically. It is then the same hassle to shop in a
Second Life store as it is in a real world shopping mall. The fun and creativity aspect
may get dominated by negative user experience. Moreover, reaching paying
customers in the virtual world could be as difficult as in the real world, when
advertising picks up at the same rate. Scalability will continue to be a core challenge
for virtual online worlds (Benford 2001).

Companies need to pay attention that Second Life is not over-commercialized as for
some groups the authentic character of Second Life may get lost. In general, users
identify themselves stronger with products, services and environments that they have
fully or partly created themselves (Piller/ Stotko 2003; Reichwald/Piller 2006). If such
communities get over-commercialized, they can loose a large proportion of their user
base.

Research focusing on virtual online worlds has attracted a growing number of
academic researchers (i.e. McConnon et. al. 2007, Fetscherin/Lattemann 2007), as
demand for theoretical models by practitioners rises. Within our survey a high per-
centage of respondents state the desire to remain anonymous. This may also impact
future research needed to get a deeper insight into the Second Life community.

24
     Within the study of Fetscherin and Lattemann (2007: 19), 76% of respondents claimed they would
       continue to use Second Life regularly.
25
     Unsurprisingly, the U.S. Congressional Joint Economic Committee has launched an investigation to
       explore possibilities to tax income gained from trading virtual property (Glushko 2007).
22 Still, there are several real life business models that can benefit from online virtual worlds such as the hotel and travel industry. Second Life offers already today a more emotional experience than the 2D internet interface and may become itself the new WWW standard in the future (Tynan 2007). To summarize, a significant amount of research is still needed to bring more light into Second Life and its users. We believe that after a sufficient phase of development the mainstream commercialization of virtual online worlds will enrich Second Life or other platforms with broader content and greater interactivity. Although the majority of senior executives have not yet plans to utilize marketing through virtual worlds over the next five years, we believe that the use of virtual worlds in communication and marketing will increase as more companies learn how to use them more effectively. Virtual online worlds are one example showing how significantly technology impacts human beings and changes their behavior. But on the other hand, technology only reflects what humans desire: an all ubiquitous mobile, individualized, user efficient reality with access to digital information that is universal and continual.
23

References

Aleixandre, B. (2007): Surveying Second Life – with reference to Global Market
   Insight Report (GMI Report), in:
   http://nwn.blogs.com/nwn/2007/04/second_life_dem.html, Status: 25. July 2007.

Bauer, H.H./ Neumann, M. M./ Hoffmann, Y. (2004): Internationale
  Kundensegmentierung im elektronischen Handel – eine interkulturelle
  Untersuchung, in: Bauer, H.H./ Roesger, J./ Neumann, M.M. (ed.):
  Konsumentenverhalten im Internet, Verlag Vahlen, Munich.

Benford, S. et al. (2001): Collaborative Virtual Environments, in: Communications of
  the ACM, Vol. 44, No. 7, pp. 79-85.

Cooper, R./ Spaight, T./ Dibbell, J. (2007): Alter Ego: Avatars and Their Creators,
  Chris Boot, London.

Cyranek, G. (2002): Social implications of virtual worlds, in: Digital Creativity, vol. 13
issue 1: 1.

De Nood, P./ Attema J. (2006): The Second Life of virtual reality, in: http://www.sl-
   inworld.com/news/wissenschaft-bildung/aktuelle-artikel/the-second-life-of-virtual-
   reality.html, Status: 02. July 2007.

Digital:next (ed.) (2007): US-Firmen resignieren in Second Life, deutsche Firmen
   optimistisch, in: http://www.digitalnext.de/us-firmen-resignieren-in-second-life-
   deutsche-firmen-optimistisch/, Status: 14. July 2007.

Domjan, M. (2005): The principles of learning and behavior, 5th ed., Wadsworth
  Publishing, California.

Everett, M. (2003): Diffusion of Innovations, 5th ed., NY: Free Press, New York.

Fetscherin, M./ Lattemann, C. (2007): User acceptance – an explorative study about
   Second Life, in: http://www.fetscherin.com/UserAcceptanceVirtualWorlds.htm,
   Status: 17. Aug. 2007.

Forschungsgruppe Wahlen Online (ed.) (2007): Internet Strukturdaten, in:
   http://www.fgw-online.de/Aktuelles/PM_Strukturdaten/web_II_07.pdf, Status: 24.
   July 2007.
24

Glushko, B. (2007): TALES OF THE (VIRTUAL) CITY: GOVERNING PROPERTY
   DISPUTES IN VIRTUAL WORLDS, in: Berkeley Technology Law Journal, Annual
   Review 2007, Vol. 22, No. 1, pp. 507-532.

Guiniven, J. (2006): Avatars are people, too: PR in the virtual world, Public Relations
   Tactics, Vol. 13, No. 10, p. 6.

Kolko, B. E. (1999): Representing Bodies in Virtual Space: The Rhetoric of Avatar
   Design, Information Society, Vol. 15, No. 3, pp. 177-186.

Kirchgeorg, M./ Jung, K./ Klante, O.: Szenarioanalyse - Messen 2020, in: AUMA
    (ed.): Messen 2020, special ed., Berlin. (in publication)

Kroeber-Riel, W./ Weinberg, P. (2003): Konsumentenverhalten, 8. ed., Verlag
   Vahlen, Munich.

Lastowka, F. G./ Hunter, D. (2004): The Laws of the Virtual Worlds, in: California Law
   Review, Vol. 92, No. 1, pp. 3-73.

Miniwatts Marketing Group. (ed.) (2007): World internet user statistics, in:
   http://www.internetworldstats.com/stats.htm, Status: 24. July 2007.

McConnon, A./ Reena, J. (2007): in virtual, in: Business Week, Vol. 2007, No. 4038,
  special section pp. 24-25.

Placentra, G./ Gertels T. (2007): Umsatzmotor oder Seifenblase, Marketing Journal,
   Vol 2007. , No. 7-8, pp. 42-44.

Piller, F.T./ Stotko, C. (2003): Mass Customization und Kundenintegration. Neue
    Wege zum innovativen Produkt, Symposion Publishing, Düsseldorf.

Reichwald, R./ Piller, F.T. (2007): Interaktive Wertschöpfung. Open Innovation,
   Individualisierung und neue Formen der Arbeitsteilung, Gabler, Wiesbaden.

Shao-Kang, L./ Chih-Chien, W./Wenchang, F. (2005): Physical Interpersonal
  Relationships and Social Anxiety among Online Game Players, in:
  CyberPsychology & Behavior, Vol. 8, No. 1, pp. 15-20.

Sheth, J.N./ Mittal, B./ Newman, B.I. (1999): Customer behavior, Dryden Press, Fort
  Worth a.o.
25 TNS infratest (Ed.) (2007): (N)Onliner Atlas 2007, in: http://www.nonliner-atlas.de/, Status: 01. Aug. 2007. Webb, S. (2001): Avatarculture: Narrative, power and identity in virtual world environments, in: Information, Communication & Society, Vol. 4, No. 4, pp. 560- 594. Weitz, B.A./ Levy, M. (2007): Retailing Management, 6th ed., McGraw-Hill, Boston a.o.
26

Appendix I
Correlation Matrix: Time spent in SL per week/ motives for SL participation26
                                                                     Can do/say         Can be                    Can be part of
                                                     Hours spend     things that I     someone I                  a community
                                                      in SL per        wouldn’t       cannot be in   Bored in      whenever I       Want to earn    Can forget
                                                        week?        do/say in RL         RL          my RL           want          real money       my RL
     Hours spend in SL per     Pearson Correlation              1          -,229(*)       -,235(*)    -,262(**)            -,175            -,130      -,213(*)
     week?                     Sig. (2-tailed)                                ,020           ,019         ,008              ,081            ,194          ,037
                               n                             106              103             100          102               100             101            97
     Can do/say things that    Pearson Correlation       -,229(*)                1        ,450(**)      ,235(*)             ,194            ,085       ,360(**)
     wouldn´t do/say in RL     Sig. (2-tailed)               ,020                            ,000         ,017              ,054            ,400          ,000
                               n                             103              103             100          102               100             101            97
     Can be someone I cannot   Pearson Correlation       -,235(*)         ,450(**)              1         ,194           ,368(**)           ,082       ,302(**)
     be in RL                  Sig. (2-tailed)               ,019            ,000                         ,055              ,000            ,415          ,003
                               n                              100             100             100           99                99             100            96
     Bored in my RL            Pearson Correlation       -,262(**)         ,235(*)           ,194            1              ,025            ,130       ,404(**)
                               Sig. (2-tailed)               ,008             ,017           ,055                           ,807            ,198          ,000
                               n                             102              102              99          102               100             100            97
     Can be part of a          Pearson Correlation          -,175             ,194        ,368(**)        ,025                 1            ,025        ,210(*)
     community whenever I      Sig. (2-tailed)               ,081             ,054           ,000         ,807                              ,809          ,039
     want
                               n                             100              100              99          100               100             100            97
     Want to earn real money   Pearson Correlation          -,130             ,085           ,082         ,130              ,025               1          ,167
                               Sig. (2-tailed)               ,194             ,400           ,415         ,198              ,809                          ,103
                               n                             101              101             100          100               100             101            97
     Can forget my RL          Pearson Correlation       -,213(*)         ,360(**)        ,302(**)     ,404(**)           ,210(*)           ,167             1
                               Sig. (2-tailed)               ,037             ,000           ,003         ,000              ,039            ,103
                               n                               97               97             96           97                97              97            97
     Legend:
     ** strongly significant correlation (p≤0,01)        * significant correlation (p≤0,05)              n number of included cases

26
     Negative correlation results from questionnaire coding, meaning the more time respondents spent in SL the more they agree with the motive statement in this
       case.
27
Appendix II
Mean values of variables used for K-mean cluster analysis
- Measured on a scale 1 (strongly agree) to 5 (strongly disagree) -
Can
Get to do/say Can Can be Can be
know things meet Can beofpart
part a some-
people Can look that I people communi
of a one I Want Can
SL is fun SL who pretty wouldn’t from all ty
community cannot to earn forget
and Bored in fascinat share and do/say in over the wheneveI
Can be whenever be in real my RL
Cluster exciting my RL es me interests attractive RL world creative r want
I want RL money ***
Number *** * *** *** * *** *
1 Mean 1,85 4,49 1,92 2,36 3,46 3,44 1,69 1,95 2,36 3,41 3,97 4,36
n 39 39 39 39 39 39 39 39 39 39 39 39
Std. Deviation ,904 ,601 ,703 ,903 1,189 1,165 ,655 ,793 ,811 ,880 ,932 ,628
2 Mean 1,77 4,23 1,58 2,08 1,73 1,77 1,35 1,85 1,69 1,96 2,88 3,46
n 26 26 26 26 26 26 26 26 26 26 26 26
Std. Deviation ,765 ,908 ,902 1,017 ,724 ,908 ,485 ,967 ,549 1,076 1,071 1,208
3 Mean 1,76 2,24 1,83 2,17 2,62 2,31 2,00 2,34 2,24 2,38 3,52 3,14
n 29 29 29 29 29 29 29 29 29 29 29 29
Std. Deviation 1,057 ,689 ,889 ,805 1,178 ,930 ,964 ,814 1,023 ,903 1,243 1,060
Total Mean 1,80 3,72 1,80 2,22 2,72 2,63 1,69 2,04 2,14 2,69 3,53 3,73
sample n 94 94 94 94 94 94 94 94 94 94 94 94
Std. Deviation ,911 1,230 ,824 ,906 1,282 1,244 ,762 ,867 ,863 1,127 1,152 1,089
Legend:
*** highly significant result (p≤0,001)
** strongly significant result (p≤0,01)
* significant result (p≤0,05)
n– number of included cases28 Appendix III
29
30

List of HHL Working Papers

Nr. 1      Prof. Dr. Dr. h.c. Heribert Meffert (1996), 31 Seiten
           Stand und Perspektiven des Umweltmanagement in der
           betriebswirtschaftlichen Forschung und Lehre

Nr. 2      Prof. Dr. Bernhard Schwetzler (1996), 28 Seiten
           Verluste trotz steigender Kurse? - Probleme der Performancemessung
           bei Zinsänderungen

Nr. 3      Prof. Dr. Arnis Vilks (1996), 26 Seiten
           Rationality of Choice and Rationality of Reasoning (Revised version,
           September 1996)

Nr. 4      Prof. Dr. Harald Hungenberg (1996), 36 Seiten
           Strategische Allianzen im Telekommunikationsmarkt

Nr. 5      Prof. Dr. Bernhard Schwetzler (1996), 41 Seiten
           Die Kapitalkosten von Rückstellungen zur Anwendung des Shareholder
           Value-Konzeptes in Deutschland

Nr. 6      Prof. Dr. Harald Hungenberg / Thomas Hutzschenreuter (1997),
           32 Seiten
           Postreform - Umgestaltung des Post- und Telekommunikations-
           sektors in Deutschland

Nr. 7      Prof. Dr. Harald Hungenberg / Thomas Hutzschenreuter / Torsten
           Wulf (1997), 31 Seiten
           Investitionsmanagement in internationalen Konzernen
           - Lösungsansätze vor dem Hintergrund der Agency Theorie

Nr. 8      Dr. Peter Kesting (1997), 47 Seiten
           Visionen, Revolutionen und klassische Situationen – Schumpeters
           Theorie der wissenschaftlichen Entwicklung

Nr. 9      Prof. Dr. Arnis Vilks (1997), 36 Seiten
           Knowledge of the Game, Rationality and Backwards Induction

Nr. 10     Prof. Dr. Harald Hungenberg / Thomas Hutzschenreuter / Torsten
           Wulf (1997), 22 Seiten
           Ressourcenorientierung und Organisation

Nr. 11     Prof. Dr. Bernhard Schwetzler / Stephan Mahn (1997), 71 Seiten
           IPO´s: Optimale Preisstrategien für Emissionsbanken mit Hilfe von
           Anbot-Modellen

Nr. 12     Prof. Dr. Thomas M. Fischer (1997), 23 Seiten
31
Koordination im Qualitätsmanagement – Analyse und Evaluation im
Kontext der Transaktionskostentheorie
Nr. 13 Dr. Thomas Hutzschenreuter / Alexander Sonntag (1998), 32 Seiten
Erklärungsansätze der Diversifikation von Unternehmen
Nr. 14 Prof. Dr. Bernhard Schwetzler / Niklas Darijtschuk (1998), 33 Seiten
Unternehmensbewertung mit Hilfe der DCF-Methode – eine Anmerkung
zum „Zirkularitätsproblem“
Nr. 15 Prof. Dr. Harald Hungenberg (1998), 22 Seiten
Kooperation und Konflikt aus Sicht der Unternehmensverfassung
Nr. 16 Prof. Dr. Thomas M. Fischer (1998), 31 Seiten
Prozeßkostencontrolling – Gestaltungsoptionen in der öffentlichen
Verwaltung
Nr. 17 Prof. Dr. Bernhard Schwetzler (1998), 34 Seiten
Shareholder Value Konzept, Managementanreize und
Stock Option Plans
Nr. 18 Prof. Dr. Bernhard Schwetzler / Serge Ragotzky (1998), 24 Seiten
Preisfindung und Vertragsbindungen bei MBO-Privatisierungen in
Sachsen
Nr. 19 Prof. Dr. Thomas M. Fischer / Dr. Jochen A. Schmitz (1998),
23 Seiten
Control Measures for Kaizen Costing - Formulation and Practical Use
of the Half-Life Model
Nr. 20 Prof. Dr. Thomas M. Fischer / Dr. Jochen A. Schmitz (1998),
35 Seiten
Kapitalmarktorientierte Steuerung von Projekten im Zielkosten-
management
Nr. 21 Prof. Dr. Bernhard Schwetzler (1998), 25 Seiten
Unternehmensbewertung unter Unsicherheit –
Sicherheitsäquivalent- oder Risikozuschlagsmethode?
Nr. 22 Dr. Claudia Löhnig (1998), 21 Seiten
Industrial Production Structures and Convergence: Some Findings
from European Integration
Nr. 23 Peggy Kreller (1998), 54 Seiten
Empirische Untersuchung zur Einkaufsstättenwahl von Konsumenten
am Beispiel der Stadt Leipzig32
Nr. 24 Niklas Darijtschuk (1998), 35 Seiten
Dividendenpolitik
Nr. 25 Prof. Dr. Arnis Vilks (1999), 25 Seiten
Knowledge of the Game, Relative Rationality, and Backwards Induction
without Counterfactuals
Nr. 26 Prof. Dr. Harald Hungenberg / Torsten Wulf (1999), 22 Seiten
The Transition Process in East Germany
Nr. 27 Prof. Dr. Thomas M. Fischer (2000), 28 Seiten
Economic Value Added (EVA ) - Informationen aus der externen
Rechnungslegung zur internen Unternehmenssteuerung?
(überarb. Version Juli 2000)
Nr. 28 Prof. Dr. Thomas M. Fischer / Tim von der Decken (1999), 32 Seiten
Kundenprofitabilitätsrechnung in Dienstleistungsgeschäften –
Konzeption und Umsetzung am Beispiel des Car Rental Business
Nr. 29 Prof. Dr. Bernhard Schwetzler (1999), 21 Seiten
Stochastische Verknüpfung und implizite bzw. maximal zulässige
Risikozuschläge bei der Unternehmensbewertung
Nr. 30 Prof. Dr. Dr. h.c. mult. Heribert Meffert (1999), 36 Seiten
Marketingwissenschaft im Wandel – Anmerkungen zur
Paradigmendiskussion
Nr. 31 Prof. Dr. Bernhard Schwetzler / Niklas Darijtschuk (1999), 20 Seiten
Unternehmensbewertung, Finanzierungspolitiken und optimale
Kapitalstruktur
Nr. 32 Prof. Dr. Thomas M. Fischer (1999), 24 Seiten
Die Anwendung von Balanced Scorecards in Handelsunternehmen
Nr. 33 Dr. Claudia Löhnig (1999), 29 Seiten
Wirtschaftliche Integration im Ostseeraum vor dem Hintergrund der
Osterweiterung der Europäischen Union: eine Potentialanalyse
Nr. 34 dieses Arbeitspapier ist nicht mehr verfügbar
Nr. 35 Prof. Dr. Bernhard Schwetzler (2000), 31 Seiten
Der Einfluss von Wachstum, Risiko und Risikoauflösung auf den
Unternehmenswert
Nr. 36 Dr. Thomas Hutzschenreuter / Albrecht Enders (2000), 27 SeitenYou can also read