Co-op Survival Rates in Alberta - Richard Stringham Alberta Community and Co-operative Association Celia Lee BC-Alberta Social Economy Research ...
←
→
Page content transcription
If your browser does not render page correctly, please read the page content below
Co-op Survival Rates
              in Alberta

Richard Stringham
Alberta Community and Co-operative Association

Celia Lee
BC-Alberta Social Economy Research Alliance

August 2011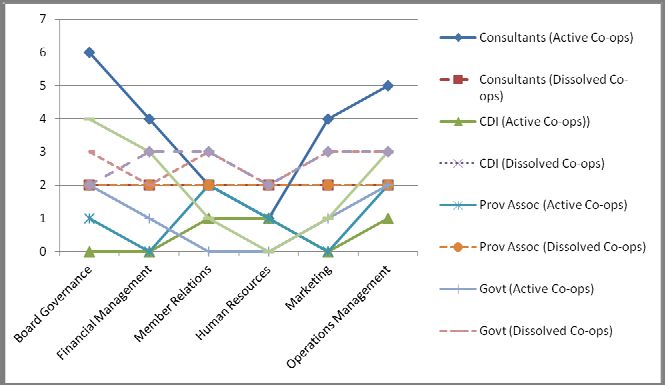
Copyright © 2011, Canadian Centre for Community Renewal (CCCR) on behalf
of the BC-Alberta Social Economy Research Alliance, and Alberta
Community and Co-operative Association

For further information, contact the BC-Alberta Social Economy Research Alliance,
PO Box 1161, Port Alberni, BC, V9Y 7M1, (tel) 250-723-2296

Website: www.socialeconomy-bcalberta.ca

Email:    balta@xplornet.com

Author Information

Richard Stringham is the Director of Co-op Development for the Alberta Community
and Co-operative Association, a BALTA partner.

Celia Lee is a recent graduate of the University of Calgary’s Faculty of
Environmental Design and was a student researcher with BALTA and the ACCA.

Acknowledgments

The Alberta Community and Co-operative Association acknowledges the
contributions of our BC colleagues, John Restakis and Carol Murray of the BC Co-
operative Association, and Maryanne Mathias, MBA student at the ISIS Centre of
the Sauder School of Business at the University of British Columbia. Also, we
greatly appreciate the time and cooperation of the respondents.

This report has been produced as part of the research program of the BC-Alberta
Social Economy Research Alliance (BALTA). Financial support from the Social
Sciences and Humanities Research Council of Canada (SSHRC) is gratefully
acknowledged.
Co‐op Survival Rates in Alberta

1 Contents
2     Executive Summary............................................................................................................................... 3
3     Purpose of the Research ....................................................................................................................... 5
4     Methodology......................................................................................................................................... 5
5     Survey Response Rates ......................................................................................................................... 6
6     Limitations of the Research .................................................................................................................. 6
7     Incorporation Rates .............................................................................................................................. 7
8     Survival Rates ...................................................................................................................................... 10
9     Online Survey Results .......................................................................................................................... 13
    9.1       Co‐op Success Factors................................................................................................................. 13
    9.2       Major Challenges ........................................................................................................................ 23
    9.3       Reasons for Failure...................................................................................................................... 25
    9.4       Resources co‐operatives wished they had had at incorporation ............................................... 25
    9.5       What Could have Enhanced Success After Incorporation?......................................................... 27
    9.6       What Co‐ops Would Have Done in Hindsight ............................................................................. 28
10         Interview Results............................................................................................................................. 29
    10.1      Success Factors ........................................................................................................................... 29
11         Summary of Co‐op Success Factors ................................................................................................ 35
12         Summary of Challenges Faced by Developing Co‐operatives......................................................... 37
13         Recommendations .......................................................................................................................... 38
    13.1      New Co‐ops ................................................................................................................................. 38
    13.2      Supporting Organizations ........................................................................................................... 39
14         Works Cited..................................................................................................................................... 43
Appendix 1: Online Survey Questions......................................................................................................... 44
Appendix 2: Telephone Interview Questions.............................................................................................. 48
Appendix 3 – Summary of Responses from Alberta’s Qualitative Interviews ............................................ 51

                                                                              2
2 Executive Summary
Agencies with an interest in co‐operative development would benefit from better understanding of the
patterns and causes of co‐op formation and dissolution in Alberta. The research aims were to establish:
a) The number and variety of co‐ops incorporated in Alberta over the last ten years;
b) The conditions that gave rise to the incorporation of these co‐ops;
c) The survival rate of incorporated co‐ops;
d) The reasons for a co‐op's discontinuance;
e) The ways in which a co‐op's early development and incorporation might be assisted; and
f) The ways by which a co‐op's demise might have been averted.
Incorporation and dissolution data was examined for 127 co‐operatives incorporated from 2000 to
2009. An online survey was conducted with respondents from 29 co‐operatives of 134 incorporated in
the period 2000 to 2010. Eight (8) of those co‐ops were represented in telephone interviews.
From 2000 to 2009, 127 new co‐operatives were incorporated in Alberta excluding mergers of pre‐
existing co‐operatives and registration of extra‐provincial co‐operatives. A spike occurred in new co‐
operative incorporations in 2002, possibly a result of the new Alberta legislation and its enabling
clauses. The fewest number of incorporations took place in 2008, possibly due to a global economic
slowdown.
Dissolution data provided for Alberta co‐ops incorporated between 2000 and 2004 does not appear to
be reliable. More recent data shows that three year survival rates for co‐ops incorporated in 2005 and
2006 was 81.5% compared to 48% for conventional firms in Alberta. Co‐ops operating in the same field
as other co‐ops (e.g., housing, water and sewage) generally had better survival rates than those which
are more innovative.
Capital and hired staff were both considered important to the success of those co‐operatives which used
either or both of those resources. The majority of capital was from member shares and loans. Securing
financing from the lending sector was considered challenging for more than half of respondents.
However, neither lack of capital nor having paid staff were reported as problems which led to the
dissolution of co‐ops.
Partnerships and networks were generally valued by those that used them.
Coordinating with different regulatory organizations was one of the most significant challenges for co‐
ops in terms of maintaining their momentum, optimism and financial viability. Similarly, keeping up with
administrative paperwork was overwhelming for volunteers who were also trying to develop and run
their co‐ops.
Each of the respondents from dissolved co‐ops indicated that their groups had used external expertise
prior to incorporation. 71% of the operating co‐ops had done so.
3At least 42% of operating co‐ops had used consultants prior to incorporation and generally rated their
helpfulness as higher than any other type of external expertise. 29% of operating co‐ops used
consultants after incorporation, and generally did not value their helpfulness as strongly as prior to
incorporation. In contrast, none of the dissolved co‐ops used consultants prior to incorporation and,
most likely, after incorporation.
Reasons for failure of co‐ops were most often cited as being rooted in external factors, particularly
shifting markets and regulatory requirements. Internal factors were cited less often, but included lack of
a united vision and dishonesty among members.
Key success factors identified by participants were:
Boards with the right skill sets which worked effectively together
Effective communications between board, staff, and members.
Realistic business plans
Engaged membership
Start‐up and development capitalization
Acquiring needed expertise
Coordination of the multitude of developmental tasks
Mentorship
The top three resources that respondents felt they had lacked, and that would have contributed to co‐
operative success were:
Someone to provide mentorship and/or co‐ordination of activities
Start‐up capital / Venture Capital Fund
A package of available resources upon incorporation
The following are the study recommendations :
1. Consider who is falling through the cracks both in regards to awareness of existing resources and
lack of access to resources;
2. Centralize and coordinate access to resources to minimize the time needed to search for various
resources needed.
3. Improve communications to clarify the roles different agencies play in co‐operative development
and to build trust in relationships.
4. Advocate on behalf of developing co‐operatives to address their challenges regarding regulations
that they do not have time or resources to address.
5. Enhance access to start‐up capital with tools such as a venture capital fund and an innovations fund
focused at co‐operatives.
6. Develop capital and membership relations vehicles which are better suited to the needs of housing
co‐ops.
43 Purpose of the Research
There is a significant gap in knowledge of survival rate of co‐operatives in Alberta and what contributes
to their successes and failures. Policy and planning from agencies with an interest in co‐operative
development would benefit from better understanding of the patterns and causes of co‐op formation
and dissolution in Alberta over the last ten years.
The research aims were to establish:
a) The number and variety of co‐ops incorporated in Alberta over the last ten years;
b) The conditions that gave rise to the incorporation of these co‐ops;
c) The survival rate of incorporated co‐ops;
d) The reasons for a co‐op's discontinuance;
e) The ways in which a co‐op's early development and incorporation might be assisted; and
f) The ways by which a co‐op's demise might have been averted.
4 Methodology
The research was conducted in three parts:
a) Online survey of respondents representing co‐operatives which were incorporated in the period
January 1, 2000 to June 20, 2010. Survey questions are presented in Appendix 1.
b) Follow up telephone interviews with representatives of co‐operatives incorporated during the
period January 1, 2000 to December 31, 2010. Survey questions are presented in Appendix 2.
c) Analysis of the data provided by the Director of Cooperatives, Service Alberta regarding
incorporations and dissolutions for co‐operatives incorporated January 1, 2000 to December 31,
2010.
134 new co‐operatives were incorporated in Alberta from January 1, 2000 to June 30, 2010. This was the
base from which online and telephone survey respondents were drawn.
Of that number, 127 new co‐operatives were incorporated from 2000 to 2009 which acted as the data
base for calculating rates of survival of new co‐operatives.
5 Survey Response Rates
29 of the potential 134 co‐operatives were represented in the online survey. Only eight (8) participated
in the telephone interviews.
5Table 1: Survey Response Rates for Operating and Dissolved Co‐operatives
Incorporations from Jan. 1, 2000 Operating at the Time of the Dissolved at the time of the
to June 30, 2010 Surveys surveys
New Co‐operatives 116 18
Represented in Online Survey 24 5
Represented in Telephone 6 2
Interviews
Those who declined participation in this research did so for a number of reasons. For many agricultural
co‐ops, the research coincided with harvesting season. Others did not have time, felt overloaded with
paperwork, did not feel confident answering questions (especially if they were new to the co‐op), or did
not specify a reason.
6 Limitations of the Research
The online surveys and telephone interviews were with representatives of co‐operatives which had been
incorporated. Although many of the questions focused on the process leading to incorporation and the
impact on achieving incorporation, representatives from groups which had attempted to develop co‐
operatives, but did not achieve co‐operative incorporation, were not polled. Consequently, their
perspectives are not included.
Although the data for survival of co‐operatives was compared to that of incorporations of conventional
businesses, there were no specific attempt to understand the distinctions between the causes of failure
and survival rates for co‐operatives versus conventional businesses.
The survey and interview questions did not distinguish between types within the same category of
resources. For example, for questions examining the role of government, there was no attempt to
distinguish between different levels of government (municipal, provincial, federal). Neither was there
distinction between different departments of the same level of government. These distinctions were
more apparent in telephone interviews, but were not pursued by the interviewer. Similarly, respondents
rating the value of consultants were not asked to distinguish between those who specialized in co‐
operative development versus those who focus on technical areas related to the co‐op’s specific
business.
The lens through which respondents view the value of various components was, as expected, based
upon their other experiences. For example, one manager was most appreciative of a board which
another observer might consider too operational in its approach.
6Respondents covered the spectrum from 2000 to 2010. The memories of those who had more recently
experienced incorporation were likely fresher. However, they had less experience with what enabled
their co‐op to survive. Also, surveys and telephone interviews dealt with respondents who were there
during the co‐operative’s incorporation and those who came on board sometime afterward.
A potential bias observed in telephone interviews was that respondents likely spent more time talking
about successes and challenges with which they dealt directly, simply because they were more
knowledgeable about them. Tasks and factors dealt with by others (consultants, employees, etc.) may
have been perceived as less important, particularly when these tasks were achieved with apparent ease,
but would have required little thought and involvement by the respondents. Most participants,
however, seemed quite cognizant of the contributions made by others, particularly if they had had past
experience with collaborative projects.
Co‐operative development services may have changed over the period examined. Accordingly, earlier
experiences may differ from later experiences.
Not all sources of expertise and assistance intend on providing all services related to co‐operative
development. However, the survey was not designed to differentiate between services an agency
intended to provide in comparison to the expectations and experiences of groups developing co‐
operatives.
Instructions for some survey questions asked respondents to rate the helpfulness of various sources of
expertise “on a scale of 1 to 5 with 1 being the least…”. For those sources not used, respondents were
asked to leave the answer blank. However, on the basis of comments, it became obvious that at least
one respondent used the rating of “1” for services that they had not used. It is not clear as to how many
others did not follow the instructions.
7 Incorporation Rates
Rates of incorporation of co‐operatives in Alberta for the period 2000 to 2009 are based upon data
provided by the provincial government through the office of the Director of Cooperatives with Service
Alberta. As the intent of the research was to examine new co‐operatives, incorporations were excluded
which reported changes in pre‐existing co‐operatives (e.g., registration of mergers of existing co‐ops and
registration of Alberta operations for extra‐provincial co‐ops). However, the conversions of pre‐existing
non‐cooperative businesses to co‐operatives were included in the results.
Over the ten year period, 127 new co‐operatives were registered in Alberta ranging from a low of seven
in 2008 to a high of nineteen in 2002. (Figure 1)
7Figure 1: Numbers of new co‐operative incorporations in Alberta from 2000 to 2009
32% of new co‐operatives incorporated in the ten years examined were water utility co‐operatives
(Figure 2 and Table 1). 13% were involved in the marketing and processing of primary products, the vast
majority of which were new generation co‐operatives, representing 12% of all new co‐op
incorporations. Breeder co‐ops represented 10% of new incorporations and were as high as 55 % (6/11)
of new co‐operative incorporations in 2000; however, only one was incorporated after 2002.
2002, the year of the highest numbers of new incorporations, was also the year that the new Co‐
operatives Act and Regulations for Alberta came into force. This may explain the surge in new
generation co‐operatives in that year (Table 2) as the new legislation enabled more member and non‐
member investment alternatives.
Another spike occurred in new generation co‐operatives in 2004, possibly in response to the first
discovery of an Alberta cow with Bovine Spongiform Encephalopathy (BSE) in May 2003 as producers in
several species of livestock were impacted by closed borders, depressed farm‐gate prices, and the
frustration of watching meatpackers substantially increase their profit per head. The concept of taking
ownership in the value added chain made new generation co‐operatives an attractive alternative to an
audience who had not been so motivated in the past.
8Figure 2: Total Incorporations of Co‐operatives in Alberta According to Activity Types for 2000 to 2009
Table 2: Annual Rates of Co‐operative Incorporations in Alberta According to Types for 2000 to 2009
Main Activity Types
Year of Incorporations
Annual Totals
NGC
stakeholder owned
Worker or multi‐
Utilities
Water and/or Sewage
Feeder
Grazing
Breeder
Products
Processing of Primary
Marketing and/or
Transportation
Housing
Retail
Development
Community Economic
Other
2000 4 6 1 11
2001 4 1 2 1 1 2 11 1 1
2002 3 1 4 4 1 1 1 1 3 19 3
2003 4 1 1 2 1 1 10 1 1
2004 1 1 5 1 1 3 12 4 1
2005 3 1 2 3 1 1 2 13 1 2
2006 6 1 1 1 5 14 1 1
2007 8 2 6 16 2 1
2008 2 1 1 1 2 7
92009 6 1 1 1 1 1 3 14 2
Tota 41 3 5 13 17 5 7 4 5 27 127 15 7
ls
% 32.3 2.4 3.9 10.2 13.4 3.9 5.5 3.1 3.9 21.3 11.8 5.5
Reasons for the significant drop in numbers of incorporations in 2008 are less obvious. The global
economic slowdown may have been a key factor. It is interesting to note that a similar drop in co‐
operative incorporations took place in BC in 2008 (Murray, 2010).
8 Survival Rates
Again, data provided by the Director of Cooperatives with Service Alberta was examined for those co‐
operatives incorporated in the years 2000 to 2009.1
Data for co‐operatives incorporated during the period 2000 to 2004 was used to identify survival rates
for co‐operatives after five years of operations (Table 3). The results are substantially higher (92.1%)
than comparisons to a recent BC study (65.8%) and a 2008 Quebec study (64%) (Murray, 2010). The
results are even more remarkable in comparison to Statistics Canada’s 1993 figure of 35% for five year
survival of conventional businesses in Alberta (Baldwin, Bian, Dupuy, & Gellatly, 2000).
Table 3: Survival Rates after Five Years for Co‐ops Incorporated Between 2000 and 2004
Year of % survival
incorporation after 5 years
2000 90.9%
2001 90.9%
2002 89.5%
2003 90.0%
1
During the survey and interview processes (mid‐way through 2010), it became apparent that some of the co‐
operatives listed as active, had either dissolved or were in the dissolution process. However, this situation would
likely be similar to other business registries where the process of dissolution may not be reported immediately, but
would in due course become listed with the respective registrar. Accordingly, for consistency, registry data for
these co‐operatives was used as listed in the registry; however, survey and interview responses from a respondent
who voluntarily advised that their co‐op was dissolved or in the process of dissolution, was considered dissolved
for those parts of this report in which online survey and telephone interviews were used.
102004 100.0%
Total for 92.1%
2000 to 2004
However, none of the co‐operatives incorporated between 2000 and 2004 are reported to have
dissolved prior to completing two years of operation, whereas, 16.3% (7/43) of co‐operatives
incorporated in the years 2005 to 2007 dissolved before completing two years of operations (Table 4).
The difference in results may be due to a significant change in the manner in which the office of the
Director of Cooperatives with Service Alberta monitors and records those co‐operatives which are no
longer actively reporting on an annual basis. If that is the case, then the data for the period 2000 to 2004
which was used to determine five year survival rates may be less accurate than more recent data will
prove to be as dissolutions may have been reported later than they would be in today’s system of
monitoring.
Table 4: Rates of Dissolution and Length of Survival prior to Dissolution for Years 2000 to 2009
Numbers of subsequently dissolved co‐operatives from respective year of
active
Number currently
Year of incorporation
co‐ops incorporated
Numbers of new
incorporation with number of years of operation prior to dissolution
1 yr
Less than
1 yr
2 yrs
3 yrs
4 yrs
5 yrs
6 yrs
7 yrs
8 yrs
9 yrs
2000 11 1 1 9
2001 11 1 1 9
2002 19 1 1 17
2003 10 1 2 7
2004 12 1 11
5 year 63 3 2 3 2 53
Totals
2005 13 2 1 10
2006 14 2 1 11
2007 16 1 1 14
112008 7 7
2009 14 14
TOTAL 124 1 2 4 3 3 3 2 106
S
Comparing survival rates for co‐operatives incorporated in a period when dissolution data appears to
have been produced in a more timely (and hence, more accurate) manner can be compared to data
from conventional businesses for Alberta, albeit drawn from a much more limited sample size and using
data collected in a different manner2 (Table 5).
Table 5: Comparison of Survival Rates for Co‐operative versus Conventional Incorporations after 1, 2, and 3 Years of
Operations
Year of % survival % survival % survival
incorporation after 3 years after 2 years after 1 year
2005 84.6 84.6 100
2006 78.6 78.6 85.7
2007 N/A 87.5 93.75
2008 N/A N/A 100
Total 81.5 83.7 94.0
Conventional 48 59 75
Firms in
Alberta34
Figure 3: Percentages of Co‐ops Dissolved by Type for Co‐ops Incorporated Between 2000 and 2009
2
The Statistics Canada report draws its data from the LEAP Database.
3
(Baldwin, Bian, Dupuy, & Gellatly, 2000)
4
Based upon data from 1984 to 1994
12Dissolutions appear to be less frequent in some types of co‐operatives than others when compared
across the 2000 to 2009 period. For example, none of the seven housing co‐ops and 7.3% of utility co‐
ops incorporated from 2000 to 2009 had been dissolved at the time of the study which is substantially
less than the average of 14.5% dissolutions for all types for the same period.
The low numbers of co‐ops incorporated for some types such as feeder (3), grazing (5), transportation
(5), retail (4), and community economic development (5) make it difficult to determine if the rate of
dissolutions was representative or an anomaly.
Dissolution of marketing and processing co‐operatives was slightly worse than average (17.6%), while
new generation co‐operatives were dissolved at a rate very near to average (13.3%).
Dissolutions for the catch‐all category of other, representing 27 co‐operatives were significantly higher
than the average at 29.6%. This raises the question as to whether there are types within that category
which are much more likely to dissolve, or if, co‐operatives which are more innovative in purpose,
market, and/or structure are less likely to succeed than co‐ops which are effectively replications in large
part of existing co‐ops (e.g., water utility co‐ops and housing co‐ops).
9 Online Survey Results
9.1 Co‐op Success Factors
9.1.1 Capital
As shown in Table 6, 71% (15/21) of respondents for co‐ops operating at the time of the survey
indicated that initial capital was important or extremely important in their success, and 48% (10/21) felt
that additional capital was important or extremely important.
13Similarly, respondents for dissolved co‐operatives indicated that initial capital was considered by all but
one (4/5) as important or extremely important, while additional capital was seen as important or
extremely important by less than half of respondents (2/5).
Table 6: Importance of Initial and Additional Capital to Dissolved and Operating Co‐ops
Unimportant Doesn’t matter much Neutral Important Extremely
Important
Initial Currrently 14.3% 9.5% 4.8% 14.3% 57.1%
Capital operating
(21)
Dissolved 0% 0% 20% 60% 20%
(5)
Additional Currrently 14.3% 23.8% 14.3% 9.5% 38.1%
capital operating
(21)
Dissolved 0% 40% 20% 20% 20%
(5)
As shown in Table 7, the most substantial source of capital for both operating and dissolved co‐ops was
member contributions. For operating co‐ops, this was followed by grants, banks and credit unions, and
personal loans. Other sources of funds included a local county loan, a developer, the Association
Canadienne‐Française de l’Alberta (ACFA), the Mortgage Outreach Corporation, and loans from “other”
organizations.
Table 7: Sources of funds contributing the majority of raised capital
Source of Capital Operating Co‐ops Dissolved Co‐ops
Members 71.4% 60%
Personal Loans 9.5% 20%
Bank/Credit Union 23.8% 20%
Grants 38.1% 20%
14As expected, the amounts of start‐up and additional capital used ranged widely depending on the
activities co‐ops pursued5. Several operating co‐ops required no initial capital, such as one new
generation co‐operative created to jointly market the outputs produced by collaborating private
businesses. On the other hand, a housing co‐operative, constructing new buildings, raised $5 million in
initial capital and members felt they should have raised even more. Similarly, a co‐operative purchasing
and developing a railway raised $3.5 million, and its respondent stated that it would have been better
off with more, particularly given the legal and consulting costs associated with innovating and
negotiating across several governmental agencies. The costs associated with innovation (including
formal R&D and informal “learning‐while‐doing”) were also cited as substantial by one of the dissolved
co‐ops.
Most of the respondents for water co‐ops (4/5) reported start‐up costs ranging from $10,000 to $1.85
million. Only one water co‐op respondent reported significant additional capital costs ($100,000).
Housing co‐ops tended to find additional capital more important, primarily to address construction,
renovation and mortgage costs, with half (3/6) reporting significant additional costs.
9.1.2 Staff
83% (15/18), of the operating co‐ops were volunteer‐run upon incorporation. Three co‐ops had sub‐
contracted out some work, and one was in the process of hiring a property management company.
Respondents for operating co‐ops that had hired General Managers and Financial Controllers
emphasized that these individuals had contributed immensely to their success.
Most of the dissolved co‐ops had staff at incorporation (4/5) and upon dissolution (3/5), including a
retail co‐op with eight employees. Hiring staff was not, however, reported as being related to the
failure of these co‐ops.
9.1.3 Partnerships
Just over half of respondents (13/22) from co‐ops which were currently operating indicated that their
organizations made use of potential partnerships or support networks; while each of the respondents
for the dissolved co‐ops (4/4) indicated that their co‐op had entered into such relationships
Table 8: Numbers of Co‐ops which Entered into Partnerships or Support Networks and Rating of Helpfulness re Respective
Relationships
Numbers of co‐ops which entered Average score for helpfulness where 1 =
into partnerships or memberships not helpful at all and 5 = very helpful
5
For dissolved co‐ops, initial capital ranged from $2000‐$3 million and additional capital from $0‐$2million. For
operating co‐ops, initial capital ranged from $0‐$5 million and additional from $0‐$3.5 million.
15Current Dissolved Current Dissolved
ACCA 4/16 1/3 3.25 2+
CCA 2/15 0/2 4 N/A
Trade associations 0/13 1/2 n/a 3
Co‐op sector 5/17 2/3 4.6 3.5
federations
Other co‐ops 4/15 1/2 3.75 4+
Other enterprises 2/14 1/2 5 2+
or organizations
9.1.4 External Expertise
Sources of external expertise appear to have been used more by operating co‐ops during the process
preceding incorporation than after incorporation.
9.1.4.1 Pre‐Incorporation External Services
The survey revealed the following about external expertise used leading to incorporation:
Table 9: Rating of Value of External Types of Agencies and Numbers Which Used the Services Prior to Incorporation
What external expertise did you draw upon for each of the following functions? On a scale of 1‐5, with 1 being the
least, and 5 being the most, how helpful was the expertise to the success of the co‐op? (For the chart below, use the
drop down menu for any of the items that apply to your co‐op. Leave the items blank that don't apply to your co‐
op)
Note: 17 responded from active co‐operatives and 5 responded from dissolved co‐operatives.
16Consultants6 Co‐op Alberta Government Other Co‐ops
Development Community and
Initiative Co‐operative
Program Association or
BC Co‐operative
Association
Active Dissolved Active Dissolved Active Dissolved Active Dissolved Active Dissolved
(9) (0) (8) (2) (6) (4) (11) (3) (9) (4)
Feasibility 4.6 (0) 3.2 2.5 (2) 2.5 3.5 (2) 2.3 2.0 (2) 2.2 2.5 (2)
study (5) (5) (4) (10) (5)
Business 3.7 (0) 2.6 2.0 (2) 2.5 2.0 (2) 2.3 1.5 (2) 1.8 2.0 (2)
plan (4) (5) (2) (8) (4)
Accessing 4.0 (0) 3.0 2.0 (2) 1.0 3.3 (2) 2.7 3.0 (2) 2.0 1.5 (2)
capital (6) (6) (1) (11) (3)
Developing 4.0 (0) 2.8 2.5 (2) 2.3 3.7 (4) 3.0 3.7 (3) 3.1 2.7 (3)
bylaws (9) (4) (3) (11) (7)
Determining 4.0 (0) 3.0 2.0 (2) 1.0 3.0 (3) 3.1 3.0 (3) 2.6 2.5 (4)
the (6) (4) (1) (9) (5)
governance
approach
and
structure
Determining 4.0 (0) 2.0 1.5 (2) 2.5 2.3 (3) 2.3 2.7 (3) 2.3 3.0 (3)
the (6) (3) (2) (7) (6)
operational
structure
6
In error, the survey omitted “Consultants” for this question. An email was sent to those who had responded to
the survey asking them to respond via email. 15 respondents from co‐ops operating at the time of the survey
responded in the follow‐up email regarding consultants, while 17 responded to the question about other sources
in the online survey. Three (3) respondents from dissolved co‐ops responded in the follow‐up email regarding
consultants while five (5) had responded to the question about other sources in the survey.
17Consultants6 Co‐op Alberta Government Other Co‐ops
Development Community and
Initiative Co‐operative
Program Association or
BC Co‐operative
Association
Active Dissolved Active Dissolved Active Dissolved Active Dissolved Active Dissolved
(9) (0) (8) (2) (6) (4) (11) (3) (9) (4)
Coordination 4.2 (0) 2.0 2.5 (2) 2.0 3.3 (3) 1.8 2.7 (3) 1.4 2.0 (2)
of all or (6) (5) (3) (6) (5)
many of the
above
Of 24 potential respondents for co‐operatives which were operational at the time of the survey, 71%
(17) indicated that they had used some form of external expertise prior to incorporation. Government
was the most frequently used source of external expertise by this group and provincial associations (e.g.,
ACCA were the least used).
Each of the respondents for co‐operatives which were dissolved at the time of the survey indicated that
some form of external expertise was used prior to incorporation. More frequently, this group used
external expertise from other co‐operatives.
None of the respondents from dissolved co‐ops indicated that they had used consultants while 60% (9)
of operating co‐ops responding to the question (or equivalent to 42% of all participating operating co‐
ops) were reported to have used consultants.
18Figure 4: Comparison of Use of Service Types Prior to Incorporation
On average, for each listed area, consultants were rated as providing greater value than any other
source of expertise. A co‐operative housing consultant cited by two thirds of respondents from housing
co‐ops (4/6) was especially given high ratings and comments also reflected high praise.
Government was helpful in developing bylaws and determining the governance approach and structure.
Other co‐ops were most helpful in developing bylaws.
Provincial associations (e.g., ACCA) scored higher with respondents from dissolved co‐operatives in most
areas than from those which were operational at the time of the survey.
19Figure 5 Perceived Value of Helpfulness for Services Prior to Incorporation
9.1.4.2 Post‐Incorporation External Services
The survey suggested that sources of external expertise were used less frequently after incorporation,
and revealed the following:
Table 10: Rating of Value of External Types of Agencies and Numbers which Used the Services Post‐Incorporation
Expertise used after the incorporation phase to the present day: What external expertise did you draw upon for
each of the following functions? On a scale of 1‐5, with 1 being the least, and 5 being the most, how helpful was the
expertise to the success of the co‐op? (For the chart below, use the drop down menu for any of the items that apply
to your co‐op. Leave the items blank that don't apply to your co‐op.)
20Consultants Co‐op Provincial Government Other Co‐ops
Development Association
Initiative (i.e., ACCA,
Program BCCA)7
Active Dissolved8 Active Dissolved Active Dissolved Active Dissolved Active Dissolved
(7) (2) (3) (2) (3) (2) (4) (3) (6) (3)
Board 3.5 1.0 (2) (0) 2.0 (2) 5.0 2.5 (2) 2.5 2.3 (3) 3.0 2.0 (2)
Governance (6) (1) (2) (4)
Financial 4.5 1.0 (2) (0) 2.0 (2) (0) 2.0 (2) 2.0 2.0 (2) 3.0 2.0 (3)
Management (4) (1) (3)
Member 2.5 1.0 (2) 4.0 2.0 (2) 3.0 1.5 (2) (0) 1.7 (3) 3.0 2.7 (3)
Relations (2) (1) (2) (1)
Human 3.0 1.0 (2) 4.0 2.0 (2) 5.0 1.0 (2) (0) 1.0 (2) (0) 1.5 (2)
Resources (1) (1) (1)
Marketing 2.5 1.0 (2) (0) 1.5 (2) (0) 1.5 (2) 4.0 2.0 (3) 3.0 2.7 (3)
(4) (1) (1)
Operations 3.6 1.0 (2) 2.0 2.0 (2) 4.0 2.0 (2) 2.0 2.3 (3) 2.7 2.0 (3)
Management (5) (1) (2) (2) (3)
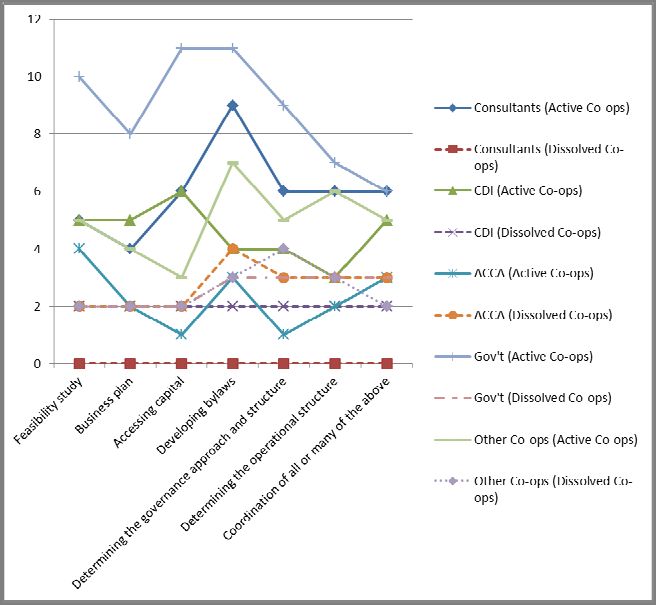
Respondents from co‐operatives which were still operational indicated that their co‐ops used
consultants more frequently than any other source after incorporation. A total of 29% of operational co‐
ops used consultants after incorporation. However, when used, consultants were generally valued
slightly less than they had been prior to incorporation. Other co‐ops were the next most frequently used
7
As this type of external expertise was stated in a different way in the pre and post questions, respondents who
had used the services of provincial association: Le Conseil de développement économique de l’Alberta included
them as “other” in the prior to incorporation question while including them under Provincial Association in the
post‐incorporation question.
8
Responses from respondents for dissolved co‐ops in this area may have been equating a “1 = not helpful at all” to
mean that the co‐op did not use the services of the agent for the respective areas. If that is so, then it is possible
that none of the dissolved co‐ops used consultants after incorporation.
21source of expertise by this group. For dissolved co‐ops, government and other co‐ops were the most
frequently used sources of external expertise.
Figure 6: Comparison of Use of Service Types Post Incorporation
22Figure 7: Perceived Value of Helpfulness for Post Incorporation Services
In their comments, two co‐ops noted that they drew a lot of expertise from their own membership, two
specified getting help from ATB Financial, one noted that it did not yet require further expertise as it is a
recently incorporated co‐op, and two noted that the housing co‐op consultancy was crucial to their
success. This same consultancy was credited for its help in other areas of the survey as well and noted
as crucial to co‐op success in participant interviews.
9.2 Major Challenges
A variety of major challenges were identified by respondents from the currently operating co‐
operatives.
9.2.1 Financing
The most common challenge by far was securing financing, cited by 56% of the respondents (13/23).
Being dismissed as risky investments by most major banks during the start‐up period was frustrating,
especially since co‐operative development activities could be capital‐intensive.
For housing co‐operatives, solidifying mortgages was specified as a financial challenge, as well as
financing construction/renovations – particularly given the unpredictability of such costs. Unexpected
building issues were not uncommon and could easily put housing co‐ops over‐budget.
9.2.2 Costs of Development
Legal fees were also described as obstacles, both in the online surveys and interviews. Several
participants felt the costs were worthwhile, while another thought they were too steep, and another felt
they were unmanageable without further financing.
239.2.3 Ongoing Operational Costs
Managing costs and revenue was a challenge for water co‐ops, wherein one respondent noted that a
water co‐op couldn’t expect to be viable if it had less than 25 members. This was something the
respondent thought should be communicated by the government to new water co‐ops.
9.2.4 Co‐ordinating with Other Groups
Co‐ordinating with groups that regulated the structure and activities of co‐ops or offered resources to
co‐ops was a challenge cited by nine respondents. In conjunction with data from interviews, this
seemed to be one of the most significant challenges for co‐ops in terms of maintaining their
momentum, optimism and financial viability. It was frustrating to respondents that some bureaucracies
seemed to work so slowly, such as Alberta Environment on approving water rights; that they required
co‐ops to “jump through many hoops”, as was described by a respondent managing several government
ministries at the same time; or that they had competing interests, as was described of one co‐op’s
municipality. Co‐ordinating with other organizations was more frustrating as more organizations
became involved and particularly if the objectives of the co‐op and other organizations were not
aligned. For water co‐ops in particular, getting water rights, land easements, and environmental
approval were major co‐ordination challenges.
9.2.5 Administrative Resources and Knowledge
Filling out forms and legal paperwork was cited as a major challenge by five respondents. It was unclear
whether this reflected a lack of knowledge necessary to complete the paperwork correctly or whether
the sheer amount of paperwork was perceived as onerous. Certainly, the latter was expressed in
interviews. Several felt that it was “nearly impossible” to keep up with running and developing their co‐
op, as well as filling out forms and reports. While reflecting on this, two interviewees mentioned having
“lost years of their lives” to their co‐ops.
Respondents also described difficulties developing knowledge of and familiarity with the processes
involved in setting up a co‐op. As well as filling out forms, this included developing knowledge of
legalities (one respondent) and incorporation rules (one respondent), and developing co‐operative
bylaws (two respondents).
9.2.6 Member Issues
Member commitment was cited by four operating co‐operatives and one dissolved co‐operative.
Finding members was described as difficult by two housing co‐ops. In an interview, one respondent
noted that this was because its housing became unaffordable when lower income caps were set for
housing co‐ops, at a time when the economy was plummeting.
9.2.7 Organizational Challenges
Challenges associated with setting up a board, organizing members and running a co‐op were cited by
four respondents
9.2.8 Marketing
Developing markets for products and/or services was cited by three respondents.
249.3 Reasons for Failure
Dissolved co‐operatives were not asked what their major challenges were, but what their reasons for
failure were.
9.3.1 External Factors
For all but one respondent (4/5), reasons cited for dissolution were primarily external to the co‐
operative. BSE was a blow to an already faltering cattle market. A plummeting industry also inspired the
formation of the dissolved retail co‐op, as well as several operating co‐ops. The retail co‐op began as a
private enterprise and became a co‐op both to improve its finances and to develop local social capital –
these goals were seen as mutually beneficial. The executive director and former owner of the enterprise
stated that the store likely lasted one year longer than it would have otherwise, due to its co‐operative
structure. However, the co‐op lacked the capital to compete in the rapidly restructuring industry which
became dominated by just a few very large players with online sales systems and very large stores. The
costs for water co‐ops to comply with increasing government standards, was too difficult, particularly
for co‐ops with small numbers of memberships.
9.3.2 Internal Factors
In one dissolved co‐op, lack of honesty among members of a producers’ co‐op may have contributed to
its financial demise, along with the provision of too many loans to members.
Internal factors were cited as primarily responsible for the failure of the fifth dissolved co‐operative.
The respondent stated that its members held entirely different perspectives on what the co‐op was
intended to achieve. The co‐op had neither developed a common vision, nor a business plan to
realistically enact this vision and its leadership was divided. There was also some unwillingness on the
part of members to devote time and labour to the co‐op, or to sit on the board. This may have been
fostered by a lack of communication regarding what was expected of co‐op members.
9.4 Resources co‐operatives wished they had had at incorporation
Resources cited by respondents were quite varied in topic and scope:
Co‐ordination of incorporation activities and moral support
Somebody to talk to
Financing and co‐op development capital
Board training
Help with bylaws from experienced people
Lists of competent contractors/technical experts
More help from co‐op associations
25 More online help
Legal/business experts
Knowledge of incorporation rules
Board with more directly relevant experience
Development of common goals
Specific to Housing Co‐ops:
Centralised member referral system for housing co‐ops
Knowledge of co‐op sector RRSPs available through CWCF
Better connections for housing co‐ops with development processes of municipal bodies
9.4.1 Co‐ordinator and Sounding Board
A few co‐operatives (two operating, one dissolved) wanted somebody to talk to who could show their
co‐operatives “the way”. This seemed related to the co‐op’s desire to have co‐op activities, resources
and bureaucracies more co‐ordinated and was re‐iterated in interviews: several interview respondents
wished they had someone available to co‐ordinate the huge scope of their multiple activities.
Respondents both in the online survey and in interviews suggested that this co‐ordinator would also
provide moral support: bolster confidence, reassure, encourage, offer perspective, maintain momentum
and “cheerlead”. For example, one respondent stated that a government official had “held their hand”
during the incorporation phase, and another spoke animatedly about the co‐op’s “amazing” consultant
that had helped “lead [them] through the process and motivate [them]”.
9.4.2 Resource Co‐ordination
Other respondents addressed the challenge of co‐ordination in different ways. One respondent from a
dissolved co‐op wished they could have accessed all or most of the needed resources from one source –
a sentiment echoed by interviewed respondents. Another respondent from an operating co‐op
suggested that organizations and governments develop their online resources further.
9.4.3 Unsure
Three co‐ops were not sure what they would have needed to further their success. This included a very
young and innovative co‐operative co‐ordinating amongst many different government organizations. It
was described as having many bureaucratic challenges, but also as being full of very competent,
knowledgeable, hard‐working people. This particular case suggests that innovating co‐ops may require
a different kind of assistance: assistance identifying the scope of their needs, which may be
unprecedented given their innovative activities; or financial assistance while they are identifying their
needs and developing new procedures, such that they do not fold in the meantime. In essence,
innovating co‐ops may need more help with R&D costs and expertise.
9.4.4 Other
26Other identified resources were fairly straightforward. Financing and co‐op development capital was
cited by six respondents (four operating, two dissolved); and a centralized housing co‐op listing was
suggested to help potential members find available housing co‐ops9.
Five respondents did not feel they had lacked resources, several of which cited organizations that had
been particularly helpful – including a housing co‐op consultancy, Northern Alberta Co‐operative
Housing Association, government workers in providing guidance and in one case, a lawyer.
9.5 What Could have Enhanced Success After Incorporation?
Again, responses were quite diverse and specific to each co‐op. Among operating co‐ops, eight
participants responded that no other resources could have enhanced their success, one specifying that it
had been very happy with its consultant and another that funding from the Agriculture Opportunity
Fund and a good board had been sufficient.
Funding to hire staff or consultants in the development stages was cited by three co‐ops, with specific
reference to paying the housing co‐op consultancy, hiring a book‐keeper and hiring organizational staff.
One respondent noted that an Agriculture Opportunity Fund (AOF) grant had been very helpful in
allowing it to hire staff.
Several responses were specific to housing co‐ops, whose respondents stated they could have benefited
from:
Advocacy or a “vouch” from outside organizations regarding the financial soundness of the co‐op
model. Specific mention was made of the CMHC, which did not provide mortgage insurance for two
participating co‐ops;
Templates or advice on design choices;
A step‐by‐step workbook on starting a housing co‐op; and
More courses through NACHA.
Others were specific to water co‐ops, which would have appreciated:
Quicker approval by Alberta Environment;
Financial access to technical expertise (building expertise and help reading engineering plans);
Advice from other water co‐ops that had done similar projects; and
A greatly expanded membership base.
Various other responses included:
9
Both the Southern Alberta Co‐operative Housing Association and the Northern Alberta Co‐operative Housing
Associations have listings of existing member housing co‐ops on their websites. !!!CHECK WITH SACHA AND
NACHA RE POLICIES FOR DEVELOPING CO‐OPS!!!
27 More publicity to help bring people on board their project;
More help from their local Alberta Treasury Branch;
More help from co‐operative associations;
More local community support10; and
Increased use of all sources of external expertise would have benefitted its operation.
9.6 What Co‐ops Would Have Done in Hindsight
There was a range of responses with regard to what participants would have done differently in
hindsight. Many (7/16) would not have done anything differently. Others would have changed a range
of internal and external factors. Among internal factors, operating co‐ops would have:
Stayed on top of their reporting;
Hired a consultant to move a project along faster;
Advertised better to encourage community investment and/or membership; and
Developed more resiliency in their business plan (in this case, increased housing unit costs to
protect against unexpected construction costs).
Dissolved co‐ops would have:
Developed a strong business plan;
Contracted out portions of the work;
Developed their marketing and publicity; and
Ensured they had someone with strong, applied business skills on the board.
In several cases, participants would have liked to influence external factors – primarily regulations. For
example, they would have fought changing income caps in a housing co‐op, as well as regulations that
discouraged entrepreneurship in an animal products industry. Finding time for advocacy, however, is
likely quite challenging for co‐op members struggling to establish their enterprise.
Several co‐ops wished they had had help finding competent technical expertise in construction and
inspection, as well as help paying for it; and one water co‐op respondent emphasized that the
government should advise on the appropriate size for a water co‐op, which the respondent cited as
likely not cost‐effective if membership is under 25.
10
Neither specified what kind of local community support. Based on other comments made by the co‐ops, this
likely referred to financial and labour investments. It may also have referred to local solidarity on these projects –
moral support, non‐interference, and no direct attempts at competition.
2810 Interview Results
Respondents interviewed represented six co‐operatives which were active at the time of the interviews
and two which were dissolved or in the process of dissolution. A summary of responses to key interview
questions is presented in Appendix 3.
10.1 Success Factors
10.1.1 Capital
Respondents for two‐thirds of the operating co‐ops (4/6) described their co‐ops as either financially
stable or very healthy. The other two described their co‐ops as vulnerable.
Raising capital was described as challenging and as an important success factor. It was not, however,
cited by dissolved co‐ops as a core reason for failure.
Successful strategies for attracting capital included:
Developing an appropriate share structure to attract investment
Establishing/identifying healthy markets prior to incorporation
Building shared vision, trust, and enthusiasm among community members to attract investment
Continually seeking out resources, asking for help, and developing networks to develop a resource‐
base
Working with co‐op consultants, such as the housing co‐op consultancy
10.1.1.1 Start‐up Capital
Despite the strategies listed above, start‐up financing/funding was a major challenge for all but one
interviewed co‐op. Mainstream banks were reluctant to finance co‐operatives with no corporate
history, which applied to all but one of the co‐operatives represented in the interviews. This was
particularly difficult for capital‐intensive co‐ops that had to purchase businesses, equipment, land,
inventory, and building materials, and pay for labour and consultants. More research, time and
creativity were then required to secure funds from credit unions, government agencies and non‐
governmental organizations.
Several co‐ops stated that even after raising significant amounts of start‐up capital, as requested by
larger banking institutions, they were declined funding. As such, one participant voiced his strong
support for a venture capital type of fund for co‐operatives in Alberta.
Difficulties in accessing capital had a significant impact on a co‐op’s ability to access development
opportunities, such as legal services and consulting. Indeed, receiving essentially free consulting and a
free feasibility study, both covered by a grant,was key to the success of one operating co‐op.
Of course, access to capital on its own does not create success. Indeed, one of the dissolved co‐
operatives appears to have had both ample investment from the community plus a product
29development grant, but lacked the know‐how to create a revenue stream from the innovative product
they were developing.
10.1.1.2 Additional capital
Additional costs were described as easier to finance than initial costs if a co‐operative had developed a
relatively good financial profile. On the other hand, funding unexpected building costs at the housing
co‐op, which had not yet had the chance to prove its financial viability, was seen as risky. Furthermore,
securing mortgages was cited as very challenging given the hierarchy on foreclosing properties in its
specific situation: properties were first turned over to the co‐op, then to the city, and lastly to the bank.
10.1.1.3 Cost of Innovation
Costs associated with innovation were cited as significant by several respondents. Four of the co‐ops
interviewed were innovating with regard to policy and financial structure, which incurred additional
legal and consulting costs. In two cases, policy innovations were designed to decrease the time and
expense of incorporation, such that the overall time and cost was significantly diminished. As noted
earlier, one of these co‐ops also received a grant for a feasibility study, which was cited as critical to the
co‐op’s development. The respondent stated that members would never have paid this sum out of their
own pockets, and that the project would never have gotten off the ground without the grant. In
another case, innovations involving regulations across several governmental agencies not only increased
consulting fees, they stalled the development process. costing them potential revenues, and required
much more volunteer time and effort from the board to complete paperwork and negotiate. This was
not considered financially or psychologically sustainable by board members, who felt their lives were
being consumed by their work.
10.1.1.4 Dissolved co‐ops
The dissolved co‐ops did not isolate capitalization as pivotal to their demise. Rather, one co‐op
emphasized financial management as a pivotal issue, and the lack of a clear business plan. The other
dissolved co‐op stated it was “over‐capitalized”, but its major financial challenge was external: the
industry’s flagging ability to support small and medium‐sized businesses. More funding/financing might
have helped, but likely would not have provided a long‐term solution.
10.1.2 Training and Support
Outside training and support were cited as very helpful by four co‐ops. Those considered invaluable to
the success of these co‐ops included a housing co‐op consultancy, financial and organizational
consultants, a Community Futures worker, lawyers and a marketer. Workers at Alberta Agriculture and
Rural Development were described as very hands‐on, very helpful, and very trustworthy in two cases,
but not pivotal to the success of one of these co‐ops. With regard to housing co‐ops, associations were
considered helpful, but the work of a housing co‐op consultancy much more so; and one co‐op
expressed disappointment that the Canada Mortgage and Housing Corporation had not provided
assistance.
30The role of the ACCA was considered invaluable in one circumstance, where through special project
funding received from the Rural Alberta Development Fund it funded a full range of development
services performed by a private consultant. Another respondent was quite emphatic that she had never
heard of the ACCA or the CCA or any co‐op development programs. She felt her co‐op had done quite
well without it, but added that it may have taken a more expensive route by relying primarily on its
lawyer, with additional help from the AARD. A third respondent felt that the ACCA’s role in his/her co‐
op was “fuzzy”. The co‐op’s executive director knew the association had been involved somehow, but
not what role it had fulfilled, and this was described as confusing.
The Co‐operative Development Initiative (CDI) was used by two participants and considered somewhat
helpful by one and very essential by another. One participant noted the serendipitous nature of the co‐
op’s connection with the CDI, and went on to note that most connections made by the co‐op were quite
serendipitous. Overall, it was not very aware of available resources. This was echoed by several other
co‐ops. Serendipity worked better for some than others, usually depending on the co‐op’s social
network or on the existence of local support resources. For example, one co‐operative had a
Community Futures office in town and quite naturally made a connection with it; in another case,
members of a co‐op had personal connections to a lawyer with extensive experience in the co‐op sector
and developed a good working relationship with this person. On the other hand, two respondents felt
that there was a marked disconnect between help and resources and the groups that needed them.
One stated that she had put in time researching available resources, but it was hard to know which
resources would be useful and figuring that out took a lot of energy. “Help isn’t help if it’s not close
enough at hand”, she remarked. In addition to their needs leading up to incorporation, respondents
recognized development needs post incorporation. Three co‐ops suggested that new co‐ops receive an
information package on available resources upon incorporation.
Another respondent felt that the biggest hurdle for most people who need help is asking for help and
support and stressed that you “have to keep asking.” He noted that there is a lot of money available in
corporations and organizations, if it can be accessed.
One respondent mentioned feeling that there was a divide among bureaucrats/consultants and rural
people, where rural people were sometimes treated as less intelligent, or as not knowing what was in
their best interests. He felt that his co‐op’s consultant was unwilling to listen to the needs of the co‐op
as expressed by board members, or to use their expertise to fill in the gaps in his/her own knowledge.
To help their clients, the participant felt that consultants must listen to the needs, aspirations and goals
of co‐op members.
Based on qualitative interviews, the helpfulness of training and support initiatives did not seem to hinge
on the organization providing the help; rather, the qualities of the individuals providing help were
described as critical. These included commitment, willingness to listen and learn, willingness to interact
face‐to‐face and/or over the phone, knowledge of co‐ops and/or of the given industry, willingness to
work hard, ability to motivate, and ability to co‐ordinate. The major significance of the organizations
31You can also read