HIGHER EDUCATION PARTNERSHIPS FOR PROSPERITY - A Vision For a New Skills and Innovation Economy Through Collaborations Among Higher Education ...
←
→
Page content transcription
If your browser does not render page correctly, please read the page content below
HIGHER EDUCATION
PARTNERSHIPS FOR PROSPERITY
A Vision For a New Skills and Innovation Economy Through Collaborations
Among Higher Education Institutions, Employers, and Regional Communities


EXECUTIVE SUMMARY
Higher education1 is critical for the health and prosperity of our Minnesota communities. Higher education
provides many of the skills and innovations that drive regional economic growth, employment, quality of
life, and competitiveness. Institutions of higher learning provide services that keep our communities viable.
Minnesota has a highly advanced post-secondary education system, with over 200 institutions serving
nearly 500,000 students annually and a budget of roughly $7 billion.
Minnesota’s historical strengths in higher education give it an advantage, yet there is an urgent need to
take strategic action and make investments to create a next level of excellence in Minnesota higher educa-
tion:
Future economic growth and prosperity will require deeper and more relevant skills from the
workforce and increased innovation from researchers, entrepreneurs, and businesses. It is
estimated that Minnesota jobs requiring post secondary education will grow by nearly 8% from
2008 to 2018, while jobs requiring not more than a high school diploma will grow by only 3% over
the same period. By 2018, 70% of Minnesota jobs will require post secondary education. 2
Competition for talent and innovation among regions and nations has intensified. Countries
around the world are placing great emphasis on higher education, surpassing the U.S. in post-
secondary educational attainment among 25-34 year olds by up to 40%.3
Historical business models in higher education are under strain, as government funding of higher
education has decreased markedly in recent years. Pressures on state budgets drove a 20%
reduction of higher education funding per student on average nationally, and a 35% reduction in
Minnesota from 2000 to 2010.4 Budgetary pressures will likely continue in the foreseeable future,
impacting both student and institution economics, and driving a need for institutions of higher
learning to reach new levels of efficiency.
A diverse array of online educational offerings and players are reshaping the higher education
landscape.
With strong forces impacting higher education and the economy, we cannot wait to take action, but must
actively lead and innovate to build a system of higher education in Minnesota that is not only relevant, but
preeminent in the 21st century.
The Itasca Higher Education Task Force brought together leaders from Minnesota’s higher education
institutions and business community to identify strategies to build upon the strengths of our educational
system and meet the challenges ahead, forming a four-part strategic vision for higher education in collabo-
ration with businesses:
1
“Higher education” as used throughout this report refers to all forms of post-secondary education, including
non-credential programs, less-than two year credentials, two-year degrees, four-year degrees, and graduate
and professional education.
2
Georgetown University Center on Education and the Workforce, “Percent of Jobs Requiring Postsecondary
Education in 2018,” 2010
3
Percentage of adults holding associate’s degree or higher. OECD Database. See Exhibit 5.
4
State Higher Education Executive Officers Organization. See Exhibit 7.
1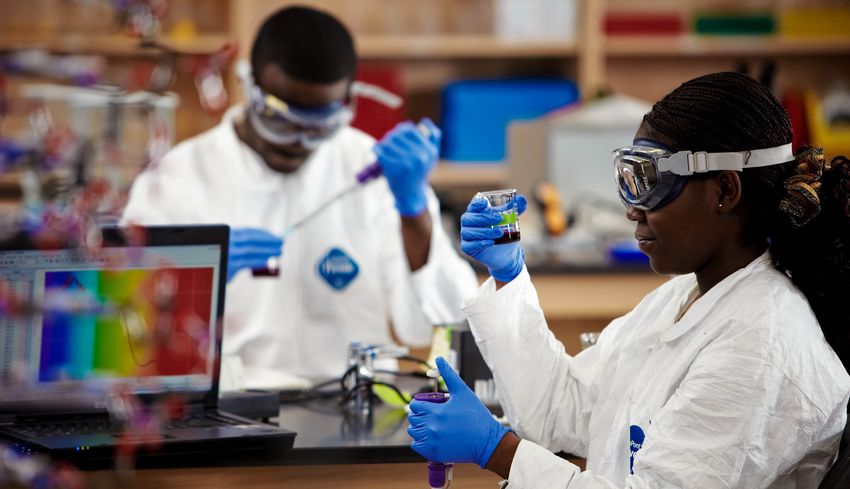
Align academic offerings with workforce needs.
Foster an ecosystem of research and innovation.
Form new collaborations across higher education to optimize system-wide intellectual assets
and efficiency.
Graduate more students.
These four efforts have a single unifying theme: collaboration. Where higher education institutions
and businesses have acted largely independently before, a new wave of collaborations amongst
institutions and between those institutions and business – have the potential to create a fundamentally
more powerful engine of learning, innovation, and economic growth for the state of Minnesota. While
important collaborations have been undertaken in the past, the new efforts are directed at fostering
partnerships with far greater intentionality and scale than previously imagined, creating the nation’s
foremost collaboration of educators and employers.
Because higher education has such strong links to regional economic and civic health, all
Minnesotans and their organizations share interests in the strength of our higher education system.
For Minnesota’s future growth and prosperity, we call upon the state’s citizens, families, students,
businesses, policy makers, civic organizations, and educational organizations to unite in supporting
strategic actions that build upon Minnesota’s historic strengths to create a new era of innovation,
transformation and excellence in higher education.
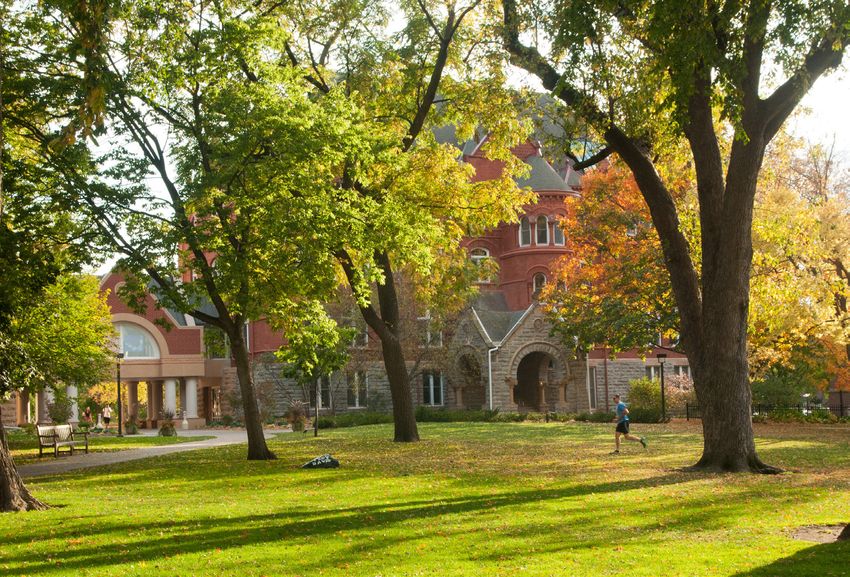
© Photo courtesy of Minnesota State Colleges and Universities. Photo used with permission.
2
THE INCREASING SIGNIFICANCE OF
HIGHER EDUCATION IN THE 21ST CENTURY
Higher education is widely accepted as providing   While this Task Force focused explicitly on
people with paths to better jobs and increased     higher education, it must be emphasized that
quality of life. But what specifically are the     success in higher education builds largely on the
benefits of higher education? More pointedly,      foundation of strong PreK-12 education. Early
why should Minnesotans care about excellence       education, basic skills, workforce and college
in higher education, and why is change needed      readiness, and equal quality and opportunity for
more pressingly than ever before? These            students of different racial and socio-economic
questions have three linked answers:               backgrounds are among critical outcomes we
                                                   must continue to advance within Minnesota’s
1. Higher education dramatically improves          PreK-12 system.
   the quality of life both for those educated
   and for others in the community.                Over a longer time horizon, a coordinated human
                                                   capital strategy for Minnesota should connect
2. Several of Minnesota’s historical               strategic efforts to drive excellence in education
   economic growth drivers (e.g., increases        across the PreK-12 and post-secondary
   in high school completion and workforce         systems. Nevertheless, there are presently large
   participation) have limited capacity to         opportunities to enhance Minnesota’s economic
   fuel further expansion. The state needs         prosperity and competitiveness through direct
   new engines of economic growth, and             transformation of higher education. Hence,
   higher education holds the promise to           this Task Force focused exclusively on higher
   create growth and jobs.                         education to direct attention and resources
                                                   towards meeting specific goals.
3. In the global economy of the 21st
   century, higher education is key to             Returning to our focus on higher education, each
   Minnesota’s remaining competitive               area of significance will be explored in greater
   nationally and internationally for the          detail below.
   decades to come.

Exhibit 1

 INDIVIDUAL AND COMMUNITY BENEFITS OF HIGHER EDUCATION
                                                                               1

                    Economic benefits                 Other quality of life benefits

  Individual        ▪ Higher employment                   ▪ Health
  benefits          ▪ Higher earnings                     ▪ Other intangible benefits
                    ▪ Higher social mobility

  Community         ▪ Increased wages                     ▪ Participation in civic life
                      for a broader community               (voting, volunteerism, engagement)
  benefits
                    ▪ Greater economic                    ▪ Greater tax base
                      competitiveness
                    ▪ Job creation                        ▪ Direct community services /
                                                            outreach from higher education
                    ▪ Increased innovation

                                                                                                        3
1. Higher education dramatically improves quality of life both for those educated and for
       others in the community.

    Higher education is linked to a range of economic and quality-of-life benefits for both individuals and
    communities, including higher employment and wages, better health, and greater civic participation
    (Exhibit 1).

    Higher education has significant effects on employment outcomes (Exhibit 2).

    The linkage between higher education, higher employment, and greater earnings is substantial.
    Persons with bachelor’s degrees earn nearly twice as much and are half as likely to be unemployed
    as their counterparts with only high school diplomas. Wage benefits accrue to all persons living in
    communities: states with greater levels of higher education have higher earnings even among those
    with high school diplomas or less.

    Higher education is clearly linked to substantially higher socio-economic mobility. The majority (62%)
    of children from the bottom income quintile who attain a college degree escape poverty, achieving
    earnings in the middle quintile or higher, compared with less than one-third of those without a college
    degree.5

    Exhibit 2

    HIGHER EDUCATION’S IMPACT ON EMPLOYMENT AND WAGES

                                     Higher education has a                                                           … with everyone benefiting
                                                                              … and a large impact on
                                     major impact on                                                                  from higher regional
                                                                              wages …
                                     employment …                                                                     education levels
                                                                              Annual income by                        Increased wage impact
                                      Unemployment rate by                    educational attainment                  due to increased state
                                      educational attainment                  $ Thousands, average                    higher education levels4
    Educational attainment            Percent, average 2001-10                1998-20073                              Percent

    Less than high school                                            9.3              21                                                             32

    High school                                           5.9                              31                                                   27

    Associate’s/some college                           4.9                                  35                         NA2

    Bachelor’s1                                 2.9                                                 58                                   20

    Advanced                          NA2                                                                    84              6

    1 For unemployment, Bachelor’s figures (2.9%) represent both Bachelor’s and Advanced degrees. For all other categories, figures are only Bachelor’s
    2 Data not available
    3 Average given using constant dollars
    4 Increased wage impact reflects percent average wage difference by education attainment in states with 38% of population college graduates versus
      states with 23% of population with college graduates
    SOURCE: Bureau of Labor Statistics; Economy.com; College Board; Education Pays

                                                                                                                                                          2

    5
         Pew Charitable Trusts, Economic Mobility Project

4
In addition to its deep and numerous economic benefits, higher education also affords quality of life
benefits that go beyond economics. Attainment of higher education is associated with greater health,
including increased rates of health coverage, lower incidence of lifestyle health risks (e.g., smoking,
obesity), and decreased exposure to dangerous work.6 At the community level, higher education is
linked to greater civic engagement; persons with a bachelor’s degree or higher are 50% more likely
to vote, and more than twice as likely to volunteer, than persons with not more than a high school
diploma.7

Thus strong evidence shows that economic and quality of life benefits are enjoyed by individuals
receiving higher education, while spillover benefits accrue to all persons living in communities with
increased levels of higher education. While this report focuses primarily on the economic benefits
of higher education, we must remember that higher education confers many deeply important non-
economic benefits as well.

2. Several of Minnesota’s historical economic growth drivers (e.g., increases in high
   school completion and workforce participation) have limited capacity to fuel further
   expansion. The state needs new engines of economic growth, and higher education
   holds the promise to create growth and jobs.

Minneapolis-St. Paul held an advantage over much of the rest of the country in job creation in the
1990s, but that advantage has since dissipated (Exhibit 3).

Improving high school graduation rates impacted economic growth from 1970-2000. In that period,
Minnesota raised graduation rates from 58% to 88%, rising from 17th among states in 1970 to 2nd
in 20008. Concurrently, per capita income in the state rose from $21,000 to $41,000 (in constant
2010 dollars). But with already high levels of graduation, further gains were small: from 2000 to 2010,
graduation rates moved from 88% to 92%, with income rising to $43,000. The state’s achievements in
raising high school graduation rates should be celebrated, but now we need to find new initiatives to
propel Minnesota’s growth in years to come.

Demographic forecasts indicate that labor force growth in Minnesota will be modest, with only a 7%
total increase in the state’s working age population from 2010-2030, a growth rate of less than 1%
growth per annum.9 Much of the impact to workforce growth comes from baby-boomer retirement.

To regain preeminence as a leading economic region, Minnesota must actively cultivate new engines
of economic growth. Given demographic trends, Minnesota will need to drive economic gains
by increasing labor productivity and innovation rather than workforce participation alone. Higher
education is central to supplying the skilled talent and innovations that are major drivers of productivity
and job creation. Therefore, it is essential that Minnesota continues to promote an exemplary higher
education system.

6
    Alliance for Excellent Education, “Dropouts, Diplomas and Dollars”
7
    College Board; Education Pays
8
    U.S. Census Bureau, Bureau of Labor Statistics, Minnesota State Demographic Center; all high school graduation rate and
    per capita income figures come from this source.
9
    Minnesota State Demographic Center.
                                                                                                                              5
3. In the global economy of the 21st century, higher education is key to Minnesota’s
remaining competitive nationally and internationally for the decades to come.
In the new era of global trade, global commodities, and global labor markets, advantages in producing
highly skilled labor and ground-breaking innovations are critical sources of regional competitive
differentiation. In this global context, Minnesota competes for talent, innovations and business not
only with other U.S. regions but also with other global centers; to compete successfully, the state must
continue to build and distinguish its higher education system.
Leaders from around the world have been emphasizing the importance of higher education.
“No issue will have a bigger impact on the future performance of our economy than education. .
. . We can’t allow higher education to be a luxury in this country. It’s an economic imperative that
every family in America has to be able to afford.” – President Obama 10
“To be globally competitive and to secure the high skilled jobs of the future, Australia needs
an outstanding, internationally competitive higher education system. . . . The Australian
Government’s goal is for this country to be amongst the most highly educated and skilled on earth,
and in the top group of OECD nations for university research and knowledge diffusion.” 11
Exhibit 3
MSP METRO JOB CREATION VERSUS U.S. AVERAGE
Difference between Minneapolis-St Paul and employment growth relative to the U.S.1
Percent
1.2
MSP vs. U.S.
1.0
0.8
0.6
0.4
0.2
0
1990 1992 1994 1996 1998 2000 2002 2004 2006 2008 2010
-0.2
-0.4
-0.6
1 3-year moving average difference between MSP and the U.S. using the given year and the previous 2 years for all historical data. Using total
non-farm payroll data
SOURCE: Bureau of Labor Statistics
3
10
President Obama’s Remarks to the National Governors Association, February 27, 2012.
11
Commonwealth of Australia, “Transforming Australia’s Higher Education System,” 2009
6
Nations around the world have been investing heavily in higher education; while the U.S. is a leader
in higher education attainment among 35- to 64-year olds, in the younger cohort the U.S. is being
surpassed by many countries (Exhibit 4).

In an age when businesses may locate operations and headquarters anywhere in the world, and
when highly skilled entrepreneurs, innovators, and employees can move to any number of desirable
places nationally and internationally, Minnesota must have an education system capable of winning
against global competition.

In addition to the competition coming from other regions and nations, sweeping change in
teaching technologies and online offerings is reshaping higher education. Traditional institutions
have launched online capabilities, and web-based profit and non-profit institutions have become
major players in the educational arena. The ability to teach and learn at a distance will continue to
fundamentally alter how higher education institutions serve students, compete, and collaborate with
one another.

Faced with increasing competition and rapidly evolving technological change, it is imperative that
Minnesota’s higher education system be responsive to present and unfolding challenges and
advance as an educational leader.

Exhibit 4

INTERNATIONAL COMPARISONS OF HIGHER EDUCATION ATTAINMENT

 Educational level of older Americans reflects educational         Other countries are prioritizing educating their next
 progress of earlier times                                         generation and surpassing U.S. attainment levels
Percent of adults age 35-64 holding associate’s degree or higher   Percent of adults age 25-34 holding associate’s degree or higher

 Canada                                                  44        Canada                                                         55
 United States                                      39             Japan                                                         54
 New Zealand                                      36               Korea                                                        53
 Japan                                           35                New Zealand                                          44
 Finland                                        34                 Ireland                                             42
 Denmark                                       33                  Belgium                                             42
 Australia                                   31                    Norway                                              42
 Norway                                     30                     France                                             41
 Belgium                                   29                      Denmark                                            41
 Switzerland                                29                     United States                                     39
 United Kingdom                            28                      Spain                                             39
 Ireland                                 26                        Australia                                         39
 Korea                                  25                         Finland                                           38
 Germany                               24                          United Kingdom                                   37
 Spain                               23                            Switzerland                                 32
 France                             21                             Germany                           22
 Poland                        14                                  Portugal                         20
 Czech Republic                14                                  Mexico                          19
 Mexico                       13                                   Italy                          17
 Italy                      12                                     Czech Republic               14
 Portugal                  10                                      Turkey                      13

SOURCE: OECD database

                                                                                                                                      4

                                                                                                                                          7
A SNAPSHOT OF MINNESOTA’S
HIGHER EDUCATION SYSTEM IN 2012
Exhibit 5
Overview of Minnesota’s Higher Education System
▪ Five campuses: Twin Cities, Morris, Crookston, Duluth and Rochester
▪ 68,000 students currently enrolled
University of ▪ Grants ~14,000 degrees per year, 64% of them undergraduate, and
Minnesota – 90% of all STEM doctorate degrees
– 85% of all medical doctor degrees
– 100% of all dentistry, pharmacy and veterinary medicine degrees
▪ Annual budget ~$4.2 bn
▪ 31 institutions on 54 campuses
– 24 Community and technical colleges
MN State
– 7 State universities
Colleges &
Universities
▪ 434,000 students (including both credit and non-credit1) Total spend: over
(MnSCU)
▪ Grants over ~38,000 degrees and other awards per year, 32% $7 bn per year
certificates, 37% AAs, 26% BAs, and 5% advanced degrees
Total students2:
▪ Annual budget ~$2.0 bn
468,000
▪ 17 private, non-profit, 4-year, liberal arts schools in MPCC Total
Private – 68,000 students enrolled institutions: 205
colleges – Grants nearly 14,000 degrees per year, 67% are undergrad
– Annual spend ~$1.3 bn
▪ 152 schools; 24 solely on-line
▪ Biggest are Walden University, Capella University, and Rasmussen
Private College, which between them offer range of degrees (i.e., AA to
for-profit Ph.D) in online and traditional environments
schools ▪ Other offerings range from healthcare assistants to yoga instruction
▪ 88 only offer less than 2-year degrees
▪ Annual spend unknown; most are not publicly traded
1 Includes 277,000 students in for-credit courses and 157,000 in non-credit courses
2 Total students from Minnesota Office of Higher Education; does not include students in non-credit courses
SOURCE: Minnesota Office of Higher Education; MnSCU budget request book; MnSCU website; UMN website; MPCC website
5
Minnesota is fortunate to have a broad and strong system of higher education (Exhibit 5).
Minnesota’s higher education system has four major components:
1. The University of Minnesota, a land-grant, public university and major research and teaching
institution;
2. The public Minnesota State Colleges and Universities (MnSCU) system, with its fifty-four
campuses that serve urban and greater Minnesota;
3. Seventeen private non-profit colleges, including Augsburg, St. Scholastica, and Macalester, which
offer diverse programs; and
4. Many private for-profit institutions, including many specialist institutions such as McNally Smith
College of Music, Art Institutes International Minnesota, and online educators like Capella
University and Walden University.
8Minnesota’s higher education system has many strengths
Our post-secondary education system in Minnesota has many positive attributes:
Unique breadth and depth in educational institutions. Whereas many state education systems
are defined by a small number of institutions, Minnesota has a great array of institutions with
different missions, capably serving various program offerings, geographies, and student groups.
High rates of post-secondary enrollment and educational attainment. Minnesota is
8th among states in the share of high school graduates enrolling directly in higher education.
Completion rates in Minnesota private colleges are 9 points above peer averages.
World-class research institutions and graduate education. The University of Minnesota is
a major center of research and graduate and professional education – ranking 8th among U.S.
public universities in R&D expenditures – and a national leader in food safety, agriculture, medical
devices and clinical innovations. Minnesota’s Mayo Clinic is a world leader in clinical practice and
medical research.
Successful models of new thinking and innovation in higher education . Examples
include: The FastTRAC program, a MNSCU - DEED Partnership that provides rapid vocational
credentialing to those without post-secondary degrees; Customized training to 125,000 workers
annually through MnSCU-employer partnerships; U of M Academic Health Center’s Corridors
of Discovery, which is enhancing interdisciplinary collaboration in addressing major health
problems (e.g., The Decade of Discovery: A Minnesota Partnership to Conquer Diabetes, led by
The Minnesota Partnership for Biotechnology and Medical Genomics, and involves collaborative
efforts by the University of Minnesota, Mayo Clinic and the state of Minnesota); and major on-line
universities such as Capella and Walden, which are based in Minnesota.
Strong and diverse local economy and business community, with more Fortune 500
companies per capita than any other state. A thriving local economy and high quality of life
are critical components needed to attract and retain key talent in our state. Given the strong
and diverse local economy and business community, there is extraordinary potential for more
effectively leveraging the region’s economic assets for the development of Minnesota’s citizens,
workforce, and innovative potential.
Financial trends in higher education
Higher education is funded in many different ways, but a few key trends can be observed. From 2000-
2010, state support declined across the U.S., but Minnesota made deeper than average cuts to higher
education funding on a per student basis. In the course of de-funding higher education, Minnesota
lost relative position among states, transitioning from above average funding levels prior to 2003, to
substantially below average funding levels since then (Exhibit 6).
On a percentage basis, Minnesota’s cuts to higher education from 2000 to 2010 exceeded those of all
but three other states—Georgia, Michigan and Ohio.12
12
State Higher Education Executive Officers
9As a consequence, over a similar time period, both net tuition and student debt (for students that take
loans) grew substantially above the rate of inflation (Exhibit 7).
On a national basis, net tuition grew at least 3% faster than inflation for all major types of higher education
institutions. This represents a significant increase in the price of higher education to students.
In many instances, increased reliance on tuition to support basic educational activities is a direct offset
for declining government support of higher education. For example, within the MnSCU system, as
support from the state fell by 45% from 2000-2012, state appropriations as a percent of system revenue
fell from 67% of revenue to roughly 39%. Over the same period, tuition as a percent of system revenue
rose from 33% to 61%. From 2000-2011, MnSCU’s costs of educating students were actually reduced
by 10%. 13 Hence, the primary driver of increased tuition at MnSCU has been the need to offset loss of
government funding. The situation is similar at the University of Minnesota, where expenditures from
tuition and state support on its mission of education, research, and outreach dropped 5% per student
from 2000 to 2011. 14
Exhibit 6
U.S. STATE FUNDING OF HIGHER EDUCATION 2000-2010
State higher education appropriations per public FTE1 Avg. of U.S. states
Constant 2010 dollars MN
10,000
9,208
9,000 8,698
8,506
8,000
8,035 7,979
7,682 7,325
7,211 7,195
6,986 6,951
7,000 6,740
6,896 6,662 6,816
6,451
6,516 -20%
6,485 6,461
6,331
6,000 6,191
5,957 -35%
5,000
2000 2001 2002 2003 2004 2005 2006 2007 2008 2009 2010
1 Educational appropriations include ARRA (American Recovery and Reinvestment Act) funds
SOURCE: State Higher Education Executive Officers
6
13
MnSCU FY 2013 Operating Budget, Presentation to Board of Trustees, May 15, 2012
14
Source: Presentation to the University of Minnesota Regents Worksession, October 2011. While
the specific figures vary, similar dynamics of tuition increases offsetting reduced government
funding are at play for many other institutions of higher education to students.
10Exhibit 7
NET TUITION AND STUDENT DEBT GROWTH
U.S. undergrad net tuition grew significantly faster Student debt levels also grew rapidly, with MN
than inflation 2000-08 becoming among the most debt-burdened states
Undergraduate net tuition1 by institution type Average debt per graduate among the 50 states2,3
CAGR net of inflation, 2000-08 U.S. $ Thousands; CAGR in constant ‘09 $ Thousands
CAGR 2000-09
Percent
Public less-than-2-year 10.8 Maximum 31 2.5
Public 2 yr., Minnesota 29 4.3
4 yr. non-doctorate 3.5
Top quartile 25 1.8
Public 4 yr. doctorate 4.7
Median 23 1.5
Private (all) 3.0 Bottom quartile 21 1.4
1 Net tuition includes tuition plus fees minus all grants
2 Average cumulative student loan amount borrowed among students who take loans. Includes less than 2 year, 2 year, and 4 year and above institutions
3 Nominal figures adjusted to 2009 dollars using federal funds composite deflator
SOURCE: National Center for Education Statistics; National Postsecondary Student Aid Studies 2000, 2004, 2008; The Institute for College
Access & Success; College InSight
7
Increases in tuition are having significant impact on students. From 2000 to 2009, student debt levels
have grown in real terms (net of inflation) at 1.4% per annum in most states, while students from many
states amassed debt faster. Student debt in Minnesota grew at an alarming 4.3% per annum, making
Minnesota one of the states with highest debt per student. Following this marked run up in debt, in 2010,
the total amount of student debt in the U.S. surpassed the total amount of consumer credit card debt.
While it is not the intention of this report to advocate specific funding-related policy changes, it is clear
that higher education funding has come out of balance. For higher education to be an ongoing source
of prosperity and competitiveness for Minnesota, the funding of our students and institutions must be
brought to a solid and sustainable path. Furthermore, higher education institutions must continue to
innovate their operating models, substantially improving productivity and providing a higher return on
student and public investments.
11ITASCA HIGHER EDUCATION TASK FORCE:
STRATEGIES AND FINDINGS
The Mission of the Itasca Higher Education Task Force
The Itasca Higher Education Task Force brings together Minnesota leaders to define,
promote, and take direct action on strategies for advancing higher education in Minnesota
as a means of enhancing economic prosperity, competitiveness, and quality of life for the
state and citizens of Minnesota.
Traditionally, higher education institutions have operated independently from one another, producing
skilled persons and innovations which then become inputs used by businesses. This simplified
economic view is represented in Exhibit 8.
Exhibit 8
SIMPLE ECONOMIC MODEL OF HIGHER EDUCATION INTERACTION WITH BUSINESSES
Higher
Public education Businesses Public
Students Goods
Skilled
employees
Faculty &
Researchers Services
Research &
Funding Innovation Jobs
Jobs
The reigning feature of this interaction is independence:
Higher education institutions act separately from one another, sometimes viewing each other as
competitors rather than collaborators.
Businesses treat higher education as supplying inputs to production. As a group, businesses only
infrequently interact directly with higher education, and when they do so, they interact in a one-off
manner, rather than addressing higher education with the collective voice of regional businesses.
Consider, alternatively, what would happen if higher education institutions and businesses took a much more
collaborative, interdependent approach on matters of common interest (Exhibit 9). 8
Building this collaborative system would require implementing four key strategies. The
first two strategies relate to information flowing from businesses to higher education
institutions and students.
1. Align academic offerings with workforce needs: regional businesses collectively take a direct role in
partnering with the regional higher education system on skill needs, actively communicating desired skills
to higher education, and helping train students (through internships, course activities, financial support,
shared training activities, partnerships, or other).
2. Foster an ecosystem of research and innovation: regional businesses partner with the regional higher
education system to co-create research and innovation agendas, taking direct or supporting roles when
appropriate.
12With more information available regarding skill and innovation needs, businesses can better meet
their needs; students can make more positive education and career choices, and more readily
find rewarding employment upon completion; and higher education institutions can better utilize
resources to meet employer and student demands, raising the value of their educational offerings.
The next two strategies relate to moving from today’s levels of efficacy and
productivity within higher education institutions to even greater levels via
collaborative efforts:
3. Form new collaborations across higher education to optimize system-wide intellectual assets and
efficiency: higher education institutions across the state collaborate more with one another, acting
in an effective, coordinated manner, leveraging system-wide best practices, assets, and scale to
reach new levels of efficacy and efficiency.
4. Higher education takes systemic action to raise graduation rates.
Exhibit 9
SIMPLE ECONOMIC MODEL OF HIGHER EDUCATION INTERACTION WITH BUSINESSES
Coordination Information flow Outputs / inputs
Higher
Public Inform education Inform Businesses Public
Students Goods
Skilled
employees
Faculty &
Researchers Services
Help train
Research &
Funding Innovation Jobs
Jobs
Help create
Making the state’s higher education system more effective and productive would raise access, affordability
and value for students. It would also raise the value offered and competitiveness of our higher education
institutions versus those in other regions. Furthermore, this would boost the supply of valuable skills and
innovations for our region’s businesses, fueling their ability to grow output, create jobs, compete, and
contribute to regional prosperity, while increasing the attractiveness of the region for new businesses to
start or move here.
In addition to the four strategies above, two enablers support positive change: statewide education data
systems and effective governance. Enhanced data reporting and infrastructure play an important role in the
increased information sharing envisioned in collaborative efforts across the state higher education system.
9
Overall, the Task Force believes collaborations promoting the four strategies outlined above can
dramatically enhance higher education in the state of Minnesota, which in turn will provide a new growth
engine for regional businesses and community prosperity.
It should be emphasized that in all four strategy areas significant efforts are already under way, involving
higher education institutions, businesses, students, community partners, and policy makers. The purpose
of advancing the four strategies is to create a shared higher education vision for Minnesota that will greatly
enhance collaborative efforts, with breadth and depth enough to usher in a new era of growth and
prosperity for the state. Specific findings and details related to each strategy follow. 13Strategy 1: Align academic offerings with Skill gaps appear in various ways. Nationally,
workforce needs employers report difficulty in filling open positions
– 64% of surveyed employers reported difficulty
To produce goods and services and compete in finding qualified applicants for positions,
in the global economy, Minnesota’s businesses and 57% of employers reported experiencing
seek employees with strong occupational significant impact due to not being able to fill
and foundational skills. Occupational skills open positions.15 There are often skill deficiencies
are particular to given industries and careers, even among those hired. Among surveyed
and include specific technical and trade employers, 63% reported that many recent
knowledge (e.g., nursing, computer engineering, college graduates are not well prepared for
architecture, precision manufacturing, and success in the global economy.16 Gaps can
mining). Foundational skills are widely applicable, appear in the occupational skills needed in
and include skills such as critical thinking, certain industries and specific jobs, but are also
creativity, communication, team work and widespread in the foundational skills needed
project management. broadly across industries; over 80% of employers
said higher education programs should put
more attention on developing foundational
Exhibit 10
MINNESOTA JOB VACANCIES AND UNEMPLOYMENT CLAIMS BY OCCUPATION
Occupational Group (in order of least unemployment)
Vacancies1
1 - Life, Physical, and Social Science Occupations
Excess 10,000 2 - Protective Service Occupations
demand Skills mismatch
9,000 3 - Legal Occupations
4 - Community and Social Service Occupations
8,000 5 - Architecture and Engineering Occupations
20
6 - Arts, Design, Entertainment, Sports, and Media Occ
7,000
7 - Computer and Mathematical Occupations
19
6,000 8 - Personal Care and Service Occupations
9 - Healthcare Practitioners and Technical Occupations
5,000
10 - Farming, Fishing, and Forestry Occupations
18
4,000 11 - Education, Training, and Library Occupations
9 15 12 - Installation, Maintenance, and Repair Occupations
3,000 21
8 17 13 - Building and Grounds Cleaning and Maintenance Occu
7 14
2,000 11 14 - Business and Financial Operations Occupations
12 16
4 15 - Healthcare Support Occupations
5
1,000 6 13 22 16 - Management Occupations
12 3
10 17 - Transportation and Material Moving Occupations
0
0 2,000 4,000 6,000 8,000 10,000 28,000 18 - Food Preparation and Serving Related Occupations
19 - Office and Administrative Support Occupations
Unemployment claims2
Supply 20 - Sales and Related Occupations
Excess
meets 21 - Production Occupations
supply
demand
22 - Construction and Extraction Occupations
1 Vacancies by occupational group (Standard Occupational Classification) as of fourth quarter 2011
2 Unemployment claims by occupational group (Standard Occupational Classification) as of December 2011
SOURCE: Minnesota Department of Employment and Economic Development 10
15
McKinsey Global Institute “U.S. Jobs Survey” (2011), Manpower Group
16
Association of American Colleges and Universities, “How Should Colleges Prepare Students To Succeed in
Today’s Global Economy?” (January 2007), survey on four-year graduates
14skills including communication and critical vastly more effective skills market in Minnesota
thinking.17 Skill deficiencies have costs including with the following features:
remediation, reduced productivity, and limited
advancement potential. Greater transparency into the skills needed for
careers in Minnesota’s economy, as
In Minnesota, comparing job vacancies and
unemployment across occupational groups —— Employers communicate their skill needs
suggests considerable opportunities for helping directly to the higher education system.
people find in-demand positions through training
and placement (Exhibit 10): —— Students are systematically made aware
of employer skill needs, education options,
Several occupations—such as Healthcare and career options, so they can make
Practitioners and Technical Occupations and better choices as they progress through
Personal Care and Service Occupations— their education.
have more job vacancies than unemployment,
suggesting demand for certain skills Businesses becoming active partners with
outstripping supply. Other occupations—such higher education to help impart desired skills
as Construction and Extraction Occupations and experiences to students.
and Production Occupations—have more
unemployment than job vacancies, suggesting Greater transparency into the skills
supply of certain skills outpacing demand. Many possessed by students at different stages
occupations show relatively high numbers of both of their degrees or credentials, to enhance
job vacancies and unemployment, suggesting students understandings of their strengths
skill gaps or mismatches within an occupation and options throughout the education and
that prevent successful placement of industry- job-finding process; to aid higher education
tenured persons. While aggregate level data institutions’ identification of student needs
such as this make it difficult to draw actionable for additional training or remediation; and to
conclusions, gaining further understanding into improve employers’ matching job openings
the exact nature of skill gaps and mismatches with persons well prepared for success.
within occupations—whether they are traceable
to occupational skills, foundational skills, or other Increased activity and partnership between
factors—allows for better remedies. business and higher education in life-long
learning and upskilling efforts, adding to
Closing skill gaps is good for employers, the valuable skill base of adults already
employees, students, and regional economies. participating in the economy.
Employers benefit from having less unfilled
positions and more productive employees. Greater collective coordination and
Employees benefit from better ongoing investment across businesses, higher
employment, wage, and career prospects. education and communities in preparing our
Students benefit from greater success in students for successful futures.
finding quality, suitable positions and better
chances of advancement. (College students This emphasis on skills is not designed to flatten
cite preparing for a career or profession as a rich and nuanced educational experience into
the leading purpose of a college education.18 ) a single-dimensioned vocational training for
Minnesota benefits, becoming a more appealing all persons. It is intended to help our students
location for employers and students, and through navigate our educational system and economy,
productivity-driven growth. to help them find good jobs, to prepare them
for enduring career success, to enable their
The strategic vision of aligning academic offerings lifelong growth, and to strengthen our regional
with workforce needs is in essence a vision for a community in doing so.
17
Association of American Colleges and Universities and Hart Research Associates “Raising the Bar: Employers’
Views on College Learning in the Wake of the Economic Downturn” (2010) 1
18
College Board and Art & Science Group, LLC, “Student Poll Volume 6, Issue 2” (2008) 15Exhibit 11
AN ABSTRACT VIEW OF MINNESOTA’S RESEARCH AND INNOVATION ECOSYSTEM
Elements of Minnesota’s innovation ecosystem
Minnesota’s higher Minnesota’s businesses
education institutions form a key part of the
produce many forms of Community innovation ecosystem,
intellectual capital that especially core
nourish the innovation industries including
ecosystem including ▪ Business services
▪ Undergraduate (including corporate
students headquarters)
▪ Graduate and Higher ▪ Financial services and
professional students education Businesses insurance
institutions
▪ Consortia and centers ▪ Food and agribusiness
▪ Professors / consulting ▪ Healthcare, life sciences
▪ Sponsored research and biotechnology
▪ Intellectual property ▪ Innovation and
and publications technology
Government ▪ Manufacturing
▪ Mining and natural
resources
Strategy 2: Foster an ecosystem of Government plays multiple roles. It is often
research and innovation a direct funder of research and innovation
ventures. Government also sets tax policy,
Research and innovation require complex webs budgets, and laws that strongly impact
11
of relationships. Their “ecosystem” involves the ease or difficulty of innovation and
research and teaching institutions, businesses, commercialization within a region.
policies and policy makers, financiers,
entrepreneurs, and regional communities. To The regional community plays an important
heighten research and innovation output and part as well. Regions with appealing quality of
impact, the ecosystem’s functioning must life and strong cultures of innovation are able
be improved by building on its strengths and to attract, retain, and connect key research,
addressing its challenges (Exhibit 11). innovation, and entrepreneurial talent.
Within a research and innovation At the heart of Minnesota’s research and
ecosystem: innovation ecosystem is the University of
Minnesota. In 2010 UMN had nearly $800 million
Higher education plays a critical role, as a in R&D expenditures, ranking 8th among U.S.
nexus of new ideas, a center of learning, and a public universities and 13th among all U.S.
hub of powerful research infrastructure. universities. By R&D expenditures, UMN stands
in truly elite company, ahead of many well-known
Businesses also conduct research and institutions, including MIT, Yale, Berkeley, and
development. There are also critical roles for Harvard. UMN’s R&D ranking is even more
businesses large and small, entrepreneurs, notable in light of the fact that Minnesota as a
and venture capital in bringing innovations to state ranks 21st in population.
the marketplace.
16While R&D activity has been robust, commercialization from UMN research has also risen. A panel
of university commercialization experts noted, “the University of Minnesota [Office of Technology
Commercialization] has an outstanding track record of accomplishments that put it at the highest ranks
of university tech transfer offices.” 19 In late 2011, UMN launched “Minnesota Innovation Partnerships,”
or MN-IP, a pre-paid licensing agreement that greatly simplifies the R&D partnering process for the
university and businesses.
Minnesota is also home to the Mayo Clinic, another nationally pre-eminent research institution. With
a total of $555 million in funded science in 2010, the Mayo Clinic is an established leader in clinical
treatment and medical innovation.
Other institutions of higher learning are also present in Minnesota’s research and innovation ecosystem.
Critical applied research, specialty research, and real-world problem solving happens at MnSCU, many
private universities and other institutions. Furthermore, the state’s graduate and professional students,
who play a critical role in research and innovation, complete their undergraduate studies across the
spectrum of Minnesota institutions of higher learning.
A vision of fostering an ecosystem of research and innovation in Minnesota has
several concrete implications:
Building relationships among research and —— Further developing the region as a talent
innovation talent magnet for innovation talent including
researchers, graduate students and
—— Enhancing the web of relationships professional students.
among Minnesota researchers and
innovators: there is no substitute for Creating a supportive environment
personal relationships, exchange of ideas,
and powerful cross-fertilizations across —— Enacting tax policies and other laws that
disciplines. For example, the University increase the ease of research ventures,
of Minnesota’s Industrial Partnership business collaborations and new ventures.
for Research in Interfacial and Material
Engineering (iPRIME) brings researchers —— Attracting an increasing pool of
from over 40 companies together entrepreneurial talent and venture capital
with faculty members to work on pre- to support the commercialization of
competitive and nonproprietary research. innovative ideas.
—— Forming intentional R&D collaborations —— Building a culture and reputation for
among related institutions and businesses: innovation and entrepreneurship: being
among its higher education institutions and known nationally and internationally
businesses, Minnesota has concentrations as a region that values and welcomes
of expertise in food sciences, medical innovators and entrepreneurs is an
devices, financial services, and other important element of attracting and
areas. New collaborations among related retaining key talent over time.
institutions have the potential of leveraging
collective knowledge and assets towards
mutually beneficial ends.
19
From letter to UMN following review of Office of Technology Commercialization by peer tech transfer office
executives, 2010.
17This situation is by no means unique to Minnesota, and a recent report from the National Research
Council entitled “Research Universities and the Future of America” highlights ten recommendations.
They include ways of revitalizing the partnership between universities, state and federal government, and
business to improve university research and its applications; ways of strengthening institutions to enable
more productiviity; and ways of building a talent pipeline. These recommendations should also inform our
future plans. 20
Strategy 3: Form new collaborations A vision for collaboration among higher
across higher education to optimize education institutions would build upon existing
intellectual assets and efficiency efforts and relationships to achieve new levels
of intentionality, scale, and impact. Concrete
Minnesota’s higher education landscape features of such collaborations could include:
includes over 200 institutions. Historically, these
institutions have operated largely independently Greater leverage of system-wide intellectual
of one another, often competing for students assets. Minnesota’s 200+ institutions have
and resources. different specialties, program offerings and
focuses, ranging from theory to application to
Meeting the demands of the 21st century will generalist practices. Leveraging the strengths
require these institutions to operate more like a across the system in intentional program
well-coordinated fleet, instead of ships passing partnerships or more open cross-enrollment
in the night. While meaningful degrees of agreements could create additional benefits
independence and competition are desirable, for students, teachers and employers
the room for collaboration and collective success across the state. A promising example is the
is great. Through improved cost-sharing and nanotechnology partnership of UMN and
course planning the system can realize major MnSCU, which combines theoretical and
efficacy and productivity gains. applied strengths to create a program with
even greater relevance to students and the
Many meaningful collaborations already exist marketplace.
across several of Minnesota’s higher education
institutions. A partial listing of examples includes: Further system-wide leverage of operational
best practices and combined scale. While
UMN and MnSCU collaborate on many institutions may continue to compete to some
academic programs. degree for students and faculty, they are
generally not competitive in their back-office
The Associated Colleges of the Twin Cities, a operations. Within a system of 200 institutions
consortium of five private liberal-arts colleges and $7 billion of annual spend, there are likely
and universities, promote collaborative significant opportunities to further adopt
efforts such as cross-enrollment and joint best practices from other institutions or
purchasing. leverage their shared services, and to further
use the system-wide scale for efficiencies in
The Minnesota Higher Education Technology purchasing and elsewhere that would not be
Association joins Chief Information Officers available to institutions on their own.
of higher education institutions in pursuit
of educational excellence and operational Educational excellence through mission
efficiency through collaborative efforts and differentiation plus collaboration. Many
shared resources. institutions have broadened their offerings
to appeal to diverse student interests and
capture further market share. While such a
20
Source to the National Academies Press. www. nap.edu
18Exhibit 12
MINNESOTA HIGH SCHOOL GRADUATE ENROLLMENT AND COMPLETION OF 2-YEAR
AND 4-YEAR POST-SECONDARY DEGREES
100 high
Enrollment Pass req’d.
school
70 HS Grads1 intro classes
graduates 75% completion
45 HS grads 40 HS grads Graduation 36 HS
36 HS grads Grads2
Persistence 70%3 64% 89% 90%
▪ The primary loss points in the funnel are
– Between high school graduation and enrollment
– Between enrollment and gatekeeper completion
▪ While this does not track any one subset of schools, it is represen-
tative of the general trends students experience across Minnesota
1 While 70% of new undergraduates are recent high school graduates, 30% of enrollees are older students. For simplicity in presentation, these
other students are not included in figures above, however their advancement and completion rates once enrolled closely track the rates shown
2 Graduating within 150% time (e.g., completing 4-year programs within 6 years, and 2-year programs within 3 years)
3 Graduated in the spring and enrolled the following fall
Note: Based on a weighted average graduation rate in Minnesota of 51% calculated from IPEDS
SOURCE: IPEDS; Minnesota Office of Higher Education; team analysis
strategy has economic rationale for a single Strategy 4: Graduate more students
institution, it is suboptimal for a system 12
(or portfolio) of institutions. At the system Only half of the students who enroll in higher
level, specialization allows for institutions to education complete a degree in a timely manner.
serve certain functions with high degrees of This is detrimental to students, many of whom
excellence and efficiency, while the needs accumulate student debt but never fully realize
for diversity in offerings can be met by the benefits of a post-secondary degree. It
collaborative agreements across institutions. also reduces the impact of Minnesota’s higher
Within the state system, some program education investments, when students who
redundancies are needed on an ongoing begin higher learning do not complete their
basis to provide geographic access and programs (Exhibit 12).
choices for students. Nevertheless, well
executed, a program of mission differentiation Reasons why students don’t enroll in higher
plus collaboration could advance the entire education or complete a program of study tend to
system performance, conferring competitive fall into a few main categories of known barriers.
advantage over other regions. There are
of course challenges to organizing such Perceived and real financial barriers
differentiation and collaboration among
independent and partially competing Students can perceive financial barriers if they
organizations; however, a strong aspiration are without adequate information or guidance to
with the right leadership and incentives could understand the benefits versus costs of higher
drive major systemic improvements. education, the alternatives for funding affordable
higher education, or how to find and secure
19funding for education. Not understanding financial services; or meeting assignment and test
options or the processes to secure funding affects schedules. Many students do not have the social
many: half of students with private loans do not preparation or personal support networks (e.g.,
exhaust their options for federal funding, and 13% informed parents, friends and mentors) to help
do not apply for federal aid at all. 21 them make positive choices at the many decision
points arising through a program of higher
Real financial barriers include funding shortfalls, education on the path to completion.
schedule conflicts with needed work, or the
opportunity cost of forgoing earnings during Academic barriers to engaging in and
higher education. Escalating tuition at most completing higher education programs
schools is a barrier to enrollment and completion
for many students. Many students who do not enroll in higher
education feel that it is not to their tastes or
Social barriers related to navigating that they have a low probability of successfully
the higher education experience completing the academic requirements. Once in
an institution of higher education, many students
Programs of higher education have many struggle to satisfy their program’s introductory
mandatory processes and thresholds: completing or advanced requirements; 40% of Minnesota’s
applications and financial forms; registering for public higher education students require one or
courses; registering for health and other student more developmental courses. 22
Exhibit 13
DIFFERENCES IN HIGHER EDUCATION ENROLLMENT AND COMPLETION BY ETHNICITY
Minnesota has disparities between races in … and also disparities between races in
higher education enrollment … higher education completion
% of MN high school graduates enrolling directly % of enrollees completing a postsecondary
in MN higher education by race1 (excludes out of program, Minnesota (2010)1
state enrollment)
55 60 62
51 50 54
43
40 43
39
Asian White African Hispanic Native Asian White African Hispanic Native
American American American American
1 5-year average rates of Minnesota high school graduates enrolling directly in MN higher education, 2006-2010.The average total in-state
participation rate was 51%, with an additional 20% of MN high school graduates enrolling directly in higher education out of state
2 Completing 4-year program within 6 years times
SOURCE: Minnesota Office of Higher Education, IPEDS
14
21
The Project On Student Debt, “Private Loans: Facts and Trends” (July, 2011)
22
Minnesota State Colleges and Universities and the University of Minnesota,
“Getting Prepared: a 2010 report on recent high school graduates who took developmental/remedial courses”
20Enrollment and completion rates also differ across student groups, with achievement gaps visible
among students of different socio-economic or ethnic backgrounds (Exhibit 13).
A host of student support measures provide successful remedies to these barriers: financial aid
addresses real economic needs, while student guidance can address perceived financial barriers,
social, and academic issues. With known solutions to known needs, the challenge is largely one of
resources: securing enough student support capacity to help students in need in times of need.
A vision of graduating more students from Minnesota higher education has several
concrete features:
Students clearly understand the benefits and costs of higher education and are able to make fitting
choices about enrolling (or not) and selecting programs of study. Students understand financial aid
alternatives and are able to complete aid processes.
Students graduate high school with the skills needed to engage in an appropriate form of higher
education if they so choose.
Best practices in student support are leveraged across the state higher education system, rapidly
identifying and addressing student needs.
Student support resources are brought to bear especially for those students most in need of help,
significantly addressing achievement gaps based on socio-economic or ethic background.
Major strides in affordability and flexibility provide students of different backgrounds and life
circumstances (including adult learners) feasible pathways to completing a high quality post-
secondary education.
© Photo courtesy of Minnesota State Colleges and Universities. Photo used with permission.
21You can also read