Highlights from the GALAH Survey - Gayandhi De Silva AAO - Macquarie University
←
→
Page content transcription
If your browser does not render page correctly, please read the page content below
Highlights from the
 GALAH Survey

      Gayandhi De Silva
   AAO – Macquarie University

         on behalf of
   The GALAH Collaboration

                      Near-UV (CUBES) Workshop
                                   3 -5 Feb 2021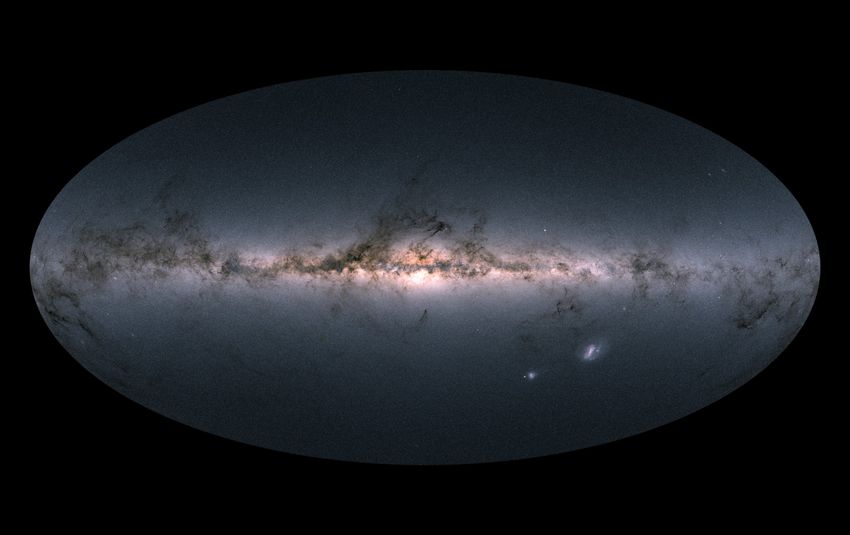
Survey Summary
Long term goal of GALAH is to identify chemically similar
groups of stars in the Galactic disk, which are most likely
THE G
GALACTIC
ancient disrupted clusters, to decipher the star formation, ARCH
migration and minor-merger history of the Milky Way.
§ GALactic Archaeology with HERMES SVEN BUDER (MP
& TH
§ High-resolution spectra of 1 Million stars
§ Stellar parameters, radial velocity
§ Abundances for about 30 elements
AA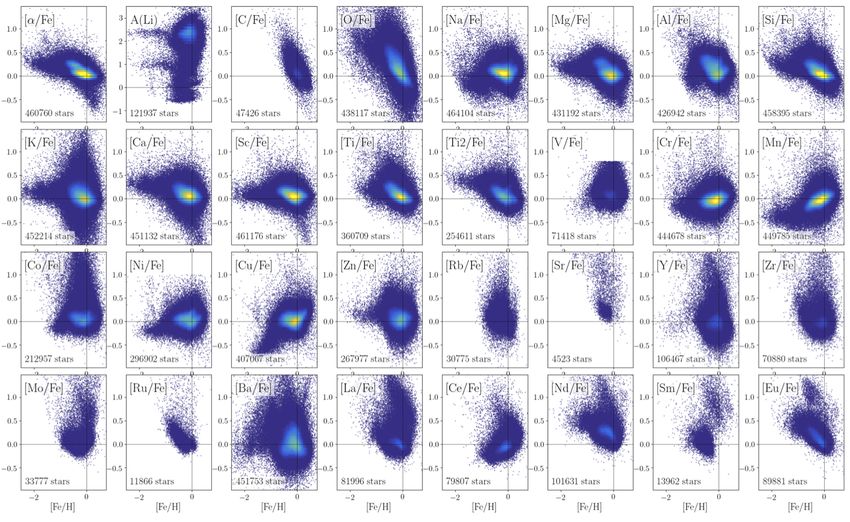
Simultaneous observation of 392 targets
                                          Blue
                                          4718-4903Å

                                          Green
                                          5649-5873Å

                                          Red
                                          6481-6739Å

                                          IR
                                          7590-7890Å
The HERMES spectrograph
provides spectra in four wavelength
regions at R ~ 28,000, allowing us to
measure the abundances of:
Li, C, O, Na, Mg, Al, K, Si, Ca,
Ti, Sc, V, Cr, Mn, Fe, Co, Ni,
Cu, Zn, Rb, Sr, Y, Zr, Ru,
Ba, La, Ce, Nd and Eu.
Survey
Sample
Survey
Sample
GALAH DR3 (Buder et al. 2020)
                         • GALAH DR3: 600,000+ spectra, 387 nights of HERMES data
                                             T
                                           HE one-dimensional
                         • catalogues and reduced                         L
                                                    EGACY OF spectra available at AAO                        GALAH
                           Data Central (datacentral.org.au)
                         • main catalogue: stellar parameters, elemental abundances
                         • VACs: ages, mass, kinematics, dynamics, binaries
2016: Martell, SB+                                                                        2018: SB+                                                    2020: SB+
                         GALAH DR1                                                        GALAH DR2                                                        GALAH DR3
              0 10680 Spectra                                                  0 342682 Spectra               103                               0 645443 Spectra

              1                                                                1                                                                1                             103
                                                   Nr. Spectra

                                                                                                                    Nr. Spectra

                                                                                                                                                                                    Nr. Spectra
log g [dex]

                                                                 log g [dex]

                                                                                                                                  log g [dex]
              2                              101                               2                                                                2
                                                                                                              102
                                                                                                                                                                              102
              3                                                                3                                                                3

              4                                                                4                                                                4
                                                                                                              101                                                             101
              5                                                                5                                                                5
                                             100
                  8000      6000      4000                                         8000     6000      4000                                          8000     6000      4000
                            Te↵ [K]                                                         Te↵ [K]                                                          Te↵ [K]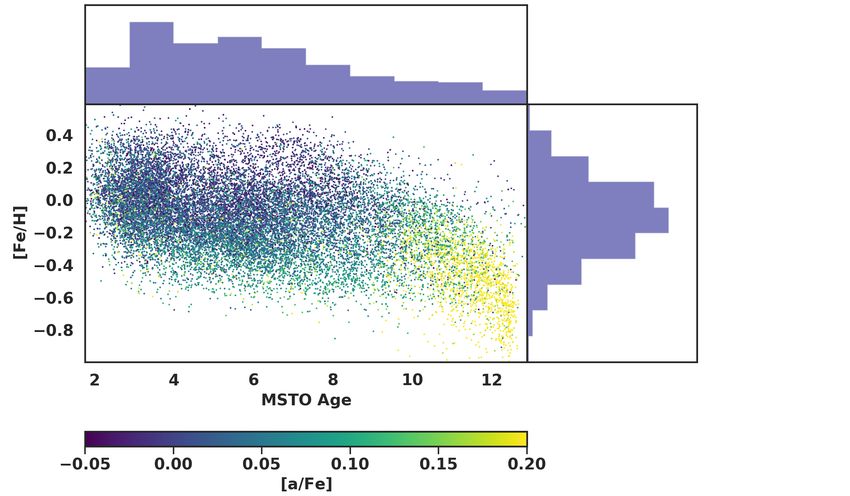
Milky Way Stellar “DNA”
Stellar ages…

GALAH-DR3, APOGEE (Ness et al.), LAMOST (Ho et al.)
Survey Science
Galactic structure
§ Lin: Temporal chemical enrichment of Galactic disk
§ Buder: Age, Abundance and Kinematic inventory
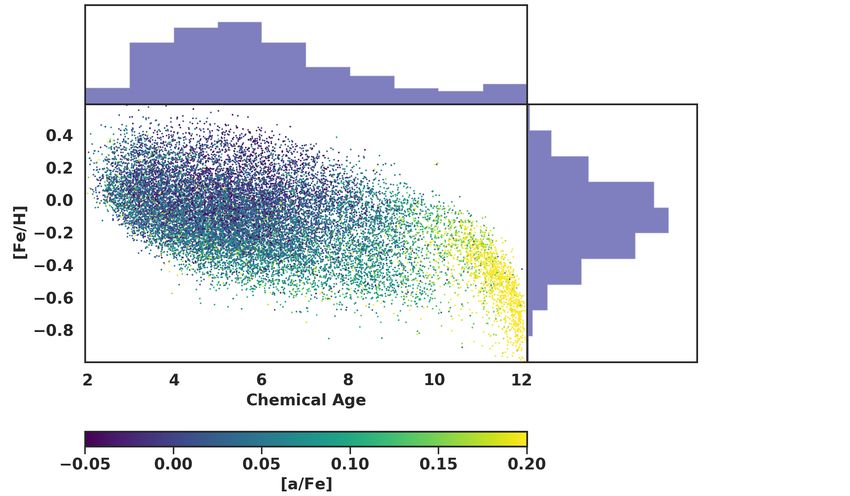
§ Hayden: Chemical clocks
§ Duong: properties of the Galactic disc(s)
§ Sharma: Abundance dependence on age/metallicity.
Clusters and groups
§ Gao: abundance trends in M67 using NLTE modeling
§ Kos: non-existence of high-latitude clusters
§ Kos: Chemical homogeneity of the Orion Complex
§ Spina: Tracing the Galactic disk with Open clusters
Peculiar stars
§ Cotar: Characterizing emission line stars
§ Cotar: carbon enhanced and CEMP candidates
§ Simpson: luminous supergiants in MCs and bridgeregions are white, while absorption profiles are coloured with progressively darker colours, depending on their depth.
sequence of spectra along the red giant branch with indicated values of surface gravity. In both cases only spectra with Solar metallicity are plotted. Continuum
shows a sequence of main-sequence spectra with different effective temperatures, indicated on the vertical axis. Similarly, the top part of each panel is a
Figure 7. Cross-sections through the multidimensional data-cube of observed median spectra for the four spectrograph arms. The bottom part of each panel
8
T. Zwitter et al.
Survey Science
Multiplicity
§ Zwitter: high accuracy RVs and library of stellar templates
MNRAS 000, 1–?? (2018)
§ Cotar: Unresolved triple Sun-like stars
§ Traven: Properties of FGK binary stars
Lithium
§ Gao: Li depletion from Spite plateau and beyond
§ Zerjal: Li-strong KM dwarfs
§ Simpson: Accreted stars in the Spite plateau
§
1172
Martell: Formation channels for Li-rich giants
J. Bland-Hawthorn et al.
Galactic dynamics
§ Hayden: Chemo-dynamics of solar neighborhood
§ Khanna: Ridges, arches and vertical waves
§ Simpson: co-orbiting stars and chemical tagging
Downloaded from https://acad
§ Khanna: Velocity fluctuations with RC stars
§ Bland-Hawthorn: Dissecting the stellar disc
√
Figure 5. The frequency ratio !R /!z versus 2Jz for orbits calculated in a
realistic Galactic potential; the ratio for most stars lies in the range 0.5–0.7.GALAH in context of CUBES • Blue wavelengths not covered in HERMES • Missing spectral features, elemental abundances • Light elements (Be, C, N, O) and heavy elements (r-process) • Characterizing Extremely Metal Poor stars • GALAH can identify EMP ~ - 3.0 but ambiguous below • Over 100 EMP candidates to-date (Zucker, private comm.) • Binaries, variables and “odd-balls” follow-up • Examine emission lines and features in UVB wavelengths
Figure 8. Left: The age-metallicity relation for MSTO stars determined from isochrone ages. R
ages.
• Stellar ages via chemical clocks
• Accurate measurements of C/N ratio
• Accurate measurement of s/r-process ratios
• Compare against asteroseismsic ages for giants
• Expand to all giants and dwarfs
• CUBES observations as a training set
• Heavy element abundances for subsample of targets
• Compare and calibrate the larger samples
• Larger variety of elements at higher precision A BUNDANCE RELATIONS 1
age gradient but a weak [Fe/H] gradient. Ni, Cr, Cu, an
Mn (45 < Hayden et al. 2020
Figure
✓ < 1359. The age-abundance
) have trends for
a strong [Fe/H] MSTO using
gradient. The
are iron-peak elements and are produced by SNe Ia. Th
strong gradient with [Fe/H] suggest that the contribution o
tion can lead to age errors on the
SNeorder
Ia to of
the20% for MSTO
production starselements
of these (see is with
more [Fe/H].
than tha
e.g., Thoul et al. 1994; Dotter et al. 2017; Liu et al. 2019), becoming
for Fe, which is about 50% Kobayashi et al. (2020). will be relatN
preferentially larger for older (135
stars. Additionally,
< ✓ < 180 ) has for MSTO stars in age gradient.
a mild negative age determin
Ba, Y
particular, atomic di↵usion can cause abundance underestimates
V, K, Zr, and Co (180 < ✓ < 270 ) have a negative of surfaceage andanb
⇠ 0.1 dex relative to the bulk [Fe/H]
composition.
gradient.ThisAmongmeans thatelements
these atomic Ba andsystematic
Y are know er
di↵usion, if not taken into account, can cause an error in our cal-
to be elements produced by the s-process in AGB stars. A but is in gen
ibration sample both in the age thedetermination
contribution ofand AGB in stars
the chemical important
increases with time, the abun as
abundance relations used to derive the ages for the rest of the sam-
dance of these elements is expected to have a negative ag mations.
ple. The version of the PARSEC isochrones
gradient. The lastusedgroup
in thisofanalysis
elementsdoare the ones lying be
take atomic di↵usion into account,
tweenand 270weHow Gaia has changed
GALAH
- a view on stellarThank You!
parameters and chemodynamics -
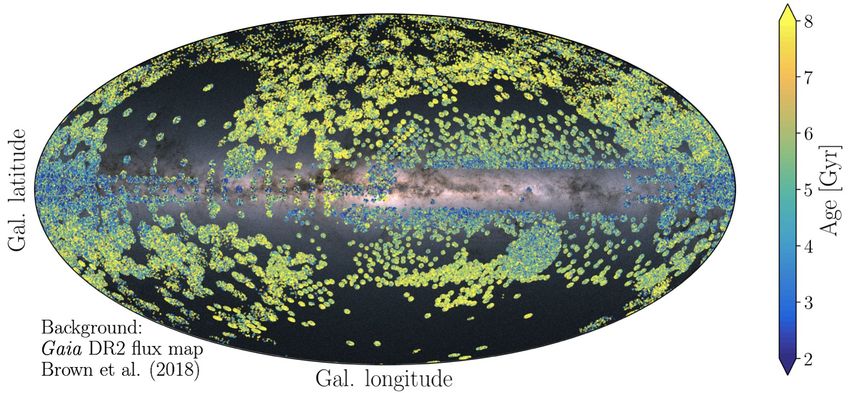
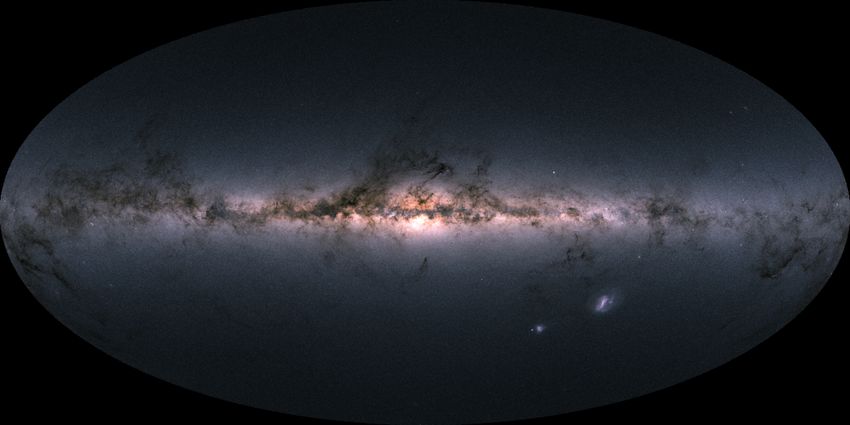
Figure: Gaia DR2 flux map
Sven Buder (MPIA, @astro_sven) Gaia Collaboration, Brown+2018You can also read