HIV Continuum of care - Monitoring implementation of the Dublin Declaration on partnership to fight HIV/AIDS in Europe and Central Asia: 2020 ...
←
→
Page content transcription
If your browser does not render page correctly, please read the page content below
SPECIAL REPORT

     HIV Continuum of care
      Monitoring implementation of the Dublin
Declaration on partnership to fight HIV/AIDS in
 Europe and Central Asia: 2020 progress report

                               www.ecdc.europa.eu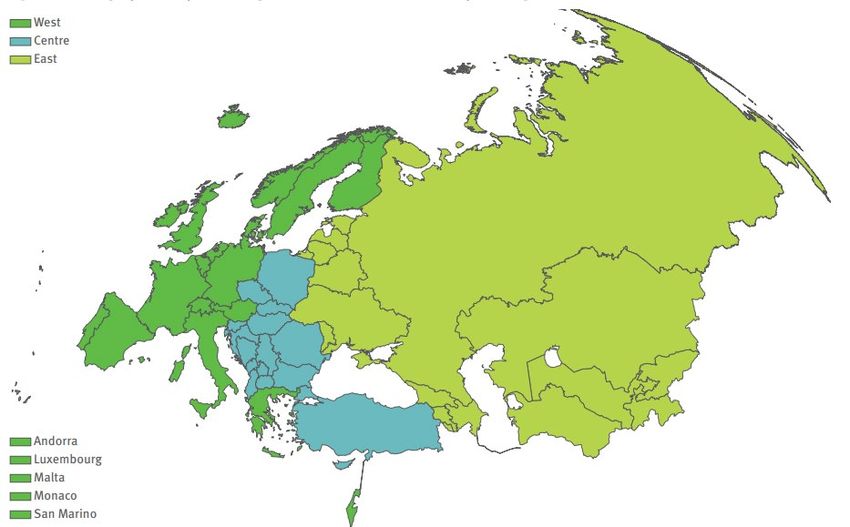
ECDC SPECIAL REPORT

HIV Continuum of care
Monitoring implementation of the Dublin Declaration on partnership to
fight HIV/AIDS in Europe and Central Asia: 2020 progress report
This report of the European Centre for Disease Prevention and Control (ECDC) was coordinated by Teymur Noori with support from
Jasleen Singh.
This report is one in a series of thematic reports based on information submitted by reporting countries in 2020 on monitoring
implementation of the Dublin Declaration on Partnership to Fight HIV/AIDS. Other reports in the series can be found on ECDC’s
website at: https://www.ecdc.europa.eu/en/monitoring-implementation-dublin-2020.
Draft versions of the thematic reports were produced under contract ECDC/2017/007 by Cheryl Gowar, Katy Sharrock, Rosalie
Hayes, Alison Brown and Valerie Delpech.
Acknowledgements
ECDC would like to acknowledge the support and guidance provided by members of the Dublin Declaration advisory group.
Members of the advisory group include Kristi Ruutel (Estonia), Daniela Rojas Castro (France), Otar Chokoshvili (Georgia), Caroline
Hurley (Ireland), Silke David (Netherlands), Arild Johan Myrberg (Norway), Isabel Aldir (Portugal), Sladjana Barros (Serbia), Irena
Klavs (Slovenia), María Vázquez (Spain), Daniel Simões (Coalition Plus), Sini Pasanen (HivFinland), Dorthe Raben, Jordi Casabona
(INTEGRATE), Zoran Dominković (Iskorak), Thomas Seyler (EMCDDA), Taavi Erkkola (UNAIDS), Giorgi Kuchukhidze (WHO
Regional Office for Europe).
ECDC would also like to thank the following people for providing data through the Dublin Declaration questionnaire: Roland Bani,
Arian Boci (Albania); Philipp Bretschneider, Martin Schmidinger (Austria); Esmira Almamadova (Azerbaijan); Inna Karaban, Anna
Rusanovich, Svetlana Sergeenko (Belarus); Frederic Denauw, Jessika Deblonde, Dominique Van Beckhoven, Wim Vanden Berghe
(Belgium); Mariya Tyufekchieva (Bulgaria); Tatjana Nemeth-Blazic, Josipa Lovorka, Josip Begovac, Sanja Belak Škugor, Dunja Skoko
Poljak, Iva Jovović, Zoran Dominković (Croatia); Ioannis Demetriades, Anna Demetriou, Christos Krasidis (Cyprus); Anna Kubatova,
Ivo Procházka (Czechia); Heidi Slavin, Josefine Skou Jakobsen, Emmett Minor (Denmark); Kristi Rüütel, Anne Murd, Annika Kalinina,
Liilia Lõhmus, Liis Lemsalu, Maris Salekešin, Piret Viiklepp, Sigrid Vorobjov, Svetlana Ovsjannikova (Estonia); Henrikki Brummer-
Korvenkontio, Kirsi Liitsola, Jukka Ollgren, Pia Kivelä, Sini Pasanen (Finland); Florence Lot, Aminata Sarr (France); Maia Tsereteli,
Nino Tsereteli (Georgia); Ulrich Marcus, Silke Klumb, Ursula von Rüden, Dirk Meyer, Binod Mahanty (Germany); Vasilios Raftopoulos
(Greece); Maria Dudas (Hungary); Guðrún Sigmundsdóttir, Einar Thor Jonsson (Iceland); Caroline Hurley, Moira Germaine, Owen
Brennan, Derval Igoe, Kate O’Donnell, Melissa Brady, Sarah Jackson (TB), Fiona Lyons, Eamon Keenan, Brian Galvin, Sean Millar,
Sinéad Browne, Ronan Kielt, Stephen O’Hare, Adam Shanley, Erin Nugent, Ann Mason, Cillian Flynn, Jess Sears, Rowan Golden
(Ireland); Francesco Maraglino, Anna Caraglia, Lella Cosmaro (Italy); Бауыржан Байсеркин, Ганина Л.Ю., Мусина Ж.Ж.,
Касымбекова С.Ж, Сайрамбекова Г.М. (Kazakhstan); Laura Shehu (Kosovo1); Aybek Bekbolotov (Kyrgyzstan); Šarlote Konova
(Latvia); Irma Caplinskiene, Arunas Kepezinskas (Lithuania); Pierre Weicherding, Sandy Kubaj (Luxembourg); Jackie Melillo (Malta);
Svetlana Popovici (Moldova); Alma Cicic, Sanja Sisovic (Montenegro); Silke David, Cor Blom (Netherlands); Arild Johan Myrberg,
Harald Lislevand, Robert Whittaker, Øivind Nilsen, Hilde Kløvstad (Norway); Magdalena Rosińska, Marta Niedźwiedzka-Stadnik,
Karolina Zakrzewska (Poland); Isabel Aldir, Joana Bettencourt, Ana Fernandes, Maria João Aleixo, Helena Cortes Martins, Cristina
Mora, Filipa Barbosa, Ricardo Fernande (Portugal); Mariana Mardarescu, Adrian Abagiu, Marieta Iancu, Sanda Vintilă, Claudiu
Şchiopu, Alexandra Mărdărescu, Valentina Ştefan, Fidelie Kalambayi, Geanina Surdu (Romania); Andrea Gaultieri (San Marino); Jan
Mikas (Slovakia); Irena Klavs, Miran Šolinc (Slovenia); Julia Del Amo Valero, Ramón Espacio (Spain); Charlotte Bjorkenstam, Malin
Falknert (Sweden); Axel J. Schmidt (Switzerland); Алиджон Солиев, Пулод Джамолов (Tajikistan); Emel Özdemir Şahin (Turkey);
Ihor Kuzin, Nadiia Semchuk (Ukraine); Adamma Aghaizu, Rosalie Hayes (United Kingdom).
ECDC would like to thank the operational contact points for HIV surveillance from EU/EEA Member States and the national HIV/AIDS
surveillance focal points from other countries of the WHO European Region for making available HIV/AIDS surveillance data.
ECDC would like to thank EMCDDA and UNAIDS for harmonising their monitoring systems with ECDC and making available country-
reported data for the purposes of monitoring the Dublin Declaration. ECDC would also like to thank the WHO Regional Office for
Europe for jointly coordinating HIV surveillance in the WHO European Region.
Suggested citation: European Centre for Disease Prevention and Control. Continuum of HIV care. Monitoring implementation of the
Dublin Declaration on partnership to fight HIV/AIDS in Europe and Central Asia: 2020 progress report. Stockholm: ECDC; 2021
Stockholm, August 2021
ISBN 978-92-9498-544-6
doi: 10.2900/816839
Catalogue number: TQ-06-21-023-EN-N
© European Centre for Disease Prevention and Control, 2021

Cover picture: iStock
Reproduction is authorised, provided the source is acknowledged.

1
 This designation is without prejudice to positions on status, and is in line with UNSC 1244 and the ICJ Opinion on the Kosovo
Declaration of Independence.

ii

ECDC SPECIAL REPORT                                                             Dublin Declaration 2020 progress report - Continuum of HIV care

Contents
Abbreviations ................................................................................................................................................ v
Executive summary ........................................................................................................................................1
2020 at a glance ............................................................................................................................................2
Introduction ..................................................................................................................................................3
Methods ........................................................................................................................................................5
Results..........................................................................................................................................................8
    Data availability ........................................................................................................................................8
    Data sources ............................................................................................................................................9
    Accounting for out-migration, deaths, and loss to follow up ..........................................................................9
Continuum of HIV care ................................................................................................................................. 11
    Stage 1. Estimated number of people living with HIV ................................................................................. 11
    Stage 2. Number of people living with diagnosed HIV ................................................................................ 12
    Stage 3. Number of people diagnosed who are on treatment ...................................................................... 13
    Stage 4. Viral suppression among people living with HIV on treatment ........................................................ 14
    Viral suppression among all people living with HIV ..................................................................................... 15
    Progress over time .................................................................................................................................. 16
Key populations ........................................................................................................................................... 18
    Men who have sex with men (MSM) ......................................................................................................... 18
    People who inject drugs (PWID)............................................................................................................... 21
    Migrants ................................................................................................................................................ 23
    Sex workers ........................................................................................................................................... 25
    Prisoners................................................................................................................................................ 27
The estimated number of people with transmissible levels of HIV virus ............................................................. 30
Concluding remarks and priorities for action ................................................................................................... 31
    Reporting of data .................................................................................................................................... 31
    Overall progress in the continuum of care ................................................................................................. 31
    Key populations ...................................................................................................................................... 32
    Limitations ............................................................................................................................................. 32
    Conclusion ............................................................................................................................................. 33
References .................................................................................................................................................. 34
Annexes ...................................................................................................................................................... 35

Figures
Figure 1. Pictorial explanation of the UNAIDS 90-90-90 targets ..........................................................................3
Figure 2. Continuum of HIV care as envisaged by the 90-90-90 UNAIDS targets for 2020 .....................................4
Figure 3. Geographical/epidemiological division of the WHO European Region ...................................................6
Figure 4. Changes in data availability for different stages of the HIV continuum of care in Europe and Central Asia
in 2016, 2018 and 2020.................................................................................................................................. 8
Figure 5. Percentage of all people living with HIV who know their status in 45 countries of Europe and Central Asia,
reported in 2020 .......................................................................................................................................... 12
Figure 6. Percentage of all people living with diagnosed HIV who are on treatment for 43 countries of Europe and
Central Asia, reported in 2020 ....................................................................................................................... 14
Figure 7. Percentage of people on treatment reaching viral suppression for 40 countries of Europe and Central
Asia, reported in 2020 .................................................................................................................................. 15
Figure 8. Percentage of all people living with HIV who know their status, are on treatment and are virally
suppressed in 40 countries across Europe and Central Asia, reported in 2020 .................................................... 16
Figure 9. Proportion of countries which have met/exceeded global targets in Europe and Central Asia, reported in
2016, 2018 and 2020 ................................................................................................................................... 17
Figure 10. Continuum of HIV care (substantive), overall and by WHO sub-region, reported in 2020, and comparison
between data reported in 2018 and 2020 ....................................................................................................... 18
Figure 11. Number of countries reporting data for different stages of the HIV continuum of care for men who have
sex with men (MSM), Europe and Central Asia, reported in 2016, 2018 and 2020 .............................................. 19
Figure 12. 90-90-90 and overall viral suppression among MSM living with HIV in European and Central Asian
countries, reported in 2020 ........................................................................................................................... 20
Figure 13. 90-90-90 and overall viral suppression among MSM living with HIV in European and Central Asian
countries, reported in 2020 ........................................................................................................................... 21

                                                                                                                                                               iii
Dublin Declaration 2020 progress report - Continuum of HIV care ECDC SPECIAL REPORT Figure 14. Number of countries reporting data for different stages of the HIV continuum of care for people who inject drugs (PWID), Europe and Central Asia, reported in 2016, 2018 and 2020 ............................................... 21 Figure 15. 90-90-90 and overall viral suppression among PWID living with HIV in European and Central Asian countries, reported in 2020 ........................................................................................................................... 22 Figure 16. . Comparison of the continuum of HIV care for PWID against the national continuum for all people living with HIV, Europe and Central Asia, reported in 2020 ....................................................................................... 23 Figure 17. Number of countries reporting data for different stages of the HIV continuum of care for migrants, Europe and Central Asia, reported in 2016, 2018 and 2020 .............................................................................. 23 Figure 18. 90-90-90 and overall viral suppression among migrants living with HIV in European and Central Asian countries, reported in 2020 ........................................................................................................................... 24 Figure 19. Comparison of the continuum of HIV care for migrants against the national continuum for all people living with HIV, Europe and Central Asia, reported in 2020 .............................................................................. 25 Figure 20. Number of countries reporting data for different stages of the HIV continuum of care for sex workers, Europe and Central Asia, reported in 2018 and 2020 ...................................................................................... 26 Figure 21. . 90-90-90 and overall viral suppression among sex workers living with HIV in European and Central Asian countries, reported in 2020 .................................................................................................................. 26 Figure 22. Comparison of the continuum of HIV care for sex workers against the national continuum for all people living with HIV, Europe and Central Asia, reported in 2020 .............................................................................. 27 Figure 23. Number of countries reporting data for different stages of the HIV continuum of care for prisoners, Europe and Central Asia, reported in 2018 and 2020 ....................................................................................... 28 Figure 24. 90-90-90 and overall viral suppression among prisoners living with HIV in European and Central Asian countries, reported in 2020 .......................................................................................................................... 29 Figure 25. Comparison of the continuum of HIV care for prisoners against the national continuum for all people living with HIV, Europe and Central Asia, reported in 2020 .............................................................................. 30 Figure 26. Distribution of people with transmissible levels of virus, by WHO sub-region, and Europe and Central Asia overall, reported in 2020........................................................................................................................ 31 Tables Table 1. Consensus definitions for monitoring continuum of HIV care during Dublin Declaration monitoring 2020 ...5 Table 2. Number of countries reporting data on all four stages of the continuum of care in 2016, 2018, 2020 Error! Bookmark not defined.8 Table 3. Data sources for estimated number of people living with HIV in Europe and Central Asia, reported in 2020 ......9 Table 4. Exclusion of out-migration, deaths and loss to follow-up of people living with HIV from continuum data, Europe and Central Asia, reported in 2020 ................................................................................................... 10 Table 5. Estimated number of people living with HIV: countries in the West, Centre and East sub-regions, reported in 2020 ...................................................................................................................................................... 11 Table 6. Number and percentage of people living with HIV with diagnosed and undiagnosed HIV infection for 45 countries in Europe and Central Asia, reported in 2020 ................................................................................... 12 Table 7. Number and percentage of people living with diagnosed HIV who are on treatment for 43 countries in Europe and Central Asia, reported in 2020 ..................................................................................................... 13 Table 8. Number and percentage of people on treatment who are virally suppressed for 40 countries across Europe and Central Asia, reported in 2020 ................................................................................................................ 14 Table 9. Number and percentage of people living with HIV who are virally suppressed in 40 countries of Europe and Central Asia, reported in 2020 ................................................................................................................ 16 iv
ECDC SPECIAL REPORT                                     Dublin Declaration 2020 progress report - Continuum of HIV care

Abbreviations
AIDS                  Acquired immunodeficiency syndrome
ART                   Antiretroviral therapy
CoC                   Continuum of Care
ECDC                  European Centre for Disease Prevention and Control
EEA                   European Economic Area
EU                    European Union
HIV                   Human immunodeficiency virus
MSM                   Men who have sex with men
PLHIV                 People living with HIV
PrEP                  Pre-exposure prophylaxis
PWID                  People who inject drugs
TESSy                 The European Surveillance System
UNAIDS                Joint United Nations Programme on HIV/AIDS
WHO                   World Health Organization

                                                                                                                      v
ECDC SPECIAL REPORT Dublin Declaration 2020 progress report - Continuum of HIV care
Executive summary
• In 2020, 40 out of 55 countries in Europe and Central Asia provided the latest available data on all four
stages of the continuum of HIV care (compared to 34 countries in 2018). A total of 45 countries were able to
provide data for at least two consecutive stages of the continuum of HIV care (compared to 42 in 2018).
• In 2020, using data from countries able to provide at least two consecutive stages of the continuum, the
overall performance of the European and Central Asian region against the global 90-90-90 targets is 82% of
all PLHIV with HIV diagnosed, 67% of those diagnosed with HIV on treatment and 90% of those on
treatment virally suppressed. More progress is needed to meet the substantive target of 73% of all PLHIV
being virally suppressed, with performance for the overall region at 50% (based on the countries that
submitted data for all four stages of the continuum).
• Substantial variation exists for each element of the continuum, both between and within European and Central
Asian sub-regions. Overall, the West sub-region has met all three of the global 90-90-90 targets, with 90% of all
PLHIV diagnosed, 93% of people living with diagnosed HIV on treatment, and 93% of those on treatment virally
suppressed. Overall, the Centre sub-region is performing at 87%, 78% and 81% and the East sub-region is
performing at 78%, 50%, and 87% respectively. The West sub-region, performing at 78% overall, has also met
the global substantive target of having 73% of all PLHIV virally suppressed, while the Centre and East sub-
regions are at 55% and 33% respectively and still have a great deal of overall progress to make.
• Based on information from the 34 countries that reported all four stages of the continuum in both 2018 and
2020, there has been some progress towards meeting the global substantive targets. Overall, for these
countries, in 2020, 82% of all PLHIV were diagnosed, 55% of all PLHIV were on treatment and 49% of all
PLHIV were virally suppressed. This compares to 80%, 51% and 43% respectively in 2018. Each sub-region
also showed improvements in the outcomes for the continuum of care in 2020 compared to 2018. The
greatest improvement occurred in the East sub-region in the proportion of all PLHIV who are virally
suppressed, with an increase from 26% in 2018 to 33% in 2020 among the 10 countries in the East sub-
region able to report data in both years.
The number of people with transmissible levels of virus can be calculated by adding the number of PLHIV
who are estimated to be undiagnosed, diagnosed but untreated and treated but not virally suppressed. Using
data from the countries that provided all four stages of the continuum, this is estimated to be 1 112 593
PLHIV in those reporting countries, or equivalent to 50% of all PLHIV.
• Of the people living with transmissible levels of virus in 2020, 35% were estimated to be undiagnosed, 54%
were estimated to be diagnosed but untreated and 11% were estimated to be on treatment but with an
unsuppressed viral load. This indicates that the greatest impact in reducing the number of people with
transmissible levels of virus could be achieved through rapid and sustained scale-up of treatment, along with
widespread implementation of combination prevention, including further efforts to increase HIV testing.
1Dublin Declaration 2020 progress report - Continuum of HIV care ECDC SPECIAL REPORT
2020 at a glance2
Region or sub- Status 2020 target 2020 result Global target met?
region
European and Diagnosed (n=45) 90% 82%
Central Asian On antiretroviral therapy (ART) 90% 67%
Region (n=43)
Virally suppressed (n=40) 90% 90%
Viral suppression of all PLHIV 73% 50%
(n=40)
West sub-region Diagnosed (n=21) 90% 90%
On ART (n=20) 90% 93%
Virally suppressed (n=18) 90% 93%
Viral suppression of all PLHIV 73% 78%
(n=18)
Centre sub- Diagnosed (n=12) 90% 87%
region On ART (n=11) 90% 78%
Virally suppressed (n=11) 90% 81%
Viral suppression of all PLHIV 73% 55%
(n=11)
East sub-region Diagnosed (n=12) 90% 78%
On ART (n=12) 90% 50%
Virally suppressed (n=11) 90% 87%
Viral suppression of all PLHIV 73% 33%
(n=11)
Met or exceeded target Within 10% of meeting target Target not met
2
For each stage of the continuum, countries are included where they were able to provide two consecutive stages in order to
calculate a percentage to measure against the 90% target (‘n’ indicates the number of countries that were included in the
calculation for each stage.)
2ECDC SPECIAL REPORT Dublin Declaration 2020 progress report - Continuum of HIV care
Introduction
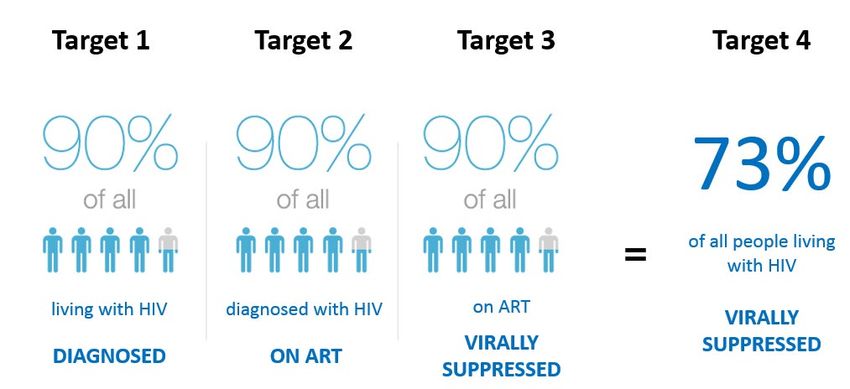
The 90-90-90 targets were established in 2014 by the Joint United Nations Programme on HIV/AIDS (UNAIDS).
The aim was that by 2020 90% of all people living with HIV would be diagnosed, 90% of those diagnosed would
be receiving treatment and 90% of those receiving treatment would achieve viral suppression 3 (Figure 1). This
translates to a target of 73% viral suppression among all people living with HIV (PLHIV). UNAIDS’ modelling
suggests that achieving these targets by 2020 will enable the world to meet the Sustainable Development Goal of
eliminating the AIDS epidemic by 2030 (SDG 3).
Figure 1. Pictorial explanation of the UNAIDS 90-90-90 targets
ART – antiretroviral therapy
The continuum of HIV care is a conceptual framework that provides a snapshot of critical stages in achieving viral
suppression among PLHIV. Achieving a high rate of viral suppression among PLHIV ensures a normal life
expectancy, a better quality of life and prevention of onward transmission of HIV. The framework also enables
countries to monitor the effectiveness of specific areas of their HIV response. The sequential nature of the stages
in the continuum indicates where countries can focus their efforts and which programmes and activities require
improvement.
This report focuses on data findings on the continuum of HIV care submitted by countries in Europe and Central
Asia for the 2020 round of reporting on implementation of the Dublin Declaration on Partnership to Fight HIV &
AIDS in Europe and Central Asia. In this report, the continuum of care is expressed in two ways (Box 1). The
‘global substantive targets’ are defined as the percentages for each stage of the continuum in relation to all PLHIV,
making 90-81-73 the target (Figure 2). The global 90-90-90 targets are assessed as percentages of the previous
stage of the continuum.
Box 1 – Continuum definition
Global 90-90-90 target: each stage of the continuum is presented as a percentage of the previous stage
of the continuum – target 90%-90%-90%
Global substantive target: each stage of the continuum is presented as a percentage of the total number
of people living with HIV – target 90%-81%-73%
3
UNAIDS. 90-90-90 An ambitious target to help end the AIDS epidemic. Geneva: UNAIDS; 2014.
3Dublin Declaration 2020 progress report - Continuum of HIV care ECDC SPECIAL REPORT
Figure 2. Continuum of HIV care as envisaged by the 90-90-90 UNAIDS targets for 2020
100%
100%
90%
90%
81%
80% 73%
70%
60%
50% 90%
90% 90% 90%
40%
30%
20%
10%
0%
Living with HIV Diagnosed with HIV On ART Virally suppressed
4ECDC SPECIAL REPORT Dublin Declaration 2020 progress report - Continuum of HIV care
Methods
Between February and August 2020, a European Centre for Disease Prevention and Control (ECDC) questionnaire
was used to collect data to monitor implementation of the 2004 Dublin Declaration. 4 The questionnaire was
disseminated to the 55 countries that are part of the WHO European Region via an online survey. Countries were
asked to report available data for their entire population of PLHIV, as well as key populations including men who
have sex with men (MSM), people who inject drugs (PWID), migrants (defined as persons born abroad) and other
groups that countries could identify as important in their setting.
The survey asked countries to provide their latest estimates of the number and proportion of people at each stage
of a four-stage continuum, as per the published European standard for monitoring the continuum of care. 5 The
definitions for each of the four stages are provided in Table 1. 6
Table 1. Consensus definitions for monitoring the continuum of HIV care during Dublin Declaration
monitoring 2020
Stage 1: Total estimated number of people living with HIV in the country
The total estimated number should be based on an empirical modelling approach, using the ECDC HIV
Modelling Tool 7, Spectrum 8 or any other empirical estimate. The estimate should include diagnosed
and undiagnosed people.
Stage 2: Number/percentage of above (estimated number of people living with HIV in the
country) ever having been diagnosed
The number should include all new HIV or AIDS diagnoses. It should also include those people who
are in care and those who have not been linked to care.
Stage 3: Number/percentage of above (estimated number of people living with HIV in the
country, ever having been diagnosed) who are currently on antiretroviral treatment
The number should include all people currently on ART, regardless of treatment regimen or treatment
interruptions/discontinuation.
Stage 4: Number/percentage of above (estimated number of people living with HIV in the
country, ever having been diagnosed or having had antiretroviral treatment) who had VL
≤200 copies/ml at last visit (virally suppressed) 9
The number should include all those who have ever initiated ART, regardless of regimen or treatment
interruptions/discontinuation.
In addition to considering the picture for the overall European and Central Asian region, data are presented by
WHO sub-region (West, Centre, and East) which broadly groups areas of Europe and Central Asia by geography
and epidemic type, as depicted in Figure 1c.
4
Both the EU and non-EU versions (including Russian translation) can be accessed on ECDC’s website at
https://www.ecdc.europa.eu/en/monitoring-implementation-dublin-2020
5
Gourlay et al 2017, https://oce.ovid.com/article/00002030-201709240-00002/HTML
6
Countries were asked to report data using these definitions. However, in practice some countries may use slightly different
definitions, so caution is required when drawing comparisons between countries.
7
ECDC Modelling Tool. http://ecdc.europa.eu/en/healthtopics/aids/Pages/hiv-modelling-tool.aspx
8
Spectrum is the software used by UNAIDS to prepare annual estimates of the status of the HIV epidemic.
9
A viral load threshold for viral suppression ofDublin Declaration 2020 progress report - Continuum of HIV care ECDC SPECIAL REPORT Figure 3. Geographical/epidemiological division of the WHO European Region The countries covered by the report are grouped as follows: West, 24 countries: Andorra, Austria, Belgium, Denmark, Finland, France, Germany, Greece, Iceland, Ireland, Israel, Italy, Luxembourg, Liechtenstein, Malta, Monaco, the Netherlands, Norway, Portugal, San Marino, Spain, Sweden, Switzerland, the United Kingdom. Centre, 16 countries: Albania, Bosnia and Herzegovina, Bulgaria, Croatia, Cyprus, Czechia, Hungary, Kosovo 10, Montenegro, North Macedonia, Poland, Romania, Serbia, Slovakia, Slovenia, Turkey. East, 15 countries: Armenia, Azerbaijan, Belarus, Estonia, Georgia, Kazakhstan, Kyrgyzstan, Latvia, Lithuania, Moldova, Russia, Tajikistan, Turkmenistan, Ukraine, Uzbekistan. Absolute numerical values were collected, and countries were also asked to specify the year to which the estimates related, the methods and data sources for each stage of the continuum. Countries were also asked how they dealt with deaths, out-migration and loss to follow up within their continuum data. In the 2020 reporting year, ECDC continued the harmonised data collection with UNAIDS agreed in 2018 to ensure compatibility and reduce burden on health authorities. ECDC was responsible for collecting a core set of Global AIDS Monitoring (GAM) indicators through Dublin monitoring for the 30 European Union and European Economic Area (EU/EEA) Member States, meaning there was no separate GAM reporting for these countries. The 25 European and Central Asian countries who are Dublin Declaration signatories but not EU/EEA countries continued to complete GAM through UNAIDS and were therefore asked to complete a shortened ECDC Dublin Declaration questionnaire, with any GAM questions removed. The data collected through these processes were then combined and included in the analysis for this report. Countries were initially asked to complete the Dublin Declaration survey between mid-February and the end of March 2020, this deadline was later extended to July 2020 and several late submissions were made in August 2020 due to the disruption of the COVID-19 pandemic. Between July and August 2020, the values reported by each country were checked and returned for validation. Subsequent notifications of corrections were used to update the information reported. Validation of data collected through the GAM process was conducted by UNAIDS. Where countries did not report data on the continuum of care in this monitoring round, the latest available data from previous monitoring rounds in 2018 and 2019 was included in the analysis. 10 This designation is without prejudice to positions on status, and is in line with UNSC 1244 and the ICJ Opinion on the Kosovo Declaration of Independence. 6
ECDC SPECIAL REPORT                                      Dublin Declaration 2020 progress report - Continuum of HIV care

We analysed the number of countries that reported: (a) all four stages, (b) no stages, and (c) at least two
consecutive stages of the continuum of care nationally and by key population (MSM, PWID, migrants, sex workers
and prisoners). Data are presented by WHO sub-region (West, Centre, and East) which broadly groups areas of
Europe and Central Asia by geography and epidemic type (Figure 3).
Three main analyses were conducted: 1) analysis against the global 90-90-90 targets; 2) analysis of progress
between 2018 and 2020 against the global substantive targets and 3) assessment of the total number of people
living with transmissible levels of virus.
In analyses where data from multiple countries were combined, each element of the continuum was summed
across countries and analyses were undertaken using the summed totals.
1.   Global 90-90-90 targets
Analyses of performance against the global 90-90-90 targets, both overall and for key populations, included data
only where at least two consecutive elements of the continuum were provided, as each measure is a percentage of
the previous stage of the continuum.
2.   Global substantive targets
Analyses of performance against the global substantive targets (Figure 2) only included data where all four stages
of the continuum were available because each measure is a proportion of the first stage (estimated number of all
PLHIV).
When comparing performance against these targets between 2018 and 2020, analyses only included data where all
four stages of the continuum were available for both 2018 and 2020, in order to allow for better comparability over
time.
For comparisons between key populations and all PLHIV within countries, analyses were restricted to those
countries where relevant data were available.
3.   Transmissible levels of virus
To calculate the number of people living with transmissible virus, it was assumed that people remaining
undiagnosed and those not receiving treatment would have transmissible virus levels. Numbers in these categories
were added to the number of people treated but known not to be virally suppressed to provide an estimated total
number of people living with transmissible virus for each country. This measure was only calculated for countries
that reported all four stages of the continuum of care.

                                                                                                                       7
Dublin Declaration 2020 progress report - Continuum of HIV care ECDC SPECIAL REPORT
Results
Data availability
In 2020, responses (full and partial) were submitted from 51 of the 55 European and Central Asian countries to
ECDC and UNAIDS [1]. Overall, 50 countries provided data for at least one stage of the continuum and 45
countries provided at least two consecutive stages of the national continuum of care (this compares to 43 and 42
in 2018 respectively). A total of 40 (73%) countries provided data for all four stages of the continuum in 2020
(Table 2), compared to 34 (62%) countries in 2018.
There was an increase in the proportion of countries reporting data for each individual stage (Figure 4). The
number of countries providing ‘no data’ has decreased substantially since 2018.
In 2020, no data was available for any stage of the continuum of care for five countries: Andorra, Bosnia &
Herzegovina, Liechtenstein, Turkey and Turkmenistan. 11
Annex 1 provides a full overview of which countries were able to provide data for each stage.
Figure 4. Changes in data availability for different stages of the HIV continuum of care in Europe and
Central Asia in 2016, 2018 and 2020
No data People living with HIV Diagnosed On ART Virally suppressed All four stages
50
45
47 47 46
Number of countries reporting
40
42 42 41 42 42
35 40 40
37 36
30 34
31
25 29
20
15
10
11 11
5 5
0
2016 2018 2020
Table 2. Number of countries reporting data on all four stages of the continuum of care in 2016, 2018
and 2020
40 18 West Austria, Belgium, Denmark, Finland, France, Germany, Ireland, Italy, Luxembourg, Malta, Monaco, the Netherlands,
Norway, Portugal, Spain, Sweden, Switzerland, the United Kingdom
2020
11 Centre Albania, Bulgaria, Croatia, Czechia, Montenegro, North Macedonia, Poland, Romania, Serbia, Slovakia, Slovenia
11 East Armenia, Azerbaijan, Belarus, Georgia, Kazakhstan, Kyrgyzstan, Lithuania, Moldova, Russia, Tajikistan, Ukraine.
34 16 West Austria, Belgium, Denmark, France, Germany, Ireland, Italy, Luxembourg, Malta, Monaco, the Netherlands, Portugal,
Spain, Sweden, Switzerland, the United Kingdom.
2018
8 Centre Albania, Bulgaria, Croatia, Czechia, Montenegro, North Macedonia, Romania, Slovenia.
10 East Armenia, Azerbaijan, Belarus, Georgia, Kazakhstan, Kyrgyzstan, Lithuania, Moldova, Russia, Ukraine.
29 15 West Austria, Belgium, Denmark, France, Germany, Greece, Italy, Luxembourg, Malta, the Netherlands, Portugal, Spain,
Sweden, Switzerland, the United Kingdom.
2016
7 Centre Albania, Bulgaria, Croatia, Hungary, Romania, Montenegro, Serbia.
7 East Armenia, Azerbaijan, Georgia, Kazakhstan, Kyrgyzstan, Moldova, Tajikistan.
11
These countries were asked to report via the GAM reporting tool but only Turkey engaged with the reporting process (although
it did not have any continuum of care data to submit).
8ECDC SPECIAL REPORT Dublin Declaration 2020 progress report - Continuum of HIV care
Data sources
Data sources and methodologies used, as well as the quality of the information collected, by each country are
variable and this will impact the ability to compare findings from different countries and regions.
Of the 47 countries that reported the method used to estimate the number of PLHIV (diagnosed and undiagnosed),
just over a third (36%, 17) used the UNAIDS Spectrum method, 26% (12) used the ECDC modelling tool and 38%
(18) used country-specific or bespoke methods (Table 3).
There were variations across the WHO Region in which data sources were used to produce estimates for people
living with HIV, with countries in the Centre and East sub-regions favouring Spectrum estimates while countries in
the West sub-region preferred to use the ECDC HIV modelling tool or country-specific methods. Year of reporting
also varied, which further limits comparability of country estimates.
Table 3. Data sources for the estimated number of people living with HIV in Europe and Central Asia,
reported in 2020
Data source Number of Countries (West, Centre, East) Year of reported data (number
countries of countries)
(n=47)
Spectrum 17 (36%) West: Ireland, Italy 2017 (2); 2018 (3); 2019 (12)
estimate Centre: Albania, Bulgaria, Montenegro, North
Macedonia, Romania, Serbia
East: Armenia, Azerbaijan, Kazakhstan,
Kyrgyzstan, Lithuania, Moldova, Russia,
Tajikistan, Uzbekistan
ECDC HIV 12 (26%) West: Austria, Denmark, Finland, Greece, Malta, 2017 (3); 2018 (4); 2019 (5)
modelling tool the Netherlands, Portugal
Centre: Cyprus, Czechia , Poland, Slovakia,
Slovenia
Other 18 (38%) West: Belgium, France, Germany, Iceland, Israel, 2016 (2); 2017 (2); 2018 (4); 2019
modelling tool Luxembourg, Monaco, Norway, San Marino, (8); 2020 (2)
or estimate Spain, Sweden, Switzerland, United Kingdom
Centre: Croatia
East: Belarus, Estonia, Georgia, Ukraine
Annex 2 provides an overview of the different data sources used for each stage of the continuum. Generally,
countries use cohort or surveillance data, although some countries report using another data source. While the
quality of data systems will vary somewhat, there are advantages and disadvantages of both cohort and
surveillance data. Cohort data tend to be richer in clinical information and enable the linkage of patients over time
to allow the outcomes of patients to be followed up. However, they are likely to be restricted to a subset of clinics
and may be biased towards clinics that are performing well, which may reduce the representativeness of the data.
While surveillance data can also be linked over time to create a patient cohort, accompanying clinical data may be
less rich. While surveillance data may be potentially more nationally comprehensive and therefore representative
than clinic cohort data, the quality of surveillance systems is variable, including different rates for those lost to
follow-up.
Where reported, the national continuum of care related to 2016 for two countries, 2017 for seven countries, 2018
for 11 countries, 2019 for 25 countries and 2020 for two countries. With the exception of three countries, the year
of reporting remained consistent between stages of the continuum for each country (Annex 2). 12
Accounting for out-migration, deaths, and loss to follow-up
The ability to account for out-migration, deaths, and loss to follow-up when calculating each of the stages of the
continuum has a significant impact on the final estimates. For example, a country that is not able to account for
out-migration or deaths of those diagnosed with HIV will most probably have an overinflated denominator of the
total number of persons diagnosed. This may result in a lower proportion of people estimated to be on treatment
and potentially virally suppressed.
12
Spain reported 2017 data for numbers living with and diagnosed with HIV and 2019 data for numbers treated and virally
suppressed. The United Kingdom did the same, although it reported 2018 rather than 2017 data. Estonia only reported two
stages, with 2017 data for numbers living with HIV and 2019 data for numbers treated.
9Dublin Declaration 2020 progress report - Continuum of HIV care ECDC SPECIAL REPORT
Table 4 provides details on which countries were able to exclude or partially exclude out-migration, deaths and loss
to follow-up in their calculations for the continuum of care. Countries marked with an asterisk were those able to
account for the issue in all four stages of the continuum. Annex 3 provides further detail.
A total of six countries were able to exclude out-migration, deaths and loss to follow-up for all four stages of the
continuum.
Table 4. Exclusion of out-migration, deaths and loss to follow-up of people living with HIV from
continuum data, Europe and Central Asia, reported in 2020 13
Excluded or Number of Countries (West, Centre, East)
partially countries
excluded (n=50)
Out-migration 25 (50%) West: Austria*, Belgium*, Denmark*, Finland*, France, Germany*, Iceland, Ireland*,
Israel, Luxembourg*, Malta*, the Netherlands*, Norway*, Portugal*, Sweden*,
Switzerland*
Centre: Albania, Croatia*, Czechia*, Montenegro, North Macedonia*, Poland*,
Slovakia*, Slovenia*
East: Lithuania*
Deaths 34 (68%) West: Austria*, Belgium*, Denmark*, Finland*, France, Germany*, Greece, Iceland,
Ireland*, Israel, Italy, Luxembourg*, Malta*, the Netherlands*, Norway*, Portugal*,
Spain, Sweden*, Switzerland*, the United Kingdom*
Centre: Albania*, Croatia*, Cyprus, Czechia*, Hungary, Montenegro, North
Macedonia*, Poland*, Romania*, Slovakia*, Slovenia*
East: Estonia, Latvia, Lithuania*
Loss to follow- 21 (44%) West: Austria, Belgium, Denmark, Finland*, Germany, Greece, Iceland, Ireland, Malta,
up the Netherlands, Norway*, Sweden, Switzerland*, the United Kingdom*
Centre: Albania, Cyprus, Czechia*, Montenegro, Romania*, Slovenia*
East: Lithuania*
13
Latest available data reported by countries in 2020. See Annex 2 for information on which year the reported data relates to.
10ECDC SPECIAL REPORT Dublin Declaration 2020 progress report - Continuum of HIV care
Continuum of HIV care
This section discusses each stage of the continuum of HIV care in more detail. Annex 1 provides a full overview of
what data were provided by which countries at each stage, and their performance against the global 90-90-90
targets.
Stage 1. Estimated number of people living with HIV
Based on reported data from 47 countries, an estimated 2 287 179 people are living with HIV (Table 5). Of the
eight countries that did not provide estimates on the number of PLHIV, four countries 14 lacked empirical estimates
and four countries 15 did not participate in Dublin Declaration/GAM reporting in 2020.
Table 5. Estimated number of people living with HIV: countries in the West, Centre and East sub-
regions, reported in 2020 16
West WHO sub-region Centre WHO sub-region East WHO sub-region
Countries PLHIV Countries PLHIV Countries PLHIV
Austria 7 480 Albania 1 400 Armenia 3 500
Belgium 18 335 Bulgaria 3 100 Azerbaijan 9 700
Denmark 6 750 Croatia 1 648 Belarus 26 000
Finland 2 924 Cyprus 965 Estonia 6 855
France 172 700 Czechia 3 277 Georgia 9 300
Germany 87 900 Montenegro 368 Kazakhstan 33 427
Greece 15 980 North Macedonia 383 Kyrgyzstan 10 129
Iceland 296 Poland 15 166 Lithuania 3 397
Ireland 7 200 Romania 18 000 Moldova 14 589
Israel 8 039 Serbia 3 200 Russia 998 525
Italy 130 000 Slovakia 1 041 Tajikistan 13 771
Luxembourg 1 176 Slovenia 809 Ukraine 251 168
Malta 453 Uzbekistan 49 676
Monaco 48
Netherlands 23 300
Norway 4 455
Portugal 39 820
San Marino 71
Spain 151 387
Sweden 8 971
Switzerland 16 700
United Kingdom 103 800
14
Hungary, Kosovo, Turkey (Centre); Latvia (East).
15
Andorra, Liechtenstein (West); Bosnia & Herzegovina (Centre); Turkmenistan (East).
16
Latest available data reported by countries in 2020. See Annex 2 for information on which year the reported data relates to.
11Dublin Declaration 2020 progress report - Continuum of HIV care ECDC SPECIAL REPORT
Stage 2. Number of people living with diagnosed HIV
In the 45 countries reporting data within Europe and Central Asia for both stage 1 and stage 2, an estimated
2 280 253 people are living with HIV, 1 880 469 of whom (82%; range 62–100%) have been diagnosed (Table 6).
This is equivalent to approximately one in five (18%; range 0–38%) people living with HIV in Europe and Central
Asia being unaware of their HIV status. Overall, the proportion of undiagnosed people living with HIV is highest in
countries of the East sub-region and lowest in those of the West sub-region.
In the 21 West sub-region countries with data for both stages, an estimated 807 714 people are living with HIV,
725 748 of whom have been diagnosed (90%; range 75–100%). This means that one in ten PLHIV (10%; range
0–16%) in these countries have an undiagnosed HIV infection.
In the 12 Centre sub-region countries with data for both stages, an estimated 49 357 people are living with HIV,
42 816 of whom have been diagnosed (87%; range 64–98%). This means approximately one in eight people living
with HIV (13%; 2–36%) in these countries have undiagnosed HIV infection.
In the 12 East sub-region countries with data for both stages, an estimated 1 423 182 people are living with HIV,
1 111 905 of whom have been diagnosed (78%; range 62–86%). This means that approximately one in five PLHIV
(22%; range 14–38%) in these countries have undiagnosed HIV infection.
Table 6. Number and percentage of people living with HIV with diagnosed and undiagnosed HIV
infection for 45 countries in Europe and Central Asia, reported in 2020 17
Estimated number of Number of PLHIV % of PLHIV diagnosed % of PLHIV undiagnosed
Countries
PLHIV (range) diagnosed (range) (range) (range)
West (n=21) 807 714 725 748 90% 10%
(48−172 700) (48−148746) (75−100%) (0−25%)
Centre (n=12) 49 357 42 816 87% 13%
(368−18 000) (243−16486) (64−98%) (2−36%)
East (n=12) 1 423 182 1 111 905 78% 22%
(3 397−998 525) (2700−808823) (62−86%) (14−38%)
All countries (n=45) 2 280 253 1 880 469 82% 18%
(48−998 525) (48−808823) (62−100%) (0−38%)
A total of 17 of the 45 countries (Austria, Belgium, Bulgaria, Denmark, Finland, Iceland, Ireland, Israel, Italy,
Monaco, Norway, the Netherlands, Portugal, Romania, Sweden, Switzerland, and the United Kingdom) have
achieved the first of the UNAIDS targets, with 90% or more of all PLHIV knowing their status (Figure 5).
Of the other 28 countries, 16 are within 10% of meeting the target, reporting that 80% or more (range 80–89%)
of PLHIV know their status (5 West; 7 Centre; 4 East), and 12 countries are more than 10% away from reaching
the target, reporting that fewer than 80% (range 62–77%) of PLHIV know their status (1 West; 3 Centre; 8 East).
Figure 5. Percentage of all people living with HIV who know their status in 45 countries of Europe
and Central Asia, reported in 2020 18
100% Global target 90%
90%
80%
70%
60%
50%
40%
30%
20%
10%
0%
Met or exceeded target Within 10% of meeting target Target not met
17
Latest available data reported by countries in 2020. See Annex 2 for information on which year the reported data relates to.
18
Latest available data reported by countries in 2020. See Annex 2 for information on which year the reported data relates to.
12ECDC SPECIAL REPORT Dublin Declaration 2020 progress report - Continuum of HIV care
Stage 3. Number of people diagnosed who are on treatment
In the 43 countries that reported data for both stage 2 and stage 3 within Europe and Central Asia, an estimated
1 879 315 PLHIV have been diagnosed, of whom 1 259 667 (67%; range 40–100%) are reported to be on
treatment (Table 7). Based on available data, around one in three people (33%; range 0–60%) with diagnosed HIV
infection in Europe and Central Asia are therefore not currently receiving ART.
In the 20 West sub-region countries that reported data for both stage 2 and stage 3, an estimated 725 457 PLHIV
have been diagnosed, 675 915 (93%; range 68–100%) of whom are reported to be on treatment. This means that
around one in 14 PLHIV (7%; range 0–32%) who have been diagnosed in these countries are not benefitting from
HIV treatment.
In the 11 Centre sub-region countries that reported data for both stages, an estimated 41 953 people living with
HIV have been diagnosed, 32 718 (78%; range 48–92%) of whom are reported to be on treatment. This means
that one in five people living with HIV (22%; range 8–52%) who have been diagnosed in these countries are not
benefitting from HIV treatment.
In the 12 East sub-region countries that reported data for both stages, an estimated 1 111 905 people living with
HIV have been diagnosed, 551 034 (50%; range 40–86%) of whom are reported to be on treatment. This means
that one in two PLHIV (50%; range 14–57%) who have been diagnosed in these countries are not benefitting from
HIV treatment.
Table 7. Number and percentage of people living with diagnosed HIV who are on treatment for 43
countries in Europe and Central Asia, reported in 2020 19
Number of PLHIV % of PLHIV diagnosed
Number of PLHIV % of PLHIV diagnosed
Countries diagnosed on ART but currently not on
diagnosed (range) on ART (range)
(range) ART (range)
West (n=20) 725 457 675 915 93% 7%
(48−148 746) (48−133 400) (68−100%) (0−32%)
Centre (n=11) 41 953 32 718 78% 22%
(243−16 486) (181−12 644) (48−92%) (8−52%)
East (n=12) 1 111 905 551 034 50% 50%
(2 700−808 823) (1 223−319 613) (40−86%) (14−60%)
All countries (n=43) 1 879 315 1 259 667 67% 33%
(48−808 823) (48−319 613) (40−100%) (0−60%)
In total, 17 of the 43 countries (Austria, Belgium, Denmark, Finland, France, Germany, Italy, Malta, Monaco, the
Netherlands, Norway, Portugal, Slovenia, Spain, Sweden, Switzerland, the United Kingdom) have achieved the
second of the UNAIDS targets: 90% of PLHIV know their status and are on treatment (Figure 6).
Of the other 26 countries, 12 are within 10% of meeting the target, reporting that 80% or more (range 80–89%)
of PLHIV who know their status are on treatment (3 West; 4 Centre; 5 East), and 14 are more than 10% away
from reaching the target, reporting that fewer than 80% (range 40–78%) of PLHIV who know their status are on
treatment (1 West; 6 Centre; 7 East).
19
Latest available data reported by countries in 2020. See Annex 2 for information on which year the reported data relates to.
13Dublin Declaration 2020 progress report - Continuum of HIV care ECDC SPECIAL REPORT
Figure 6. Percentage of all people living with diagnosed HIV who are on treatment for 43 countries of
Europe and Central Asia, reported in 2020 20
100% Global target 90%
90%
80%
70%
60%
50%
40%
30%
20%
10%
0%
Met or exceeded target Within 10% of meeting target Target not met
Stage 4. Viral suppression among people living with HIV on
treatment
In the 40 countries across Europe and Central Asia that reported data for both stage 3 and stage 4, an estimated
1 215 319 PLHIV are on treatment, 1 092 704 of whom (90%; range 64–100%) are virally suppressed (Table 8).
One in ten people (10%; range 0–36%) currently on ART in Europe and Central Asia have therefore not achieved
viral suppression.
In the 18 West sub-region countries with data for both stages, an estimated 660 210 PLHIV are on treatment,
613 290 (93%; range 76–100%) of whom are virally suppressed. This means that around one in 14 (7%; range 0–
24%) currently on ART in these countries are not virally suppressed.
In the 11 Centre sub-region countries with data for both stages, an estimated 32 718 PLHIV are on treatment,
26 594 (81%; range 64–97%) of whom are virally suppressed. Around one in five PLHIV (19%; range 3–36%)
currently on ART in these countries are not virally suppressed.
In the 11 East sub-region countries with data for both stages, an estimated 522 391 PLHIV are on treatment,
452 820 of whom (87%; range 73–94%) are virally suppressed. Around one in eight PLHIV (13%; range 6–27%)
currently on ART in these countries are not virally suppressed.
Table 8. Number and percentage of people on treatment who are virally suppressed for 40 countries
across Europe and Central Asia, reported in 2020 21
% of PLHIV diagnosed
Number of PLHIV % of PLHIV on ART
Number of PLHIV on on ART who are not
Countries virally suppressed who are virally
ART (range) virally suppressed
(range) suppressed (range)
(range)
West (n=18) 660 210 613 290 93% 7%
(48−133 400) (48−126 800) (76−100%) (0−24%)
Centre (n=11) 32 718 26 594 81% 19%
(181−12 644) (170−10052) (64−97%) (3−36%)
East (n=11) 522 391 45 820 87% 13%
(1 233−319 613) (920−271 671) (73−94%) (6−27%)
All countries (n=40) 1 215 319 1 092 704 90% 10%
(48−319 613) (48−271 671) (64−100%) (0−36%)
20
Latest available data reported by countries in 2020. See Annex 2 for information on which year reported data relates to.
21
Latest available data reported by countries in 2020. See Annex 2 for information on which year reported data relates to.
14ECDC SPECIAL REPORT Dublin Declaration 2020 progress report - Continuum of HIV care
In all, 23 of the 40 countries (Belgium, Croatia, Czechia, Denmark, Finland, France, Germany, Georgia, Ireland,
Monaco, Montenegro, the Netherlands, North Macedonia, Norway, Poland, Portugal, Serbia, Slovenia, Spain,
Sweden, Switzerland, Ukraine and the United Kingdom) have achieved the third of the UNAIDS targets: 90% of
PLHIV who are on treatment are virally suppressed (Figure 7).
Of the other 17 countries, ten are within 10% of meeting the target, reporting that 80% or more (range 80−89%)
of PLHIV who are on treatment are virally suppressed, and seven are more than 10% away from reaching the
target, reporting that fewer than 80% (range 53–79%) of PLHIV are virally suppressed.
Figure 7. Percentage of people on treatment reaching viral suppression for 40 countries of Europe
and Central Asia, reported in 2020 22
100%
Global target 90%
90%
80%
70%
60%
50%
40%
30%
20%
10%
0%
Met or exceeded target Within 10% of meeting target Target not met
Viral suppression among all people living with HIV
As noted above, in 2020, 40 countries (18 West; 11 Centre; 11 East) reported data on all four stages of the
continuum of HIV care, compared with 34 countries in 2018 (Table 2 and Figure 4). Based on data reported by
these countries for stage 1 and 4, an estimated 2 205 297 people are living with HIV, 1 092 704 (50%; range 27–
100%) of whom are virally suppressed (Table 9). This means that half of PLHIV (50%; range 0–73%) in Europe
and Central Asia have therefore still not achieved viral suppression.
In the 18 West sub-region countries with data for all four stages, an estimated 783 399 people are living with HIV,
613 290 (78%; range 64–100%) of whom are virally suppressed. This means that around one in five (22%; range
0–36%) PLHIV in these countries are not virally suppressed.
In the 11 Centre sub-region countries with data for all four stages, an estimated 48 392 people are living with HIV,
26 594 (55%; range 37−79%) of whom are virally suppressed. This means that around half (45%; range 21–63%)
of the PLHIV in these countries are not virally suppressed.
In the 11 East sub-region countries with data for all four stages, an estimated 1 373 506 people are living with HIV,
452 820 (33%; range 27–55%) of whom are virally suppressed. This means that around two-thirds (67%; range
45–73%) of PLHIV in these countries are not virally suppressed.
22
Latest available data reported by countries in 2020. See Annex 2 for information on which year the reported data relates to.
15You can also read