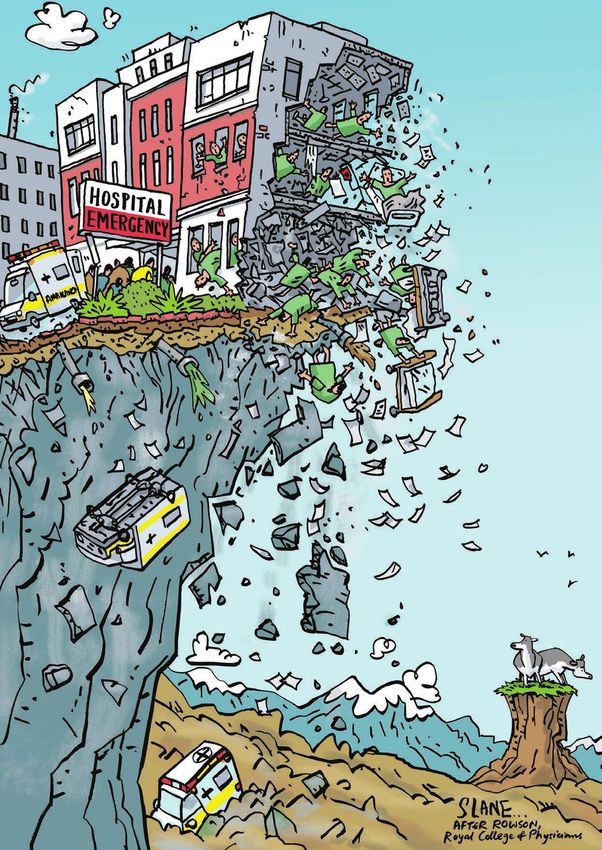
Hospitals on the Edge - A report by the Association of Salaried Medical Specialists on the precarious state of New Zealand's public hospital ...
←
→
Page content transcription
If your browser does not render page correctly, please read the page content below
Hospitals on the Edge
A report by the Association of Salaried Medical
Specialists on the precarious state of New Zealand’s
public hospital services and recommended actions

Acknowledgements
This publication was inspired by the report Hospitals on the Edge? The Time for Action,
produced by the Royal College of Physicians in the United Kingdom in September 2015.

Introduction
The Association of Salaried Medical Specialists (ASMS) has been receiving reports from our members with
increasing frequency expressing nothing less than desperation about the unceasing pressures to cope with
hospital workloads. In the past there has been relative quiet periods to recover, but this has changed. As
District Health Boards themselves are reporting, hospital bed occupancy rates are hitting record levels and
many wards are operating at levels exceeding clinical safety standards for prolonged periods. There is a
palpable sense of dread among our members of what’s in store next winter when hospitals are at their busiest.

This is why hospitals are the focus of this report. ASMS advocates for a whole-systems approach to health,
recognising that all parts of the system are inter-dependent. However, the pressures that have built in
hospital services mean they are now at a dangerous tipping point. Verbatim comments from members
throughout this report typify what we are hearing.

Hospitals have been ill-served by policy-makers in the past few decades, including privatisations,
restructurings, amalgamations, real funding cuts, and imposing narrow, politically motivated targets without
appearing to understand their consequences. The problems canvassed in this report will worsen if the
mistakes of the past are repeated, and we fear this is happening.

Proposals to shift resources from hospitals to the community, strongly indicated in the Health and Disability
System Review’s Interim Report to the Minister of Health, have happened in mental health services in
this year’s Budget, despite strong evidence of unmet need for specialist level services. This will create
an even narrower bottleneck for accessing hospital care, which will increase the workloads for primary
care practitioners, and which in turn will add to the rapidly growing number of patients turning up in
hospitals needing emergency care. More resources are needed in the community but it is harmful and
counterproductive to do so at the expense of hospitals.

The negative spiral of acute hospital admissions increasing at twice the rate of population growth has
been caused largely by chronic under-funding. There are simply too few staff, too few acute hospital beds,
too many patients discharged before they should be, too many facilities unfit for purpose, and too many
patients denied access to timely treatment because hospitals lack capacity.

This report offers evidence-based solutions. The solutions involve, as indicated above, a whole-system
approach. They require a change in mindset of policy-makers who appear to view hospitals mostly as an
inconvenient expense instead of a core investment for improving and maintaining New Zealanders’ well-
being and productivity.

In May 2017 the then Labour health spokesperson Dr David Clark commented: “Waiting times and full
beds across our hospitals are symptomatic of a growing crisis.”1 The content that follows, compiled from
official information requests, Ministry of Health data and various DHB committee reports, represents a brief
overview of that same “growing crisis”. One that now needs urgent action.

We welcome feedback and discussion.

Professor Murray Barclay
ASMS National President

                                                                              WWW.ASMS.ORG.NZ HOSPITALS ON EDGE   1
At a glance
• Acute hospital admissions are increasing at more than twice the rate of population growth.
• The steep rise in acute admissions appears to be displacing non-urgent admissions, which are increasing
at only half the rate of population growth.
• Emergency Department use is growing more than twice the rate of population growth.
• Urgent presentation to EDs are growing at a faster rate than less urgent events.
• Unplanned acute readmission rates within 28 days of discharge from hospital averaged 12.1% of
discharges for the year to December 2018. This has risen from an average 8% in 2007.
• In many hospitals, bed occupancy rates are frequently close to – and sometimes over – 100%. The widely
accepted clinical safety level for bed occupancy is a maximum of 85%.
• About 4.7% of the population is estimated to have severe mental health need. Mental Health and
Addiction (MHA) services for people with severe needs saw about 3.6% of the population in 2016, DHBs
are funded to cover 3%.
• The number of hospital beds per head of population for people with severe psychiatric needs is among
the lowest in the Organisation for Economic Cooperation and Development (OECD).
• Despite significant increases in the use of hospital services, we estimate there are potentially 430,000
children and adults with an unmet need for hospital care.
• The DHB-employed senior doctor workforce is estimated to be 24% short of what is needed to provide
safe, good quality and timely health care, based on surveys of clinical leaders in 15 DHBs.
• In 2009/10 Vote Health operational expenses were 6.28% of gross domestic product (GDP), which had
dropped to 5.60% of GDP by 2017/18. For Vote Health operational expenditure to match 6.28% of GDP
in 2009/10, it would have needed a further $1.7 billion in this year’s budget.
• Actions for the Government:
- To reduce pressure on hospitals, get serious about integrating primary and secondary services
- Support staff to flourish rather than simply survive. This requires a strong commitment to distributed
clinical leadership
- Address staff shortages to enable patient-centred care and greater efficiency
- Adopt responsible funding policies to match policy aspirations
- When planning to fix hospital buildings, talk with those who use them
- More effort and urgency into addressing the determinants of ill health
- Start measuring and monitoring unmet need for hospital care
• What the health system does not need:
- Restructuring
- Policies with 3-year focus
- Ideas imported from overseas out of context and not transferable
2 HOSPITALS ON EDGE NOVEMBER 2019WWW.ASMS.ORG.NZ HOSPITALS ON EDGE 3
4 HOSPITALS ON EDGE NOVEMBER 2019
Acute and non-acute admissions                                                                               Source: Ministry of Health Caseload
                                                                                                                Monitoring Reports (data extracted
                                                                                                                from Excel spreadsheets)
                    25          Acute (actual)       Acute (caseweights)          Population                    Notes
                                                                                                                Figures include inpatient, surgical,
                                                                                                                medical and maternity discharges.
                    20
                                                                                                                Case weights measure the resources
Percentage change

                                                                                                                needed for the treatment given to
                    15                                                                                          each patient during a hospital stay.
                                                                                                                For example, a cataract operation will
                                                                                                                receive a case weight of approximately
                    10                                                                                          0.5 whereas a hip replacement would
                                                                                                                receive 4 case weights. Case weight
                                                                                                                measurements are occasionally
                     5
                                                                                                                adjusted to reflect changing practices
                                                                                                                and technology. These are expected to
                     0                                                                                          have a marginal effect on overall trends.
                         2011        2012        2013        2014          2015        2016       2017   2018
                                                               Years to June

   FIGURE 1: ACUTE DHB INPATIENT DISCHARGES (ACTUAL AND CASE
   WEIGHTED) 2010/11 TO 2017/18

   Acute hospital inpatient discharges increased by 23.5% between
   2011 and 2018 (17.6% when case-weighted), while the population
   increased by 10.6% (Figure 1). On the other hand, while case-
   weighted non-acute discharges increased by 14.6% over the same
   period, the increase in actual discharges (5.3%) was lower than
   population growth (Figure 2).

   These trends suggest non-acute patients are being displaced by a
   combination of budget constraints, a rise in acute cases and the
   increase in complexity of non-acute cases. More information is needed
   to properly interpret these trends, but the low growth of non-acute
   headcounts compared with population growth may indicate growing
   unmet need for elective surgery and non-urgent medical treatment.

                    16          Non-Acute (actual)       Non-Acute (caseweights)           Population
                    14

                    12

                    10
Percentage change

                     8

                     6

                     4

                     2

                     0
                         2011        2012        2013        2014          2015        2016       2017   2018
                    -2

                    -4
                                                               Years to June

   FIGURE 2: NON-ACUTE DHB INPATIENT DISCHARGES (ACTUAL AND
   CASE WEIGHTED) 2010/11 TO 2017/18

                                                                                                                  WWW.ASMS.ORG.NZ HOSPITALS ON EDGE         5
Emergency Department use
“This past winter is the worst
we’ve seen. I’ve brought it to
the attention of administration More than 1.2 million people attended hospital Emergency
multiple times, saying I feel Departments (EDs) in 2018/19 – an increase of 26.4% since 2010/11
patient acuity and volume and more than twice the population growth rate of 12.2% for that
are unsafe given our current period (Figure 3).
staffing. Someone is going to
In addition, the proportion of immediately or potentially life-
die in the ED waiting room and
threatening events (triage levels 1–3) is growing. Ministry of Health
that’s the only thing that’s
data show in 2010/11 the number of triage levels 1-3 was about the
going to make change happen
same as less urgent events (triage 4-5). By 2014/15 triage levels 1-3
in the DHB”.
comprised 54% of total presentations.
Emergency medicine specialist 30
25
20
Percentage change
15
10
5
0
2011 2012 2013 2014 2015 2016 2017 2018 2019
Years to June
FIGURE 3: GROWTH IN HOSPITAL EMERGENCY DEPARTMENT
ATTENDANCES, 2010/11 TO 2018/19
Source: Ministry of Health: 2011-2015. DHBs 2017-2019. 2016 is estimated.
6 HOSPITALS ON EDGE NOVEMBER 2019Emergency readmission to hospital “There is an overall lack of
within 28 days of discharge clinical space and isolation
facilities are insufficient to
Unplanned acute 28-day readmission rates averaged 12.1% of hospital meet demand. Workflow is
discharges for the year to December 2018, ranging from 9.9% in one dictated by constraints of the
DHB to 14.6% in another. This has risen from an average 8% in 2007 existing layout and at times
(Figure 4). becomes chaotic, especially
during the winter peaks when
Unplanned readmission rates in Australia were 7.4% of acute care the clinical team works flat out
discharges in 2015.2 In Britain’s National Health Services, the rates to free up bed spaces for acute
were 6.7% in 2015/16.3 ED and GP referrals. During a
recent weekend on call period,
This indicator is a proxy of both the care received in hospitals and
four children spent the night in
the coordination of care back to and within the outpatient setting.
ED due to lack of capacity on
It may indicate a quality issue related to shortened length of stay and
the ward”.
premature discharge, inadequate care, lack of patient adherence to
the care regimen following discharge from hospital or poor integration
of care. Paediatrician
Readmission rates are an imperfect measure of quality, however. Not
all reasons for readmission are under the control of the health care
service or hospital.
14 HQSC (2007-2011 Ministry of Health (2013-2018)
12
10
Percentage of discharges
8
6
4
2
0
2007 2008 2009 2010 2011 2012 2013 2014 2015 2016 2017 2018
Year
FIGURE 4: EMERGENCY READMISSION TO HOSPITAL WITHIN 28 DAYS
OF DISCHARGE
Sources: HQSC (2007-2011); Ministry of Health (2013-2018). Note: Years 2013, 2014,
2015 are years to June
WWW.ASMS.ORG.NZ HOSPITALS ON EDGE 7“Because the hospital is over-
Bed occupancy
capacity with patients, the ED
becomes overcrowded, with In many hospitals around New Zealand, bed occupancy rates are
some admitted patients in frequently close to – and sometimes over – 100%, which is well above
ED waiting up to 16 hours for the widely accepted safety level.
an inpatient bed to become
Hospitals cannot operate at 100% occupancy, as spare bed capacity
available. All treatment spaces
is needed to accommodate variations in demand and ensure that
in ED are filled up with patients
patients can flow through the system. A lack of available beds has
who should be on a ward, and
widespread consequences in a health system. For example, delays in
the ED waiting room becomes
emergency departments worsen, elective procedures are cancelled,
an overcrowded area with
patients are placed in clinically inappropriate wards, hospital acquired
undifferentiated patients whose
infections increase, and there is greater pressure on staff to free up
care is delayed by insufficient
beds. Bed availability is also closely linked to staffing, as beds cannot
treatment space in ED”.
be safely filled without appropriate staffing levels.4
A figure of 85% occupancy is often quoted as the ideal in balancing
Emergency medicine specialist
clinical safety and cost-efficiency, though the range 82% to 85% is
considered by some to be the “absolute maximum occupancy (even
during the winter months)” to maintain patient safety. The national
average figure for Europe is around 77%.5
While high levels of hospital bed occupancy are an important
indicator of a health system under pressure, occupancy rates are not
routinely reported as key performance indicators, nor does there
appear to be a standardised way of measuring occupancy rates in New
Zealand. However, a variety of reports reveal not only an alarming
level of occupancy rates but that they are increasing. This has been
underscored to ASMS from many verbal reports from our members.
For example, the Auckland DHB’s Health Advisory Committee (HAC)
reports show the adult hospital has been at or near 100% capacity
most days throughout July, August and September, and that: “Each
month throughout winter new occupancy records have been broken.”
The October 2019 HAC report reveals children’s hospital services have
been running at 95% -105% since early May.
The 2017/18 annual reports for Waikato and Counties Manukau
DHBs show acute bed occupancy averaged over 90% for the year in
both DHBs.
The October Board meeting notes at Capital & Coast DHB report
occupancy for adult beds remains at over 94% “which has a material
impact on acute flow from ED”.
Canterbury DHB’s website says: “Hospital inpatient occupancy rate
generally runs between 90%-95%”, but papers prepared for the
DHB board meeting in September indicated a record number of 709
8 HOSPITALS ON EDGE NOVEMBER 2019surgical and medical patients were treated at the 540-bed hospital on
one day in July.
At Waitemata DHB, where specialist Mental Health and Addiction
(MHA) services have been operating at 100% bed occupancy (similar
to MHA inpatient services in some other DHBs), the HAC report
of June 2019 describes the effects of having brief periods of 85%
occupancy:
“The Adult in-patient units have experienced 85% occupancy twice,
lasting only a few days at a time. This is the first time the target has
been reached in over three years. However, it is not being sustained
for longer periods. The benefits have been significant over the two
brief periods with improvements in the quality of care for people both
in the in-patient units and in the community. Staff have reported that
their ability to spend time with people and their whānau and provide a
better quality of service has been significant during these brief periods
of 85% occupancy.” (HAC report, p64)
“Increase in acute demand “When we’re all here it can be
over the years, largely quite manageable but everyone
driven by increased medical has to have their leave so
admissions to hospital, have when people go on leave it can
not been matched with become very very hard. There
increased inpatient bed was a stage earlier in the year
resources. At times there have when I cried on the way to work
been up to 35-40 medical – I was just not looking forward
inpatients above the number to the workload I was going
of permanently resourced to face”.
medical beds. These patients
are being managed on surgical
Pathologist/Haematologist
wards or in overflow beds,
leading to inefficient care,
increased in-hospital length
of stay, and arguably a lower
than desired standard of care”.
Emergency medicine specialist
WWW.ASMS.ORG.NZ HOSPITALS ON EDGE 9“There is a massive reliance
Hospital Mental Health and Addiction
on “stats” about what people Services
are doing. A whole stream of
work which seems focused on An extensive Ministry of Health survey in 2006 estimated 4.7% of the
generating “stats” but which adult population had severe mental health needs, and the available
is almost entirely irrelevant in evidence suggests a similar need for younger people. At the time,
terms of the delivery of quality mental health and addiction (MHA) services saw just 2.3% of the
mental health care, and yet population. This had increased to 3.6% by 2016, though DHBs were
most people who spend their funded to cover 3%.
time in clinical roles can see
that a good chunk of the work Between 2008/09 and 2015/16 the number of MHA clients seen
that gets done is not captured by DHB services increased by 28.8%. Funding has been in line with
at all by this lumbering, population growth, which was 9.1% for this period (Figure 5).
blundering system”. The funding shortfall for severe-needs clients became more acute
after the 2019 Budget cut an estimated real $55 million from those
Psychiatrist services to help pay for additional community-based services for
people with less severe needs.
These trends suggest there is a significant number of people with
“We’ve had exponential severe conditions who are not accessing appropriate services. Moves
increases in patient volumes to shift resources from severe-needs clients to those with lesser needs
over the past five years but is a longer-term plan to attempt to reduce pressure on the former.
there’s been no increase in FTE However, this will increase pressure on severe-needs services, which
on the consultant or nursing in turn will see more patients needing specialist treatment falling back
side so effectively we’re being on primary care services.
asked to just work harder.
The number of hospital beds per head of population for people with
I barely get to the bathroom.
severe psychiatric needs is among the lowest in the OECD (Figure 6).
I can’t work any harder safely”.
Emergency medicine specialist
10 HOSPITALS ON EDGE NOVEMBER 201935
30
25
Percentage change
20
15
10
5
0
2008/09 2009/10 2010/11 2011/12 2012/13 2013/14 2014/15 2015/16
Year
FIGURE 5: MENTAL HEALTH AND ADDICTION CLIENTS SEEN BY DHBS - PERCENTAGE CHANGE 2008/09 TO 2015/16
Source: Ministry of Health
3
2.5
Psychiatric inpatient beds/1000 population
2
1.5
1
0.5
0
Japan
Lithuania
Belgium
Korea
Germany
Latvia
Norway
Czech Republic
Switzerland
Netherlands
Hungary
France
Slovak Republic
Slovenia
Poland
Portugal
Austria
Estonia
Australia
Finland
Ireland
New Zealand
Greece
Luxenbourg
Denmark
Sweden
Israel
United Kingdom
Iceland
Spain
Canada
United States
Chile
Italy
Turkey
Mexico
Country
FIGURE 6: PSYCHIATRIC INPATIENT BEDS/1000 POPULATION – 2018 OR NEAREST YEAR
Source: OECD Health Data 2019
WWW.ASMS.ORG.NZ HOSPITALS ON EDGE 11“We’re hundreds of patients
Unmet need for hospital care
behind in our clinic [first
specialist assessments]. Some Despite significant increases in the use of hospital services, we
clinics are cancelled due to estimate there are potentially 430,000 children and adults with an
[high acute demand]. We’re not unmet need for hospital care.
meeting our cancer targets in
Unmet need for hospital care is not routinely measured in New
terms of operation dates. We’re
Zealand. Ministry of Health data captures only a part of it. For example,
cancelling theatre lists routinely
data show more than 30,000 patients a year are rejected for hospital
due to lack of staff and bed
treatment, despite being assessed by a medical specialist as needing it.
capacity. We are running about
These patients are turned away because the hospital has insufficient
two months behind target for
capacity. Instead they are referred back to the general practitioner
semi-urgent colonoscopies
for monitoring. They may receive treatment later but only when their
and are struggling to keep up
condition has deteriorated sufficiently. A further 14,000 patients
with the demands of the bowel
assessed by hospital specialists are sent back to their GP because
screening project. Short notice
they have insufficient information about the patient. And another
stress leave has become more
1,200 patients are deemed “not eligible” for treatment. But these are
frequent”.
incomplete figures as there are gaps in data from some DHBs; GPs may
be reluctant to refer patients due to the high threshold of acceptance
Surgeon for treatment; and many people, especially the poor and Māori and
Pasifica, for various reasons cannot access GP services in the first place.
Nor is there any information on how long patients who are deemed not
unwell enough for treatment remain in limbo.
In a specific example where accurate levels of unmet need are
obscured, Ministry of Health figures show that in Canterbury in 2016
only 0.6% of patients were waiting longer than the government target
for first specialist assessments for hip and knee surgery. But a study
for determining the ‘real’ unmet need related to the implementation
of a triage system for elective hip and knee referrals in Canterbury
found that 43% of hip and 54% of knee patients were not able to
move beyond the initial triage process, which rations access to
specialist appointments.6
A comprehensive national survey to measure unmet need for hospital
care has never been undertaken. However, a 2015/16 pilot study of
methods for undertaking such an exercise, including interviews with
over 1200 adults in Auckland and Christchurch, estimated a total unmet
need for hospital care of about 9% of the population. This included
unmet need for surgical, non-surgical, dental, and psychiatric care.7
This was broadly consistent with studies commissioned by the Health
Funds Association of New Zealand and New Zealand Private Surgical
Hospitals, in 2013 and 2016, each based on surveys of 1800 adults
(aged 18 and over), which found that 5% on both occasions had been
advised they required some form of elective surgery but were not on
a waiting list because they were not deemed unwell enough to qualify
12 HOSPITALS ON EDGE NOVEMBER 2019for one. For those accepted for surgery, the study found average
waiting times of 304 days (measured from the time of first GP referral)
– up by 80 days on the 2013 study.8
Information from our members, frequent media reports concerning
difficulties in patients accessing timely treatment, and continuing real-
term cuts to DHB budgets, strongly suggest the situation has not got
better in the past three years.
A 9% rate of unmet need, assuming rates are similar for the under
18s, equates to about 430,000 people in 2019.
Unmet need for hospital care is a cost to the economy—rather than
being a saving it shifts costs to other parts of the health system. It
imposes a heavy burden on primary care and patients.
“SMOs are voting with their “I wake up in the middle of
feet, they’re leaving not because the night and can’t get back
they want to, but because to sleep while I think: Oh
for many they end up finding my goodness I haven’t seen
themselves in an impossible this person in ages, or oh
position, forced to choose my goodness I’ve got these
between caring for patients investigations to follow up
in an obviously unsustainable and when am I going to get
system, and where no clear to this stuff”.
solutions to the issues faced are
being presented, or stepping
Geriatrician
away so that they can look after
their own personal health and
well-being as well as that of
their family”.
Psychiatrist
WWW.ASMS.ORG.NZ HOSPITALS ON EDGE 13“Our colleagues come to work
Specialist shortages
each day trying to do their
best but are continuously The extent of DHB-employed senior medical officer (SMO) shortages
exposed to a toxic, underfunded in New Zealand has been well documented by ASMS.9 The latest
environment that leaves assessment of shortages, based on surveys of clinical heads of
many demoralised and burnt departments in 15 DHBs, indicates an average workforce shortfall of
out. Knowing that we could 24%, or 555.6 specialist FTE (Figure 7).
do so much better if only we But while workforce shortages affect access to health care, as well as
had enough staff and decent the quality, safety and efficiency of public hospital services, they go
facilities to work in, is heart- largely unnoticed by the general public, in part because the shortages
breaking at best and soul- are so entrenched. Coping with shortages has become the norm
destroying at worst”. for many public hospital departments, though it comes at a cost of
doctors’ own health and well-being, as illustrated in peer-reviewed
ASMS studies which found 88% of SMOs routinely go to work when
General medicine specialist
they are ill10 and 50% report symptoms of burnout.11
We acknowledge that shortages are also entrenched in other areas of
the health sector. The Government has high policy expectations for
more effective services and improved well-being for all, but falls well
short of recognising the resources needed to achieve its ambitions.
For example, in Scandinavian countries, Finland and the Netherlands
– all countries with policy emphases on promoting wellbeing – the
proportion of the health and social care* workforce ranged from
15%-20% of the total workforce in 2015, compared to New Zealand’s
10.8%.12 The advice to the Minister of Health in the Health and
Disability System Review Interim Report is that workforce growth
trends are already at ‘unsustainable’ levels.
South Canterbury (2019) 25%
Southern (2019) 27%
Hutt (2019) 26%
Auckland (2019) 20%
Tairawhiti (2019) 25%
Whanganui (2019) 26%
Northland (2019) 36%
Waikato (2019) 28%
Waitemata (2018) 19%
Canterbury (2017) 25%
Counties Manakau (2016/7) 18%
* Defined as a composite of human
Nelson-Marlborough (2016/7) 17%
health activities, residential care
activities (including long-term care), Capital & Coast (2016) 27%
and social work activities without MidCentral (2016) 27%
accommodation Hawke’s Bay (2016) 22%
Source: ASMS surveys of clinical 0% 5% 10% 15% 20% 25% 30% 35% 40%
leaders. Full reports available:
https://www.asms.org.nz/ FIGURE 7: ESTIMATED SMO STAFFING SHORTFALL AS A PERCENTAGE OF
publications/researchbrief/ CURRENT STAFFING ALLOCATIONS IN 15 DHBS
14 HOSPITALS ON EDGE NOVEMBER 2019Poorly maintained buildings The hospital essentially requires
a complete rebuild with the
The now well-reported gross neglect of hospital buildings illustrates tower block (where inpatient
how the health system has suffered from short-sighted policies. wards are located) aging,
The poor maintenance of buildings is due in large part to prolonged and without air conditioning
funding constraint forcing DHBs to divert budgeted capital which is a significant issue over
expenditure to operational expenditure to cope with immediate summer months. Essentially
service needs. predictable increases in both
acute and elective demand
The impact of poor building quality on services is costly in terms of the
have not been matched by
quality and safety of health care. As a Sapere report on the condition
investment in infrastructure.
of Dunedin Hospital found, the “deteriorating physical environment
Funding for infrastructure,
is eroding quality of care, creating safety risks, and causing distress
which should be a basic
to patients and staff”, as well as causing delays and “leading to an
component of the Ministry
increased likelihood of adverse events for both staff and patients”.13
of Health’s responsibility to
Poor maintenance of hospital buildings has been cited as a serious
fund hospital-based care, is
health and safety hazard in the United States and Britain’s National
a significant issue with DHBs
Health Service (NHS).
essentially being required to
That the negligence has been so bad that an estimated $14 billion borrow funds for infrastructure
($9.2 billion requiring Crown funding) is needed over the next 10 investment.
years to put things right reflects not only poor DHB oversight and
accountability but also a poor duty of care and a head-in-the-sand
Emergency medicine specialist
mentality at government level.
The 2019 Budget for 2019/20 included $1.5 billion for infrastructure
but, as the Vote Health documents explain, this includes funding for
multi-year projects and provision for some future expenses or risks.
New capital funding of a similar magnitude will be needed in each
Budget for years to come to cover what is needed over the next decade.
WWW.ASMS.ORG.NZ HOSPITALS ON EDGE 15“We send emails, we attend
The funding slide
meetings, we write business
cases. We get our hopes up that The Government’s Health and Disability System Review Interim Report
this time we will be heard and claims Core Crown Health expenditure has recently gone through “a
then our hopes are dashed by sustained period of little real growth”, referring to “real” per capita
funding trends, using a GDP deflator. This does not take account of
another directive to do more
the additional needs of an aging population or the accumulating
with less, become more efficient
additional costs of new initiatives introduced each year.
and raise the bar at which you
will see patients to make it look In contrast, an Infometrics analysis of Core Crown Health expenditure
like we are keeping up with (which includes some other health expenditure such as part of ACC’s
demand. Despite all of this, we funding), commissioned by the Labour Party in 2017, showed a $2.3
will get up tomorrow and come billion gap in real Core Crown Health expenditure between 2009/10
back to work – and the system and 2017/18. Infometrics used Treasury’s modelling for calculating
knows that we will – because real health costs.14
we put the care of our patients Successive years of funding shortfalls specifically for Vote Health have
before ourselves, even if that been well documented in the annual analyses of the Government’s
will eventually break us”. Health Budget undertaken by the Council of Trade Unions and ASMS.15
In 2009/10 Vote Health operational expenses were 6.28% of gross
General medicine specialist domestic product (GDP), which had dropped to 5.60% of GDP by
2017/18 and are forecast to be 5.73% (of forecast GDP) in 2018/19
and again in 2019/20 (Figure 8). For Vote Health operational
expenditure to match 6.28% of GDP in 2019/10, it would have needed
a further $1.7 billion in this year’s budget.
When total public health expenditure is considered, including health-
related expenditure by local government and all central government
agencies such as Corrections, Education, Social Development etc, total
health expenditure was 7.8% of GDP in 2009/10, dropping to 7.4% in
2017/18. This is the figure for total government health expenditure
reported by the OECD. Total government health spending in countries
with traditionally strong policies supporting well-being (eg, Denmark,
Norway and Sweden) averaged just under 9% of GDP in 2018.
6.8% Core Crown Health as % GDP
Vote Health as % GDP
6.6%
Forecast % GDP
6.4%
6.2%
Percentage of GDP
6.0%
5.8%
5.6%
5.4%
5.2%
5.0%
2010 2011 2012 2013 2014 2015 2016 2017 2018 2019 2020
June Years
Source: Treasury FIGURE 8: CORE CROWN EXPENSES AND HEALTH VOTE AS % OF GDP
16 HOSPITALS ON EDGE NOVEMBER 2019Actions for the Government “Some days it is really hard.
Some days you can see the
• To reduce pressure on hospitals, get serious exhaustion in your colleagues’
about integrating care eyes, they are near tears but
To reduce pressure on hospitals, a ‘systems approach’ is needed, hold it together until they can
as well functioning community-based services are dependent on escape the building. Sometimes
well functioning hospital services and vice versa. Strong integration they hide in their office until
between hospital services, primary care and social services, is they can compose themselves to
urgently needed to provide a good patient-centred continuum face the next patient, the next
of care. The ‘Canterbury Initiative’, which includes many of the student or the next colleague
features considered important to integration, has been recognised who has a question. You want
internationally as a rare example of how to successfully implement to be able to tell them to go
changes to achieve better community-hospital care integration. Look home, take some time, rest. But
no further. there is no-one to do their work
and so many are in the same
For further information on integration visit: https://www.asms.org. position we can’t afford for
nz/wp-content/uploads/2019/08/Research-Brief-on-integrated- anyone to drop their load”.
care_172441.2.pdf
https://www.asms.org.nz/wp-content/uploads/2019/03/Research- General medicine specialist
Brief-on-primary-prevention_170857.2.pdf
• Support staff to flourish rather than simply
survive each day
The Health and Disability System Review Interim Report, quoting
W Edwards Deming, acknowledges: Nobody goes to work to do a
bad job … Put a good person in a bad system and the bad system
wins, no contest. It adds: “The New Zealand health system is full of
passionate and caring ‘good people’ who are doing the best work
they can within the constraints and challenges the system presents
to them daily.” In order to “unlock and unleash the capabilities of
all those good people to improve the health and wellbeing of all
New Zealanders”, it suggests improvements in digital technologies
are needed. Inadequate digital technology is a major frustration
that needs addressing but an even more important need is to
unleash the health system’s considerable ‘intellectual capital’ - to
support staff to use their skills, knowledge and experience to drive
innovation, efficiency and collaborative working. This requires a
strong commitment to distributed clinical leadership that passes
control from one to many. This is widely seen as more effective than
traditional, top-down, hierarchical ways of operating.
For more on collective leadership, visit: https://www.asms.org.nz/
wp-content/uploads/2019/08/Research-Brief-Distributed-clinical-
leadership_172592.2.pdf
WWW.ASMS.ORG.NZ HOSPITALS ON EDGE 17• Address staff shortages to enable genuine
“We come to work because patient-centred care
we have made a commitment
If the goals are to provide the most efficient and cost-effective
to keep the system going for
health service based on the principles of high-quality patient-
those patients who can’t afford
centred care, this will not happen while frontline staff are expected
any other option. We come
to work continuously in a pressure-cooker environment, burnt out.
to work because we have to
The capacity for innovative change, to take on distributed leadership
believe that it might get better,
roles, and to engage with patients and families and whānau as
that someone will eventually
genuine partners in care is severely limited in current conditions.
start to listen to us and that
Addressing specialist shortages requires an extensive recruitment
health care access for all has to
campaign for overseas specialists and trainees, based on an
be provided.“
assessment of trends in domestic supply of new specialists and rates
of retirement.
General medicine specialist
For more on specialist workforce shortages visit:
https://www.asms.org.nz/wp-content/uploads/2019/01/Research-
Brief-on-SMO-workforce-needs-171201.2.pdf
https://www.asms.org.nz/wp-content/uploads/2019/06/Research-
Brief-specialist-workforce-projections-_172060.2.pdf
• Adopt responsible funding policies to match
policy aspirations
After two Budgets from this Government there is no real progress
towards restoring health funding to previous levels (which were
themselves far from adequate). Resources will always be limited,
but the Government is trying to do more with essentially the same
level of funding as the previous government, creating huge gaps in
health, education, welfare and conservation, among others. The
‘Well-being Budget’ may be a worthy enterprise but it is wracked
by under-funding. The New Zealand economy is in good shape
but the Government’s Budget Responsibility Rules, which severely
limit what can be spent on public services, need to be replaced
with principles consistent with improving wellbeing.
For more on funding, visit: https://www.asms.org.nz/wp-content/
uploads/2019/06/How-much-funding-is-needed-to-avoid-the-
condition-of-the-Health-System-worsening-2019.pdf
18 HOSPITALS ON EDGE NOVEMBER 2019• When planning to fix hospital buildings, talk with
those who use them “Two weeks ago, and I’ve
been working in DHBs all my
There have been suggestions that a central Crown agency with life – for the first time in a
capital management expertise is needed to overcome the problem management meeting –
of skills shortage in this area. Whatever approach is adopted, a I actually found myself welling
process of thorough and robust engagement is needed with clinical up with tears and I walked
staff and the community, as well as with DHB Boards. out. I just thought I can’t do
this anymore because we’re
just not moving forward”.
• More effort and urgency into addressing the
determinants of ill health
We support the Government’s aims to reduce poverty and improve Geriatrician
access to affordable housing. However, the wait for a state house is
reported to be at a record high and homelessness figures continue
to climb around the country. We note the latest statistics on
childhood poverty suggest that on some key measures things are
worse than previously estimated. Substantial further initiatives will
be needed to achieve significant and sustainable reductions in child
poverty. The evidence shows policies with the greatest impact on
reducing the need for hospital services relate to tax and regulation
aimed at reducing smoking and consumption of alcohol and
unhealthy foods.
• Start measuring and monitoring unmet need for
hospital care
As researchers have commented, if unmet need is not a measure of
the effectiveness of a health system, how do we really know how
well it is doing and how to improve it? Including relevant questions
on unmet need for hospital care in the New Zealand Health Surveys
would be a good start.
• What the health system does not need
• Restructuring
• Policies with 3-year focus
• Ideas imported from overseas out of context and not
transferable
WWW.ASMS.ORG.NZ HOSPITALS ON EDGE 19References
1. Clark D. Overloaded hospitals reach crisis point, Labour Party blog, 24 May 2017.
2. Considine J, Fox, K, Plunkett D, et al. Factors associated with unplanned readmissions in a major Australian health service,
Australian Health Review 43(1) 1-9, November 2017. https://www.publish.csiro.au/ah/AH16287
3. Freibel R. What do changes in readmission rates tell us about quality of care in the NHS? The Health Foundation, 27 April, 2018.
https://www.health.org.uk/blogs/what-do-changes-in-readmission-rates-tell-us-about-quality-of-care-in-the-nhs
4. Nuffield Trust. Hospital Bed Occupancy, updated 26 April 2019. https://www.nuffieldtrust.org.uk/resource/hospital-bed-occupancy
5. Jones R (2011) Hospital bed occupancy demystified. British Journal of Healthcare Management 17(6): 242-248
6. Inglis T, Armour P, Inglis G, Hooper G. Rationing of Hip and Knee Referrals in the Public Hospital: The True Unmet Need NZMJ,
2017; 130(1452):39–48.
7. Bagshaw P, Bagshaw S, Frampton C, et al. Pilot study of methods for assessing unmet secondary health care need in New
Zealand. NZMJ. 2017; 130(1452):23–38.
8. Assessing the demand for Elective Surgery amongst New Zealanders March 2016, commissioned by HFANZ and NZPSHA
9. ASMS. Taking the Temperature of the Public Hospital Specialist Workforce, August 2014. Available: https://www.asms.org.nz/
wp-content/uploads/2014/09/Taking-the-temperature-of-the-public-hospital-specialist-workforce-August-2014-FINAL.pdf
10. Chambers C. Superheroes don’t take sick leave; Health Dialogue, Issue No 11, ASMS, November 2015. Available: https://www.
asms.org.nz/wp-content/uploads/2015/11/Presenteeism_A5-Final-for-Print_164753.pdf
11. Chambers C, Frampton C. ‘Tired, worn-out and uncertain:’ Burnout in New Zealand public hospital senior medical workforce.
Health Dialogue, 2016. https://www.asms.org.nz/wp-content/uploads/2016/08/Tired-worn-out-and-uncertain-burnout-
report_166328.pdf
12. OECD. Health at a Glance, 2017
13. Sapere Research Group. Strategic Assessment: Investment in infrastructure to support ongoing provision of hospital services in
Dunedin: Report prepared for Capital Investment Committee, 2016.
14. Infometrics. Core Crown Health Expenditure since 2009/10, May 2017. https://d3n8a8pro7vhmx.cloudfront.net/nzlabour/
pages/8181/attachments/original/1496806582/2017_Estimated_Core_Crown_Health_Expenditure__May_2017.pdf?1496806582
15. Rosenberg B, Keene L. Did the 2019 Budget provide enough for health? Health Working Paper No 22, NZCTU/ASMS, 7 August 2019.
20 HOSPITALS ON EDGE NOVEMBER 2019WWW.ASMS.ORG.NZ HOSPITALS ON EDGE 21
You can also read