Housing in an ageing Australia: Nest and nest egg? - CEPAR research brief, November 2019 - CEPAR ...
←
→
Page content transcription
If your browser does not render page correctly, please read the page content below

Housing in an ageing Australia:
Nest and nest egg?

                    CEPAR research brief, November 2019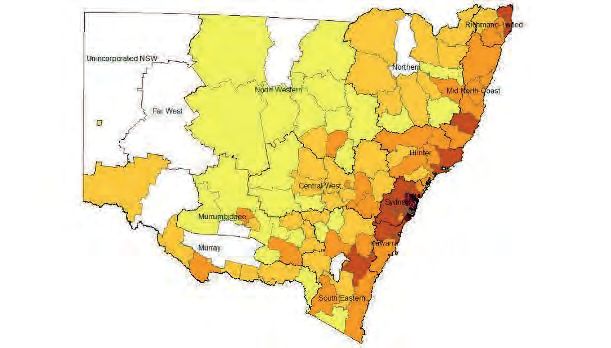
Cognitive
Housing in Ageing
           an ageing
                   and DeclineNest
                     Australia: | Trends
                                   and nest
                                         andegg?
                                              Im

 2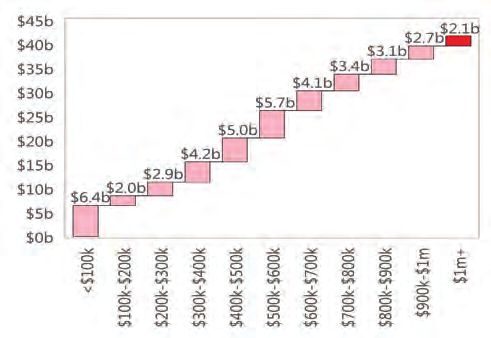
Summary of brief
Homeownership serves multiple purposes over the lifecycle: It acts as a home as well as a store of wealth to
guarantee financial security in retirement. Its lack in old age compromises security of both tenure and finances.
Much has been written about housing and homeownership. Here we apply the prism of population ageing,
leveraging CEPAR’s expertise to bring new insights to the topic.

Yes, homeownership appears to be in decline: Depending on the measure, total homeownership in Australia
currently ranges 59% to 70%. Across all measures, homeownership is down 3-4 percentage points in the last two
decades. Drops are led by young households of all incomes and middle-aged households with low incomes.

Yes, much of the decline may be due to declining affordability: Over the past 20 years, house prices grew
faster than household incomes. Common explanations point to cyclical as well as structural factors. These
include: (1) a surge in rental demand from new migrants (3.7m since 2000); (2) lower cost and greater allocation
of credit to investors, supported by tax rules (via negative gearing and capital discounts); and (3) a supply lag (of
about ten years between peak increase in demand and peak increase in supply, up from 3-5 years in the past).

Higher prices and lower borrowing costs have changed the dynamic: Across the income and house price
distributions, deposit hurdles increased while borrowing costs decreased (in the past two decades, years to save for a
hypothetical deposit for households with income in the second quintile buying a house in the second quintile of
prices increased from 4 to 6 years, but repayments were down from 44% to 36% of income). A low initial saving
hurdle in the past meant that house purchases functioned as a commitment device to save. It is less available now.

But declines in homeownership must be seen in a wider demographic context: The median age of first buying
a house decreased in the 1960s-70s as homeownership became widespread. It has since increased by 9 years from
1981 (from age 24 to 33). But deferral in homeownership accompanies delays in all other major life events over the
last half-century. These include a delay in the median age of getting a first job (2 years), finishing education (5 years),
having a child (7 years), getting married (8 years), and dying (12 years). Deferring their first home purchase by 9
years would still probably see younger generations enjoy homeownership longer than their parents.

Indefinite deferral of home purchase has consequences: Lifetime homeownership rates will decline if some
people defer indefinitely. Banks may be reluctant to lend past a certain age given retirement ages are increasing
more slowly (by 3 years over the past 50). Greater shares may retire with debt (36% of homeowners do so now).
Some receive help for home deposits from parents (but higher gifts go to those with higher income). Modelling
suggests that there is no imminent wall or wave of bequests in sight and that bequest recipients are getting older.

Demographic change may make things easier: In the short-term, demand for housing is expected to remain
strong, so supply declines are concerning. Over the long term, base projections see a shallow deceleration in growth
of demand, but the range of possible outcomes is wide. Also, cross-country variation in house prices and
demographic change suggest that population ageing could weigh prices downwards.

In the meantime, the retirement income system is failing renters: The continued exclusion of the home from
the means test, undifferentiated Age Pension payments, and rent assistance levels that are pegged to the wrong index,
results in a wide financial gap between renters and owners. The system review reporting in 2020 is an opportunity to
narrow this gap. While super is important for young, low-income households, we are yet to understand how much it
constrains their investment in housing. The two are complements. Super is more liquid in retirement while housing
investment can be leveraged and therefore results in greater wealth accumulations when prices are rising.

Older renters continue to experience significant vulnerability: Often-quoted figures that old-age poverty in
Australia is high, are inaccurate. But new estimates, that take account of housing, suggest that older Australian renters
have among the highest relative poverty rates in the OECD. They also have greater rental affordability stress than
other age groups. While increases in measured homelessness among older women were due to greater numbers in
this age group rather than higher incidence, their increased use of homelessness services was disproportionate.
Cognitive
Housing in Ageing
           an ageing
                   and DeclineNest
                     Australia: | Trends
                                   and nest
                                         andegg?
                                              Im

      Summary of featured CEPAR research
      Income and house prices: Modelling shows that an extra dollar of income increases house prices in NSW by
      more than a dollar and that price sensitivity increased with proximity to Sydney (Box 1).
      Deferral of homeownership: Research found little indication that homeownership fell for Generation X. Later
      rates of marriage were a key driver of homeownership delay (Box 2). Analysis of trade-offs between renting and
      buying shows that initially renters do tend to consume more than owners, but that this reverses (Box 4).
      Migration and housing: Recent and temporary migrants tend to rent apartments (about 75% of long-term
      temporary arrivals rent). Increases in migration are likely to therefore overstate homeownership declines (Box 3).
      Demography and house prices: Higher house prices were observed in countries and periods where shares of
      prime-age workers were higher. An estimated 7% of the increase in real house prices in Australia between 1970 and
      2015 was due to changes in age structure. Projections suggest a reversal in the future (Box 5).
      Housing bubbles and macroeconomic risks: Studying the bursting of the US housing bubble shows that a key
      contagion channel was the reappraisal of risk rather than the wealth effect on homeowner balance sheets (Box 6).
      Supply response: NSW regions have higher housing supply responses than Sydney but are still relatively low given
      fewer land constraints. Councils appear inhibited by State rules (Box 7).
      Treatment of assets in the means test: It’s possible to combine Age Pension means tests by having them separate
      but applied consistently. Exempting the home in the test is shown to inhibit downsizing, but effect is small (Box 8).
      House purchase triggers re-evaluation of retirement finances: Super contribution behaviour changes around
      the time of taking out a mortgage. Owner-occupier mortgagors appear to increase super contributions while
      investors rebalance toward property. Buying a house also increases interactions with super (Box 9).

      Wealth accumulation in an ageing society: Ageing alongside greater Age Pension means testing can result in
      greater private asset accumulations and lower pension spending, driven by longer-lived high-income groups (Box 10).

      Downsizing: People over 55 downsized: (1) because the house was too big; (2) to be closer to family; (3) for
      lifestyle; (4) because the yard was too big; and (5) to alleviate financial stress. Older people were less likely to regret
      their decision of moving to a smaller place compared to those who downsized at younger ages (Box 11). Half of
      older women are choosing to age in place, but many live alone. Changes are often due to health concerns (Box 19).

      Retirement products: A reverse mortgage on a CBD house is riskier and should attract a higher risk premium.
      Lump-sum reverse mortgages are more profitable and less risky to providers than income stream products,
      explaining why the former dominates most markets (Box 12). Explaining reverse mortgages well can raise interest
      in them (Box 13). The more wealth is in one’s home, the more optimal it is to annuitise the remaining wealth since
      home equity acts as a form of precautionary savings to cover healthcare expenditure and as a bequest (Box 14).

      Bequests: Property made up 70% of assets of those dying aged 65-84. Research confirms that bequests are being
      delayed as life expectancy increases (Box 15). Pensioners hold on to assets rather than spending them to maximise
      pension income (Box 16).

      Adapting housing and neighbourhoods: Research shows that housing stock is ill-equipped to meet older people’s
      needs with respect to safety and accessibility measures (Box 17). Key modifications would prevent falls at home if
      discharges from hospital involved an occupational therapist home visit; simple exercises also help (Box 18). Mental
      health and venturing beyond the home (e.g., by being able to drive) were positively correlated (Box 20).

      Who can expect financial hardship in old age, and for how long? Single older women with low education who
      rented their home could expect to live 7.7 years of retirement in financial hardship (e.g. unable to heat the home,
      missing meals, or pawning items). Hardship expectancy for women with similar characteristics but who owned their
      home was half that (Box 21). Older renters are likely to have less family support and more depression (Box 22).
Contents
Introduction 1
Part 1: Housing purchase in working age 2
1.1 Homeownership trends 2
1.2 Housing market trends – explaining house price appreciation and its impact 4
Box 1: The relationship between income and house prices 8
1.3 Demographic trends: Living longer, leaving it longer 9
Box 2: Homeownership deferral among Generation X 11
Box 3: Migration and housing: More flats, more renting 11
Box 4: At what age should you buy a house? Weighing up the risks 12
1.4 International trends 13
Box 5: Cross-country evidence on demography and house prices 15
1.5 Policy trends affecting tenure in the private market 16
Box 6: Housing bubbles and macroeconomic risks 18
Box 7: Supply response: Comparing Sydney with regional areas 19
1.6 Where to next? Projecting housing demand 20
PART 2: Housing consumption in old age 22
2.1 The fourth pillar of the retirement income system 22
Box 8: Treatment of assets in the means test 24
Box 9: How buying a house triggers a re-evaluation of retirement finances 25
Box 10: The accumulation of wealth in an ageing society 26
2.2 Housing within the retirement asset portfolio 26
2.3 Housing and inequality 29
2.4 Housing equity withdrawal 30
Box 11: The psychology of downsizing 31
Box 12: Reverse mortgages: Providers’ point of view 33
Box 13: Reverse mortgages: Consumers’ point of view 34
2.5 Housing to pay for aged care 34
Box 14: Housing as a form of insurance: Analysing the risks 35
2.6 Housing bequests and other transfers 35
Box 15: Housing consumption by age and economy-wide bequest modelling 37
Box 16: Bequest patterns of Age Pensioners 38
2.7 Alternative ways to consume housing 39
Box 17: Adapting housing to ageing needs 41
Box 18: Preventing falls at home 42
Box 19: Housing pathways of older women 43
Box 20: Age-friendly cities and neighbourhoods 44
PART 3: Housing lack in old age 45
3.1 Who are older renters? 45
3.2 Housing vulnerability 46
Box 21: Who can expect financial hardship in old age, and for how long? 49
Box 22: Housing tenure and healthy ageing 53
3.3 Tenure risks and ageing in place as a renter 54
3.4 Housing policy approaches 54
3.5 Policy addressing housing lack in old age 56Cognitive
Housing in Ageing
an ageing
and DeclineNest
Australia: | Trends
and nest
andegg?
Im
Introduction
In Australia, the topic of housing occupies many a newspaper column, barbeque conversation, and research report.
Just over half (or $6.3t) of Australian household wealth is stored in housing, distributed across 10.3m residential
dwellings, which are among the most expensive in the world (Demographia 2018; AFR 2019). The family home
not only fulfils everyday needs as a shelter and a place for family and social relations but can also act as a store of
value and guarantee financial security in retirement – it is both nest and nest egg. Yet the same cannot be said about
those who rent their home in retirement. For them, security of tenure and finances is often lacking.
Housing outcomes therefore affect financial and personal health and wellbeing over the lifecycle. And as lifespans
increase and Australia’s population ages it is important to continue to examine the interactions between
demography and housing. This research brief explores the current state and projected future of such interactions,
marrying policy developments with the latest data and research, particularly from CEPAR researchers. The brief
complements previous CEPAR research briefs, including a series on retirement incomes in Australia and on aged
care in Australia. In fact, homeownership is often considered as another pillar of the retirement income system, in
addition to the Age Pension, and mandatory and voluntary superannuation. Much has been written about housing,
so the aim here is to apply CEPAR’s expertise in demographic change to bring new insights to this complex topic.
This brief is in three parts. It first tackles the dynamics of the housing purchase in working life, describing the patterns
of housing tenure across generations, demographic and market dynamics, the likely future effects of demography
on housing demand, and the policies that can affect home purchase outcomes, particularly taxes. In part two, the
brief considers housing consumption in old age, discussing the retirement income context, the value and distribution of
housing wealth, the preference of older people for remaining in their community, and how older people bequeath
or can make better use of the equity in their home in retirement. Finally, part three tackles housing lack in old age,
describing the implications and vulnerabilities that arise from renting in retirement. Overall, the brief provides a
broad stocktake of research that touches on many different areas of housing-related policy.
This account comes in the context of other reviews. The Senate Select Committee on Housing Affordability in Australia
reported in 2008 and found that affordability was at a record low, setting the groundwork for the National Affordable
Housing Agreement to improve housing outcomes (see Section 3.5). The House of Representatives Enquiry into
Homeownership concluded in 2016 that challenges were isolated to Sydney and Melbourne and that the main form
of intervention should be to boost supply – a role for state governments – and that banking oversight was preferred
over tax changes to control excessive investor activity – a role for the prudential regulator. The Productivity
Commission released a 2015 report on the housing decisions of older Australians, which identified policy gaps
such as on equity release products (see Section 2.4). Other notable reports include those produced by CEDA
(2017) which looks at trends; Grattan, who reviewed housing taxes and housing affordability (Daley and Wood
2016; Daley and Coates 2018a); and AHURI, including Ong et al. (2019), who produced sophisticated future
projections of tenure and demand for transfer payments. Finally, the Commonwealth is expected to take account
of housing in a new review of the retirement income system.
1A Housing makes up over half of household assets 1B There are 10.3m residential dwellings, with 3.2m in NSW
Other fin., TAS, NT,
$0.8t, 6% Equities, ACT, 0.5m, WA,
$1.0t, 8% 5% 1.1m,
11% NSW, 3.2m,
SA, 0.8m, 31%
7%
Super, $2.7t, Dwellings,
22% $6.3t, 52%
QLD, 2.1m,
20% VIC, 2.7m
Cons. Deposits, 26%
durables, $1.1t, 9%
$0.3t, 3%
Note: 1A is for June 2019; 2B is for 2016 and includes about 1m unoccupied dwellings. Source: Authors’ analysis of RBA and ABS data.
1Part 1: Housing purchase in working age
1.1 Homeownership trends
Homeownership rates in Australia have gone through three distinct phases. An initial increase in the post-war
years, a broadly stable level between 1970 and 2000, and a decline over the last two decades (Figure 2A).
Estimates of homeownership differ – even within this report, which draws a wide net to take in varied research
based on different methodologies. Still, for an informed discussion on the topic, it’s worth getting to grips with
and testing assumptions about: (1) who is counted; (2) whose tenure is observed; and (3) the data sources.
Homeownership rates can be based on counting either households or persons (adults or all persons) and whether
we measure ownership at household level (i.e., the owner lives there) or person level (i.e., the person or partner
own the home). Counting households with tenure at the household level is most common but can obscure changes
in homeownership if the household composition changes. For example, if more young adults live with their parents
who own the house, homeownership would go up, all else equal. It could thus understate recent declines in total
homeownership. Similarly, counting the proportion of persons who live in houses by their household tenure may
mislead. The better measure is the proportion of people who legally own the property in which they live (i.e.,
counting persons according to person tenure, not household head’s tenure).
The Census has the largest sample and historic scope, but the information collected is limited, infrequently
collected, and comes with a long lag. It only records tenure at the household level, so it is not possible to estimate
the share of people who are owners (but see McDonald 2019 for an alternative approach using Census data). The
other sources of data are the Survey of Income and Housing (SIH) that dates from the 80s, and the Household,
Income and Labour Dynamics in Australia (HILDA) Survey, since 2001. Though smaller in sample size, these
sources provide more information about households and ownership status and are more frequently undertaken
(SIH is bi-annual; HILDA is annual but collects legal tenure information every four years).
As shown in Figure 2A, each permutation results in different rates of homeownership, with results ranging from
59% to 70%. Nonetheless, taken together, it becomes very clear that the last two decades have seen drops in
homeownership tenure no matter how it is defined and measured, of between three and four percentage points.
Homeownership by age and income
Ownership drops were led by younger generations for the last two decades as illustrated in Figure 2B across different
measures using a consistent data source (SIH). Ownership over the period fell by as much as 9 percentage points for
the 30-34 age group. Drops are greater since 2003: 17 percentage points for ages 25-29 (drops since 1981, not shown
here, are greater still; see Yates 2017, Ong 2017, Daley and Coates 2018). To a lesser extent, it appears older age
groups are beginning to be affected too. Any permanent declines in a cohort’s homeownership rate will take a long
time to appear among the oldest ages. Those who are aged 65 and over are likely to have bought their house before
any major shifts in homeownership rates started. If trends continue, more people will retire without a home (Ong et
al. 2019; Daley and Coates 2018b). In the meantime, longer life expectancies and lower fertility mean that older
cohorts are affecting the population-wide homeownership rate in an upward direction.
On a methodological point, it’s noteworthy that measuring ownership of households by age of household head is
a good approximation of counting actual owners. This is because the calculation excludes younger people living
with their parents and therefore unlikely to be counted as household head.
The data is broken down further in Figure 2C, showing trends by age and income, in thirds of the population-wide
distribution (a simplification from common quintile splits). It shows that ownership declined across all income groups
at younger ages. But declines among middle-age low-income individuals are stark compared to middle- and high-
income people of the same age. It exposes a widening gap between those on high and low incomes by ages 45 to 60.
2Cognitive
Housing in Ageing
an ageing
and DeclineNest
Australia: | Trends
and nest
andegg?
Im
HOW HAS HOMEOWNERSHIP CHANGED?
2A There are many ways of measuring homeownership, but by every measure ownership is down since early-2000s
Housing ownership by: (1) whether we count population of persons, adults, or households; (2) whether we measure ownership at
75% household level (i.e., owner lives there) or person level (person or partner own the home); and (3) by survey, 1950-2018
72%
Adults with HH tenure (Census), 69.5%
69% Persons with HH tenure (SIH), 69.1%
Persons with HH tenure (HILDA), 68.6%
HH with HH tenure (Census), 67.5%
66% HH with HH tenure (SIH), 66.2%
HH with HH tenure (HILDA), 64.9%
63%
60% Persons with person tenure (SIH), 60.4%
Persons with person tenure (HILDA), 58.7%
57%
1950 1960 1970 1980 1990 2000 2010 2020 2030 2040
2B Declines have been greatest at younger ages: Down as much as 13pp for ages 35-39 over last 20 years
Proportion of homeowners in age group (SIH-based), 1997-2016, by measure:
persons with tenure of household, persons with tenure of person, households by age of hh head with tenure of household
90%
80%
70%
60%
50%
40%
30%
20%
10%
0%
1999
2002
2005
2008
2011
2014
1999
2002
2005
2008
2011
2014
1999
2002
2005
2008
2011
2014
1999
2002
2005
2008
2011
2014
1999
2002
2005
2008
2011
2014
1999
2002
2005
2008
2011
2014
1999
2002
2005
2008
2011
2014
1999
2002
2005
2008
2011
2014
1999
2002
2005
2008
2011
2014
1999
2002
2005
2008
2011
2014
1999
2002
2005
2008
2011
2014
1999
2002
2005
2008
2011
2014
20-24 25-29 30-34 35-39 40-44 45-49 50-54 55-59 60-64 65-69 70-74 75+
2C There are distribution differences – declines are more pronounced among young, low income groups
Proportion of homeowners (SIH-based counting persons with tenure of person), 1997-2016, by position in income distribution:
low income, middle income, top income
90%
80%
70%
60%
50%
40%
30%
20%
10%
0%
1999
2002
2005
2008
2011
2014
1999
2002
2005
2008
2011
2014
1999
2002
2005
2008
2011
2014
1999
2002
2005
2008
2011
2014
1999
2002
2005
2008
2011
2014
1999
2002
2005
2008
2011
2014
1999
2002
2005
2008
2011
2014
1999
2002
2005
2008
2011
2014
1999
2002
2005
2008
2011
2014
1999
2002
2005
2008
2011
2014
1999
2002
2005
2008
2011
2014
1999
2002
2005
2008
2011
2014
20-24 25-29 30-34 35-39 40-44 45-49 50-54 55-59 60-64 65-69 70-74 75+
Note: HH denotes household. Person level tenure is effectively income unit tenure (i.e., for minors, the person tenure is their parents’ tenure). Household tenure
tends to overstate the share of owners because non-owners are either counted as owners in the case of ‘counting persons’ or ‘counting adults’ or are omitted
altogether in the case of ‘counting households’. Ownership of investment property is excluded from analysis (renter investors make up less than 2% of people).
Income groups are based on thirds of population-wide distribution of equivalised household income (not within age group). Pp denotes percentage point. Source:
Authors’ analysis based on ABS Census, ABS SIH, and HILDA.
3Drivers of decline in homeownership
Various, well-rehearsed explanations for the decline in homeownership trend have been offered (McDonald 2003;
Yates 2011; Yates 2015; RBA 2015; Yates 2016). These can be grouped into: (1) unaffordability due to high house
prices; (2) growing inequalities (both via market income and the simultaneous rise in lone person and double
income households); (3) housing stock drivers (e.g., housing supply that doesn’t suit couples without children who
rent instead); (4) structural renting and changes in preferences (based on preferences for current consumption or
changes in lifestyles; e.g., with labour markets becoming more fluid, requiring greater mobility, or with relationships
more likely to break down and lone households becoming more common. These are more likely captured at point
of observation while not necessarily affecting lifetime house acquisition); (5) fluctuations in population shares of
migrants, since recent and temporary migrants tend to rent; and (6) other demographic drivers (e.g., just a deferral
of purchase by young versus reweighing of population toward older people who have higher ownership rates).
Two of these drivers are described in more detail next. One that is probably the most commonly cited reason: that
house prices, driven by market trends, have become unaffordable; and one that is less commonly considered: that
trends reflect demographically driven deferral of home purchase. An additional, seldom quoted driver, tackled in
Section 2.1, could be the evolution of the retirement income system reforms over the last 30 years, whereby a
generation subject to mandatory super savings has chosen or been forced to delay investing in housing.
1.2 Housing market trends – explaining house price appreciation and its impact
As shown in Figure 3A, the backdrop to declining homeownership rates has been a series of cyclical booms in
house prices. In the last two decades, the house price index has roughly doubled in real terms, even after adjusting
for improvements in the quality of housing stock and despite some market corrections (e.g., around the Global
Financial Crisis and more recently). Between 1970 and the peak in 2017 real house prices quadrupled.
By contrast, the cost of building a house remained flat and net disposable household income per capita increased at
an enviable but a far lower rate of 27% in real terms (Figure 3A). Price growth has exceeded household income
despite a boost in incomes from more female earners, and even if one compares price and incomes by city (Fox and
Finlay, 2012). The decoupling of price from income is a key hurdle for those saving up for a home deposit which
now requires a greater number of years of savings (Simon and Stone 2017).
Such price increases came in a line of housing cyclical booms and busts in Australia since the 1950s (Stapledon
2012). House price appreciation across developed countries, particularly in bigger, coastal, geographically
constrained, high-amenity cities, has been typical in recent decades (Andrews 2010; Stapledon 2017). In Australia
Sydney and Melbourne led the recent boom (as well as price declines since a peak in 2017; Figure 3B).
As with any market, the price of housing is determined by drivers that affect the underlying supply and demand
(see for example: Otto 2007; Hatzvi and Otto, 2008; McLaughlin 2012; Carrington 2019). Here four commonly
identified drivers are summarised: (1) population; (2) credit; (3) supply response; and (4) income.
Population
Firstly, as with delayed homeownership itself, changes in population factors have played a key role. Between 2000
and 2019, Australia’s population grew by over six million: an average annual growth rate of 1.5% (Figure 3C) –
above the 1.2% average over the previous two decades and three times the OECD average (UN 2019).
Just over 40% of this population change over the 20 years to 2019 was based on the natural increase of births
minus deaths. The rest, about 3.7m, was due directly to an unexpected surge in inward migration which was
moderating what was to be a rapid period of population ageing (note that migrants also affect the natural increases
since they have children; see also Chomik 2015 about revisions to official population projections). In fact, the
demographic outcome was that there were two ten-year age groups that saw the greatest gains: groups aged 20-29
(newly arrived migrants) and 60-69 (newly retiring baby boomers), each gaining about a million people.
4Cognitive
Housing in Ageing
an ageing
and DeclineNest
Australia: | Trends
and nest
andegg?
Im
The increase in the number of people, especially among younger households, would naturally drive demand for
houses. But recent and temporary migrants tend to rent (see Box 3). Indeed, temporary migrants make up about
17% of Australian residents aged 20-29, and this increased over time. So, a key transmission channel between
population growth and house prices in Australia may act via the rental market (Saunders and Tulip 2019). The
influx saw greater competition for rentals, with vacancy rates more than halving from a high of 4.2% in 2002 to a
low of 1.7% by 2007 (it has moderated since). In large part this was due to demand for locations close to inner city
jobs and inadequate transport infrastructure from outer areas (Yates 2011). Rents consequently rose, sending a
price signal that housing demand was exceeding supply, especially in the migrant hotspot of Sydney (Figure 3D).
This may have been enough impetus for buyer demand given the right credit conditions. The rental channel may
also explain why there were lags between changes in population, house prices, and supply responses.
Credit
The second major driver of demand was the deregulation of banking which allowed more people to access credit
and a low-inflation-low-interest environment that reduced its cost (Ellis 2005, 2006; Figure 3E). That is, an
expectation of lower long-term interest rates could push prices up even in the absence of rental price changes.
Indeed, as has been the case in other advanced economies with similar credit conditions, housing credit in Australia
has more than tripled since 2000 (Figure 3F). But the distribution of credit was uneven. Owner-occupiers lost
share to investors who were attracted by future rental and capital gains and first home buyers lost share to up-
graders with greater borrowing capacity (each ratio has recovered slightly by mid 2019; Figure 3G).
Australian tax arrangements (explained further in Section 1.5) may interact with investor sentiment and play a pro-
cyclical role rather than dampening the business cycle. Even as rents were going up, gross rental yields – a function
of rent and price – were flat or declining (Figure 3H; some cities saw increases in yields on units between mid- and
late-2000s, but still well below pre-2000 levels). The ever lower rental yields didn’t deter investors with access to cheap
credit and expectations of capital gains – an outcome partly facilitated by the tax system and loose monetary policy.
That is, investment costs in excess of rental income can offset other forms of assessable income, including earnings
(known as negative gearing), attracting non-institutional investors who speculate on capital gains. Institutional
investors, of which there are few in Australia, may be more likely to focus on rental yields (Milligan et al. 2015).
Capital gains in turn attract a 50% discount if the investment is held at least a year (a shorter period than in countries
with more stable housing markets such as Germany). The policy (introduced in 1999) might also favour short-
term investment since realising a gain later means greater taxes on illusory inflation gains. Empirical evidence
suggests that any such tax advantages are capitalised into housing prices (Andrews 2010).
Supply
The third commonly cited driver is housing supply, or rather, its delayed response. Much housing investment has
been from non-institutional, small-holder investors, which results in the bidding up of prices of existing properties
rather than building new ones. Some extra investment demand also came from foreign buyers (FIRB 2019). But it
wasn’t until about 2014 that construction commencements took off (Figure 3I) – almost a decade after both
population and prices first surged (See Box 7 on estimated supply responses in NSW). OECD analysis, based on
data up to 2009, suggests that the price responsiveness of supply in Australia is in the middle of the pack, behind
North American and Scandinavian countries (Sánchez and Johansson 2011).
The most obvious reason for a muted supply response is that land is in fixed supply (so it absorbs much of the
excess returns from higher prices) and the release of greenfield land has been limited. But there are other possible
explanations, including: (1) planning system impediments (e.g., uncertainty or delays with approvals); (2)
provision of infrastructure (e.g., absence, delays, or levy costs of utilities or lagging transport infrastructure); (3)
land ownership and geographical constraints (e.g., fragmented fringe land ownership, national parks, waterways,
particularly in Sydney); and (4) Public attitudes to infill development (e.g., affecting the planning process and
legal costs of challenges; Hsieh et al. 2012).
5WHICH MARKET TRENDS DRIVE HOUSE PRICE GROWTH?
3A For two decades, house prices grew faster than income 3B The price rise was often led by the Sydney market
$1.0m
400 Median house prices, by Sydney
Real index of house prices, 373
House prices capital city, 1970-2019 $872k
income, and, construction costs $0.8m
Melbourne
300 1970-2019 (1970=100)
Net disposable $0.6m Brisbane
income per capita Perth
200 190 $0.4m Adelaide $480k
Hobart
Construction costs
100 106
$0.2m
0 $0.0m
1970 1976 1982 1988 1994 2000 2006 2012 2018 1970 1976 1982 1988 1994 2000 2006 2012 2018
3C One driver was a rise in immigration and population 3D This pushed rents higher, especially in Sydney
500k
Annual change in estimated resident 451k Median weekly rent prices (3-bed houses), by capital city,
$600
population, 1972-2019 1982-2019 (2019 $)
400k Sydney
$500 $503
300k Natural increase $400
+ net migration Melbourne
200k Brisbane $342
$300 Adelaide
128k Perth
100k Natural increase $200
(births minus deaths) Hobart
0k $100
1970 1976 1982 1988 1994 2000 2006 2012 2018 1970 1976 1982 1988 1994 2000 2006 2012 2018
3E A second driver was cheaper, deregulated borrowing 3F …which resulted in a housing credit boom
20% 400
Owner-occupier interest rate, Real housing credit (index year 2000=100), 367
350
1970 to early-2019 1990-2019
15% 300
250
10% 200
Variable 150
5% 5% 100
4%
Fixed 50
0% 0
1970 1976 1982 1988 1994 2000 2006 2012 2018 1970 1976 1982 1988 1994 2000 2006 2012 2018
3G Though more credit went to investors… 3H …who pursued capital gain rather than rental yield
100% 12%
Credit and loan Gross rental yield (3-bed houses), by capital city, 1982-2019
shares by type, Owner-occupier share of 10%
80% Perth
1990-2019 housing credit Melbourne
66% 8%
60% Brisbane
6% Hobart
40% First home buyer share of loans
4% 3.5%
issued to owner occupiers
20% 19% Adelaide
2% Sydney 2%
0% 0%
1970 1976 1982 1988 1994 2000 2006 2012 2018 1970 1976 1982 1988 1994 2000 2006 2012 2018
3I A third driver was a slow response in housing supply 3J Housing now takes up more income, despite moderation
250k 35%
Housing supply (dwellings), 213k Housing interest payments and
1970-2019 Commencements 30% rent to income, by measure,
200k Actual rent 28%
1970-2019 as % of local
Completions 181k 25% median income
150k 20% 21%
15% Total actual and imputed rent to
100k net disp. income (National Acc.)
10%
50k Under construction 8%
5%
Total housing interest to net disp. income (National Acc.)
0k 0%
1970 1976 1982 1988 1994 2000 2006 2012 2018 1970 1976 1982 1988 1994 2000 2006 2012 2018
Note: All figures are annualised. 2019 figures not full year (e.g., housing supply data are based on first two quarters of 2019). Gross rental yields may be understated
since these are based on all median house prices not median rental house prices, which tend to be lower value. Imputed rent is included in 3J since owning is
analogous to investing money elsewhere and renting instead. Source: Authors’ analysis based on RBA, ABS, CoreLogic (2019), and REIA data.
6Cognitive
Housing in Ageing
an ageing
and DeclineNest
Australia: | Trends
and nest
andegg?
Im
Income
As noted, house prices have increased faster than incomes. Overall, the result of market trends has been that the
value of housing consumption in Australia is taking up more income than ever before (Figure 3J). But more income
is also being poured into housing. Based on National Accounts aggregates, about 21% of net household disposable
income is allocated to housing consumption, a figure that ticked up even as rents and valuations declined. Mortgage
repayments of about 8% of net disposable income are above the 5% average pre-2000, though below 2008 highs.
Higher incomes are capitalised into prices, as may be expected, but another argument could be that housing is
somehow different, and that in a rich, ageing society, much like healthcare, housing will simply attract a greater
share of the income pie (see Jaaskela and Windsor 2011 on superior goods; also see Box 1 on income elasticity of
house prices in NSW).
To understand the potential impact of house prices on affordability, it’s worth also looking at how the distribution of
house prices and purchase costs interact with the distribution of income. For whom are prices and costs unaffordable?
There are two key parts to this: being able to afford the deposit and being able to afford the mortgage repayments.
Deposit affordability is a function of incomes, the rate of savings from that income, the rates of return on those
savings, and finally house prices, which dictate the size of the deposit for a given loan-to-value ratio (taxes also add
a cost: see Section 1.5). Repayment affordability depends on income available to repay the mortgage, the value of
the purchased home and loan, and the mortgage rate on that loan. Each has changed over time.
To generalise, since house prices have increased and mortgage rates (as well as returns on saving) have decreased,
it has become harder to save for a deposit but easier to service a mortgage. This is illustrated in Figure 4A-4D by
looking at the distribution of income of young households against the distribution of all house values and the
prevailing interest rates.
It shows that the bottom quintile has to a large extent been locked out of homeownership in the past. In 1996,
they needed to save 5.3 years for a hypothetical 20% deposit for a house in the bottom quintile and over seven
years for houses in the next quintile.
Households in the second quintile from the bottom could save for a deposit for between 3 and 5.2 years to
purchase houses priced in the bottom to the middle quintile of houses. By 2016, the years it took to save for a
deposit increased to between 4 and 7.9 years. In fact, the middle quintile now faces a higher deposit hurdle than
the second quintile did twenty years ago.
Yet the opposite is trend appears with respect to mortgage costs. In the 1990s, homeowners in the middle quintile
wanting to pay less than 30% of their gross income on mortgage repayments had a choice of just 20% of houses. By
2016, they could access 40% of houses and stay below this benchmark. The second quintile had no option but pay
more than 30% in income in the past, now they can but only by buying the cheapest 20% of houses.
The analysis is illustrative – it ignores the spatial dimension and that cheaper homes may be far from jobs and
amenities and lacking in transport links. And it ignores the stress testing employed by lenders which will inhibit the
amounts loaned. There may also be some self-sorting of young people buying cheaper houses (e.g., second quintile
households by income buying houses in first quintile of prices). But it demonstrates the point that a key hurdle with
high house prices is saving up the deposit while mortgage costs are declining despite price rises, for now (see Figures
36E-F on actual mortgage stress trends, which indeed show declines among mortgagors).
The changed dynamic is significant. Based on behavioural finance and pension literature (Thaler and Benartzi 2004),
we know that the arrangement of a cheaper deposit but more expensive repayments in the past would have meant
that buying a house operated as a pre-commitment device to save, overcoming behavioural bias for current
consumption. Now, the higher initial savings hurdle means locking in future home equity savings has become harder.
7HOW DO THE HURDLES TO HOMEOWNERSHIP COMPARE OVER TIME?
4A In the past, it took fewer years to save for a deposit 4B Recently, this has become a greater hurdle
Years to save Years to save
for hypothetical 1996 distribution of house prices for hypothetical 2016 distribution of house prices
deposit 1996 Low Q2 Q3 Q4 High deposit 2016 Low Q2 Q3 Q4 High
Low 5.3 7.3 8.8 10.7 15.9 Low 7.3 11.1 14.0 18.8 33.6
income, age 25-45
income, age 25-45
1996 household
2016 household
Q2 3.0 4.3 5.2 6.5 10.4 Q2 4.0 6.2 7.9 10.8 20.1
Q3 2.3 3.3 4.0 5.1 8.3 Q3 2.9 4.5 5.8 8.0 15.2
Q4 1.8 2.5 3.1 4.0 6.7 Q4 2.2 3.5 4.5 6.2 11.8
High 1.2 1.7 2.1 2.7 4.7 High 1.4 2.1 2.7 3.8 7.3
4C But high rates in the past meant servicing was costly 4D Mortgage costs are now lower despite price hikes
Hypothetical Hypothetical
Mortgage as % of 1996 distribution of house prices mortgage as % of 2016 distribution of house prices
net income 1996 Bottom Q2 Q3 Q4 Top net income 2016 Low Q2 Q3 Q4 High
Low 63% 94% 119% 156% 290% Low 46% 72% 93% 130% 260%
income, age 25-45
income, age 25-45
1996 household
2016 household
Q2 30% 44% 56% 74% 137% Q2 23% 36% 46% 64% 128%
Q3 21% 31% 39% 51% 95% Q3 16% 25% 32% 45% 90%
Q4 15% 22% 28% 37% 69% Q4 12% 18% 24% 33% 66%
High 9% 13% 17% 22% 41% High 6% 10% 13% 18% 36%
Note: Analysis is illustrative only. House price distribution is based on values of all owner-occupied houses in given year in the ABS SIH. Income is for households
aged 25-45 in the same survey. Years to save for a 20% deposit is based on saving 20% of net income, which attracts an interest rate of 7.5% in 1996 and 1.5% in
2016, based on cash rate. Note that loan-to-value ratios were commonly higher in the past. Mortgage rates on 80% of house value are assumed to be 10% in 1996
and 5% in 2016 based on RBA data and apply to a 30-year mortgage. Source: Authors’ analysis based on ABS and RBA data.
Box 1 CEPAR research spotlight The relationship between income and house prices
Higher incomes often lead households to spend more on bigger, higher quality, better located, and more
expensive houses. Economists describe this relationship as the income elasticity of demand. So, what is the magnitude
of the relationship and does it differ by location and time?
In Liu (2019), former CEPAR Research Fellow Xiangling Liu analysed data from 144 Local Government Areas
in New South Wales between 1991 and 2015. Using statistical methods such as multi-factor panel data modelling and
cointegration analysis, she found that the income elasticity of house prices across the state (which she uses as a
proxy for income elasticity of housing demand) was 1.07.
She also tested for causality and found that the transmission was from real incomes to real house prices. The
finding suggests that a dollar of extra income increases house prices by more than a dollar (though
simultaneously declining interest rates could also cause this effect). Furthermore, prices are more sensitive to
income in and around Sydney and less so in more remote areas (Figure 5A). Testing whether there were some
unexplained but common shocks across NSW reveals that prices did at times shift together, but there was also
some evidence of the presence of shocks led by Sydney that rippled out to nearby areas.
Finally, a cross-sectional analysis suggested that there were cyclical deviations from the equilibrium level of
elasticity of 1.07, but these were found to revert to the long run relationship.
5A Prices in Sydney are more responsive to income 5B Income elasticity of price can also differ over time
0.3
Income elasticity variation over time, 1991-2015
0.2 (average residual deviation)
0.1
0
Variation in -0.1
income elasticity
by LGA, 1991-2015
Darker colour=higher elasticity -0.2
Source: Liu 2019
8Cognitive
Housing in Ageing
an ageing
and DeclineNest
Australia: | Trends
and nest
andegg?
Im
1.3 Demographic trends: Living longer, leaving it longer
The increasing price tag of houses is the most cited reason for declining homeownership. But could demographic
forces play a role? It’s plausible that the same demographic shifts that have led to longer lives and the ageing of
the population also act to delay the typical age at which people are ready to purchase a home. If so, then perhaps
homeownership rates of younger cohorts now may yet reach the rates seen among older cohorts as the younger
cohorts age.
The idea is not new (see Box 2). But data from the last half-century can help us stand back and see the broader
demographic context in which to view changes in housing tenure.
Newly extracted data presented in chart 6, tracks the age at which half of the Australian population in a given year
attained specific milestones, for years 1966 to 2016. It shows that over this period the envelope within which we
live our lives – the median age at death – has extended by 12 years from 70 to 82.
Longer median lives are, in turn, associated with longer adolescence and later ages of leaving studies and starting
work. For example, the median age of starting any work was 16 in 1966, but 18 in 2016; and the age of starting full
time employment increased from age 16 to age 25 over the same period. Also, as is well documented (e.g., ABS
1994), the typical age at which women first become mothers increased by eight years over the last fifty years.
Marriage, which is associated with new household formation (see Box 2) increased by 4 years, to age 31.
The potential delay in house purchase sits in this context. In fact, house purchases were made later in life in the 1960s
(age 27), compared to the 1970s (age 24), before homeownership become more widespread. The typical age at which
people become homeowners has since shifted by 9 years, from 24 to 33. The typical age of paying off the mortgage
has also been deferred, from age 52 to age 62. While the typical age at which Australians leave the labour force has
surged by four years just since 2001, to age 64, the rate of increase has not matched changes in other life events. In
fact, it may need to increase further to accommodate later home purchases and delayed mortgage repayments.
The age at which the majority of the population start living alone – either through divorce, separation, widowhood,
or never having been married – increased by 10 years to age 83 (ages higher than median age at death indicate that
the event affects the majority of the remaining age group). Incidentally, divorce rates have declined since the 80s
(based on ABS Cat 3307.0) but they can reverse homeownership status – nearly a quarter of divorces result in
homeownership loss (based on HILDA; also see Wood et al. 2013 and Asher et al. 2017). Finally, while age of
disability hardly changed, entry into care is taking place later (age 85 in 2016, up 3 years since 1996); for many
people not at all (given lower median age at death).
The pattern is also apparent based on the average change per year (Figure 6B). For example, looking at changes
since 1981 (when homeownership rates first started declining) the annual delay in house purchase of 13 weeks per
year is only slightly higher than the delay in entering full time work and marriage (10 weeks per year) and less than
the average annual increase in median life at death (15 weeks per year).
It’s worth noting that this exercise is based on period rather than cohort measures. That means that each event is
based on what is taking place in a given year for each age group in that year and may not apply over an actual
lifetime. For example, the 34-year-old age group that attained majority homeowner status in 2016 will likely
experience deaths at a later age than the observed median age of death of 82 in 2016. As such, rapid increases in
age of events over time will overestimate the rate of events that tend to take place in earlier stages of life and
underestimate those that take place later in life. This implies that even a 9-year delay to homeownership could still
see younger generations enjoying homeowner status for longer than older generations did.
The other important caveat is that while the analysis captures the median, it omits the evident outcome that an
increasing minority, mostly low-income individuals, never attain homeownership (as noted earlier). Many obviously
also don’t follow the same lifecycle patterns of household formation described by the median. Future analysis will
break down the extent to which different socioeconomic groups have experienced similar delays.
9Other important questions remain. For example, to what extent will deferral result in catch up over the full lifecycle
given the large falls in homeownership at younger ages and the already apparent falls among ages nearing age 65?
This is still an open question. Deferring too long could lock people out of the housing market by inhibiting access
to mortgages that commonly last for 25-30 years, even if they intend to work to later ages. If trends continue, they
will indeed work much longer than past generations. Existing projections are pessimistic about catch up (Ong et
al. 2019; Daley and Coates 2018b), but seen against the wider demographic context, homeownership decline at
younger ages does not appear out of the ordinary.
WHAT IS THE DEMOGRAPHIC CONTEXT FOR DEALYED AGE OF FIRST HOME PURCHASE?
6A Deferred entry into homeownership is in line with deferral of other life events over the last 50 years
Median age at which life event occurs in given year, 1966-2016
90
85
83 82
80 82
76 76
70 73
64 70
62 61
60
52
50
Age
40
33
31 31
30 27
25
22 23
24 24
20 18
16 17 16
10
0
1971
1981
1991
2001
2011
1971
1981
1991
2001
2011
1971
1981
1991
2001
2011
1971
1981
1991
2001
2011
1971
1981
1991
2001
2011
1971
1981
1991
2001
2011
1971
1981
1991
2001
2011
1971
1981
1991
2001
2011
1971
1981
1991
2001
2011
1971
1981
1991
2001
2011
1971
1981
1991
2001
2011
1971
1981
1991
2001
2011
Get first job Finish Get first ft Have first Get Buy first Pay off Leave Become No longer Enter aged Death
education job child married house mortgage labour disabled married care
force
6B Life expectancy is increasing faster than the age of buying one’s home
18
Average annual delay of median age at event (weeks), 1981-2016
16 15 15
14 13
12
12
10 10
10
Weeks per year
9
8
8 7
6
6
4
2 1
0
0
Get first Finish Get first ft Have first Get Buy first Pay off Leave Become No longer Enter aged Death
job education job child married house mortgage labour disabled married care
force
Note: The median age here is a period measure and represents the age at which over 50% of a population in a given year attain a given event. Age of house
purchase and outright ownership based on ages of household head and household ownership tenure; age of having a child based on female population; other
measures based on persons. ‘No longer married’ category is based on legal marital status so may be understated. Outright ownership, disability, and aged care data
are since 1981, 1988, and 1996, respectively. Source: Authors’ analysis based on ABS Census, customised ABS data, ABS SIH, and customised AIHW data.
10Cognitive
Housing in Ageing
an ageing
and DeclineNest
Australia: | Trends
and nest
andegg?
Im
Box 2 CEPAR research spotlight Homeownership deferral among Generation X
Whether homeownership declines are a matter of unaffordability over the lifecycle or comprise demographically
determined delays in house purchase is not a new debate. If the latter effect dominates, then the implication is
that policy responses can be more measured. The answer is not simple, since there is evidence of both effects.
CEPAR Chief Investigator Peter McDonald has looked extensively at delays in marriage and childbearing
patterns (McDonald 1994) and pioneered the modelling of household formation now used by the Australian
Bureau of Statistics to project household numbers which requires a decomposition of such time trends
(McDonald and Kippen, 1998). He also made use of such techniques to look at housing. For example, in Baxter
and McDonald (2004), he showed how tenure evolved for the Generation X cohort. Once other characteristics
were considered, there was little indication that homeownership fell for those born up to 1974. In fact, this
generation were more likely to be homeowners than earlier cohorts, especially men.
The research also found that the biggest factor associated with homeownership was formal marriage, but that
controlling for marriage, the likelihood of homeownership decreased as the number of children increased, perhaps
because home purchase is delayed with more children. The analysis presaged the idea that increasing shares of the
population who never marry could lead to falls in homeownership (but that fewer children could see it increase).
Most importantly, trends for those who were in their 30s in the 1990s showed that delayed household formation
was a key factor determining homeownership, implying the potential of a catch up over the lifecycle.
Box 3 CEPAR research spotlight Migration and housing: More flats, more renting
Australia has always had a large inward flow of migrants who have continually influenced the country’s housing
landscape. Over the last decade migrants have had a particularly strong effect on population growth in Sydney,
Melbourne, and Perth. But even short-term migrants can affect the housing market and skew the cross-sectional
statistics that purportedly describe the typical Australian resident. For instance, overseas migrants are much
younger than existing residents – over 40% of inward migrants are in their 20s (ABS Cat. 3101.0).
CEPAR’s Chief Investigator Peter McDonald is Australia’s leading demographic expert on migration. In a paper
with Associate Professor Jeromey Temple and other colleagues, he conducted a scoping study of housing needs
of migrants and how they compared to the local population (Khoo et al. 2012). They found that migrants are
more likely to live in larger, often multiple-family households; temporary migrants are more likely to live in flats
and be renters (Figures 7A-B), which could overstate declines in homeownership at times of high migration);
and permanent migrants with longer duration of residence were highly likely to own houses. Of recent arrivals,
those from New Zealand and skilled migrants were more likely to pay higher rents than family and humanitarian
permanent migrants. Yet, perhaps unsurprisingly, skilled migrants were less likely to report affordability stress.
Migrants were also more likely to move to a new house (usually for work), creating greater churn in the housing
market than might otherwise occur.
7A Recent and temp. migrants are more likely to live in flats 7B They are also far more likely to rent
Dwellings by visa status and arrival, 2006: House, Semi, Flat Tenure by visa status and arrival, 2006: Own, Mort., Rent
100% 8% 8% 12% 13% 13% 14%
100%
11% 18% 18% 20% 27% 21% 24% 28%
13%
80% 17% 13% 14% 16% 33% 41% 80% 29% 35% 45% 50%
18% 22% 13% 57% 60%
6% 15% 28%
60% 60% 69% 74% 75%
14% 36% 50% 45%
40% 81% 79% 70% 73% 72% 70% 40% 44%
61% 65% 58% 67% 59% 43% 28%
20% 45% 20% 50% 36% 30%
33%
22% 24% 19% 22% 20% 18% 11%
11% 7% 9% 6% 9% 7%
0% 0%
Pre-1985
Perm. (Humanit.)
Perm. (Humanit.)
Pre-1985
Perm. (Humanit.)
Perm. (Humanit.)
Perm. (Family)
Perm. (Family)
Perm. (Family)
Perm. (Family)
Long Term Tem.
Long Term Temp.
Long Term Temp.
Long Term Temp.
Born in Australia
NZ Citizens
Perm. (Skilled)
NZ Citizens
Born in Australia
Perm. (Skilled)
NZ Citizens
Perm. (Skilled)
NZ Citizens
Perm. (Skilled)
Longer term arrivals Recent arrivals (2001-06) Longer term arrivals Recent arrivals (2001-06)
Note: Grey bars denote ‘other’. Source: Khoo et al. 2012.
11Box 4 CEPAR research spotlight At what age should you buy a house? Weighing up the risks
There is a natural trade-off between buying and renting. While renters can afford to spend more money in their
day-to-day life, owners may need to sacrifice some current consumption to benefit from greater housing wealth
in retirement. But the decision is complicated by various risks over the lifecycle that affect this choice. For a
start, the purchase decision depends on various labour market risks over one’s career that affect the ability to
save for a deposit and secure a mortgage. Even after a purchase, owners run the risk of seeing their wealth
eroded when house prices fall or when they want to run down some of their house equity. On the flip side,
those that keep renting face risks of being evicted (see section 3.3), seeing their rents rise, and falling into poverty
(see section 3.2).
CEPAR Senior Research Associate, Mengyi Xu, undertook a project to weigh up these risks and analysed the
impact of purchasing an owner-occupied home at different ages. In Xu (2017), she constructed a multi-period
model of consumption and investment decisions that are subject to labour market, asset-price, and rent-price
risks based on Australian settings. The model also uses consumption and asset allocation decisions based on
observed data (from Household, Income and Labour Dynamics in Australia survey, HILDA), which reflect an
average Australian's decisions in his/her age group and housing tenure. She found, for example, that renters
tend to have greater levels of consumption than owners, as could be expected (Figure 8A). This appears to lead
them to not only miss out on building up housing equity but, to a small extent, lower accumulation of financial
assets (i.e., lower investment in shares). And the difference of participation in the share market between renters
and owners increases with age.
Simulations are used to shed light on such dynamics. When households first purchase a house, they experience
large falls in non-house consumption, which lasts about a decade (Figure 8B). Yet by the time they get to
retirement, their wealth is simulated to be considerably larger (Figure 8C) despite super becoming the dominant
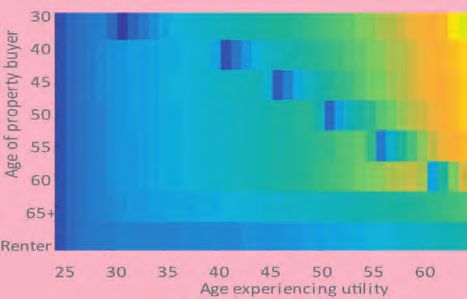
asset. The analysis also looked at impacts on risk-adjusted utility (certainty equivalent consumption). On the one hand,
the model suggests that purchasing earlier lowers lifetime utility from consumption while deferring to age 50
allows people to enjoy the benefits of becoming a homeowner at a lower cost. On the other, if people care about
wealth at retirement, then purchasing early is preferred (Figure 8D). These conclusions hold despite varying
levels of wealth, income, and rent, and tax treatment of different assets.
8A Renters tend to consume more than owners initially 8B Drops in consumption also evident in simulation
Ratio of median consumption to disposable income, by 90 Simulated average non-housing consumption
0.9
ŽŶƐƵŵƉƟŽŶ-disposable-ŝŶĐŽŵĞƌĂƟŽ
age of household head, showing data and fitted curve, paths for households that purchase properties
0.8 2006-2014 80
Non-ŚŽƵƐŝŶŐĐŽŶƐƵŵƉƟŽŶ($000)
at different ages
0.7 70
0.6 60
Age 60
0.5 50
Renters 40
0.4 Age 50
0.3 30 Age 40
Owners
0.2 20 Age 30
0.1 10
025 0
30 35 40 45 50 55 60 65 25 30 35 40 45 50 55 60 65
8C But buying early can result in greater wealth 8D The sweet spot is to defer disutility but not too much
Average simulated wealth at
retirement by age of home purchase,
$2.0m by asset: super, liquid assets, and
home equity
$1.5m
$1.0m
Simulated utility levels perceived
at age 25, by age of experiencing
$0.5m utility and age of purchase.
Darker colours = less utility
$0.0m
30 40 50 60 65+
Source: Xu (2017)
12You can also read