How CBO Adjusts for Underreporting of Means-Tested Transfers in Its Distributional Analyses
←
→
Page content transcription
If your browser does not render page correctly, please read the page content below
How CBO Adjusts for Underreporting of
Means-Tested Transfers in
Its Distributional Analyses                                                                             September 23, 2021

Presentation at the Bureau of Labor Statistics’
2021 Consumption Symposium

Bilal Habib
Tax Analysis Division

For more information about the conference, see www.bls.gov/cex/2021-consumption-symposium-agenda.htm.
Background

             1
Why Does CBO Adjust for Underreporting?
The Congressional Budget Office regularly produces a report on the distribution
of household income, means-tested transfers, and federal taxes.
For each report, the agency draws data on transfers from the Annual Social and
Economic Supplement of the Current Population Survey (CPS).
To analyze the distribution of means-tested transfers, CBO must have a
complete accounting of those transfers, with enough precision for quintile-level
distributional analysis.
2Underreporting of Means-Tested Transfers in the CPS
Percent
Housing Assistance
Overreporting
100
Underreporting Underreporting of
transfers in the CPS has
SSI increased over time.
80 Medicaid
60 Without adjustment,
SNAP
CPS-based analyses
would understate
40 income growth at the
bottom of the distribution
and the role of transfers
20
in reducing income
inequality.
0
1979 1982 1985 1988 1991 1994 1997 2000 2003 2006 2009 2012 2015 2018
CBO adjusts administrative totals to make them compatible with the way data are reported in the CPS. For details, see Bilal Habib, How CBO Adjusts for Survey Underreporting of
Transfer Income in Its Distributional Analyses, Working Paper 2018-07 (Congressional Budget Office, July 2018), www.cbo.gov/publication/54234. CPS = Current Population Survey;
SNAP = Supplemental Nutrition Assistance Program; SSI = Supplemental Security Income. 3Size of Major Means-Tested Transfer Programs
Total Benefits in 2018
Program (Billions of dollars)
Medicaid and the Children’s Health Insurance 528
Program (CHIP)
Supplemental Nutrition Assistance Program (SNAP) 58
Supplemental Security Income (SSI) 55
Housing Assistance (Includes rental assistance and 41
public housing)
CBO adjusts administrative totals to make them compatible with the way data are reported in the Current Population Survey. For details, see Bilal Habib, How CBO Adjusts for Survey
Underreporting of Transfer Income in Its Distributional Analyses, Working Paper 2018-07 (Congressional Budget Office, July 2018), www.cbo.gov/publication/54234. 4Common Approaches to Adjusting for Underreporting
▪ Administrative matching: Offers near-perfect accounting, but administrative
microdata are not widely available.
▪ Rules-based simulation: Offers precise estimates at the micro level but
requires a significant research investment.
▪ Regression-based estimation (CBO’s approach): Offers tractability for
multiple programs over a long time series but is less precise at the micro level.
5CBO’s Approach
6CBO’s Regression-Based Imputation Method
▪ Use administrative data to set targets that reflect the CPS sampling frame.
– Subtract program participants who are institutionalized.
– Convert average monthly or point-in-time receipt to “ever-on” receipt.
– Convert fiscal year spending levels to calendar year targets.
▪ Use CPS data on reporting units to estimate the probability of receipt for all units.
– Run probit regressions for each year and population subgroup.
– Independent variables include income level and composition, labor force
participation, demographics, and household characteristics.
▪ Impute transfer receipt on the basis of estimated probabilities until the target is
reached.
– An algorithm assigns receipt to units in proportion to their predicted
probability of receipt.
7Share of Households Receiving SNAP Benefits, by Income, 2018
Percent
80
70
CBO (Imputed Plus Reported)
60
50
Most imputed recipients
of SNAP benefits are at
40 lower FPL ratios.
30
20
10 CPS (Reported Only)
0
0 25 50 75 100 125 150 175 200 225 250 275 300 325 350 375 400 425 450
Household Income as a Percentage of the Federal Poverty Level
CPS = Current Population Survey; FPL = federal poverty level; SNAP = Supplemental Nutrition Assistance Program. 8Assigning Benefit Amounts
After the total number of recipients matches the administrative targets for all subgroups
and programs, each unit is assigned a benefit amount.
▪ Supplemental Nutrition Assistance Program (SNAP) and Supplemental Security
Income (SSI): CBO derives the average benefit per recipient on the basis of income
and demographic groups and assigns those averages to new recipients.
▪ Medicaid: CBO derives the average cost to the government per recipient from
administrative data by eligibility category and assigns those averages to all recipients.
▪ Housing assistance: CBO estimates benefits for each reporting unit on the basis of
location, household size and structure, and fair market rents determined by the
Department of Housing and Urban Development. No additional households are imputed
to be recipients.
9Strengths of CBO’s Adjustment Method ▪ The method is straightforward to implement. For example, it doesn’t require a team of researchers to code specific program rules as they evolve. ▪ It is easily scalable across multiple programs over a 40-year time series, and it can be extended to other transfer programs, such as the National School Lunch Program. ▪ The distributional results of CBO’s method are broadly similar at the quintile level to those of the Urban Institute’s Transfer Income Model (which uses a rules-based method) and of Davern and others (which relies on administrative matching). For more details, see Sheila Zedlewski and Linda Giannarelli, TRIM: A Tool for Social Policy Analysis (Urban Institute, May 2015), https://tinyurl.com/TRIMurban2015 (PDF, 729 KB); and Michael Davern and others, “A Partially Corrected Estimate of Medicaid Enrollment and Uninsurance: Results From an Imputational Model Developed off Linked Survey and Administrative Data,” Journal of Economic and Social Measurement, vol. 34, no. 4 (December 2009), pp. 219–240, http://doi.org/10.3233/JEM-2009-0324. 10
Limitations of CBO’s Adjustment Method

▪ As a regression-based method, CBO’s approach assumes that nonreporters
  have the same characteristics as reporters.

▪ It does not account for false positives.

▪ Its ability to simulate complex policy scenarios is limited. However, it can be
  augmented by inputs from other CBO models to estimate the effects of some
  proposed rule changes to transfer programs.

                                                                                    11
Effects on Aggregate
Distributional Outcomes
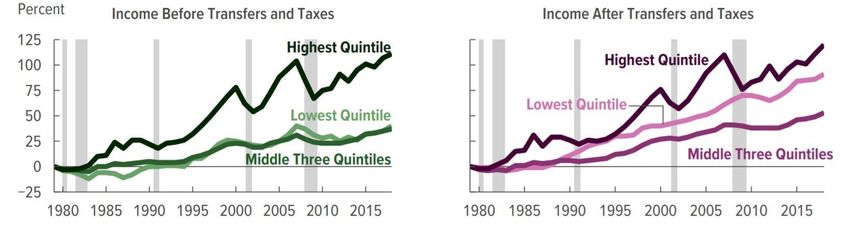
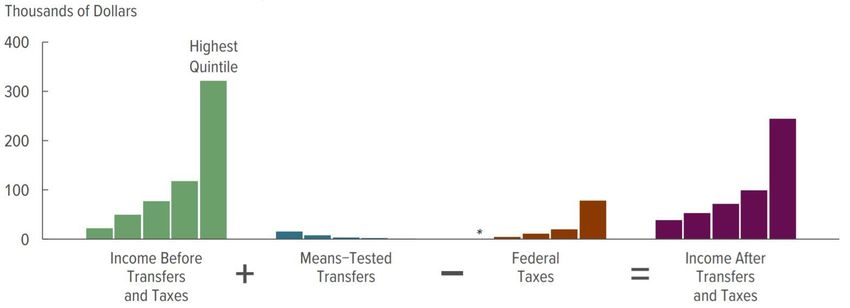
12Average Income, Means-Tested Transfers, and Federal Taxes,
2018, and Cumulative Growth in Average Income, 1979 to 2018
Means-tested transfers
and federal taxes
significantly increase the
cumulative growth of
income after transfers and
taxes among households
in the lowest quintile.
All dollar amounts are in 2018 dollars. To calculate growth rates, CBO first converted all dollar amounts to 2018 dollars using the Bureau of Economic Analysis’s price index for
personal consumption expenditures. Shaded vertical bars indicate the duration of recessions. * = between zero and $500. 13Income Inequality, 1979 to 2018
Gini Index
0.48
Adding imputed transfers
Income Before Transfers reduces income inequality
and Taxes (Base income)
0.46 in CBO’s distributional
analyses.
0.44 Base Income Plus Reported
Means-Tested Transfers
The effects on inequality
0.42 of imputing transfers have
increased over time as
0.4 Base Income Plus Imputed underreporting has
Means-Tested Transfers increased.
0.38
0.36
1979 1982 1985 1988 1991 1994 1997 2000 2003 2006 2009 2012 2015 2018
These results differ from those published in CBO’s Distribution of Household Income reports because they use data from the Current Population Survey (CPS) only, whereas those
reports use a combination of CPS data and data from the Internal Revenue Service’s Statistics of Income. 14Public Release of CBO’s Means-Tested Transfer Imputations
CBO released a working paper in 2018 describing its method for imputing means-tested
transfers. It included CPS extracts and Stata code to allow researchers to replicate CBO’s
results for 1979 through 2016.
In May 2020, CBO released a new version of the data and code with the following updates:
▪ It added imputations for 2017 and 2018,
▪ It added imputed values for housing assistance benefits,
▪ It improved estimates of Medicaid and CHIP benefits by accounting for variations in the
amount of time enrolled in the program,
▪ It updated recipient and benefit target values for 1979 through 2016, and
▪ It used GitHub as the repository.
In the coming months, CBO plans to release an update to that GitHub repository, including
imputations for 2019.
15Related Publications
Congressional Budget Office, The Distribution of Household Income, 2018
(August 2021), www.cbo.gov/publication/57061.
Congressional Budget Office, “Means-Tested Transfer Imputations” (last updated
May 2020), https://github.com/US-CBO/means_tested_transfer_imputations.
Congressional Budget Office, Projected Changes in the Distribution of Household
Income, 2016 to 2021 (December 2019), www.cbo.gov/publication/55941.
Bilal Habib, How CBO Adjusts for Survey Underreporting of Transfer Income in Its
Distributional Analyses, Working Paper 2018-07 (Congressional Budget Office,
July 2018), www.cbo.gov/publication/54234.
Kevin Perese, CBO’s New Framework for Analyzing the Effects of Means-Tested
Transfers and Federal Taxes on the Distribution of Income, Working Paper 2017-09
(Congressional Budget Office, December 2017), www.cbo.gov/publication/53345.
16You can also read