HOW FOOD MONOPOLIES IMPACT CONSUMERS
←
→
Page content transcription
If your browser does not render page correctly, please read the page content below
HOW FOOD MONOPOLIES IMPACT CONSUMERS
About Food & Water Watch
Food & Water Watch works to ensure the food, water
and fish we consume is safe, accessible and sustainable.
So we can all enjoy and trust in what we eat and drink,
we help people take charge of where their food comes
from, keep clean, affordable, public tap water flowing
freely to our homes, protect the environmental quality
of oceans, force government to do its job protecting
citizens, and educate about the importance of keeping
shared resources under public control.

Food & Water Watch          California Office
1616 P St. NW, Ste. 300     1814 Franklin St., Ste. 1100
Washington, DC 20036        Oakland, CA 94612
tel: (202) 683-2500         tel: (510) 922-0720
fax: (202) 683-2501         fax: (510) 922-0723
info@fwwatch.org            info-ca@fwwatch.org

foodandwaterwatch.org

Copyright © December 2013 by Food & Water Watch.
All rights reserved.
This report can be viewed or
downloaded at foodandwaterwatch.org.
HOW FOOD MONOPOLIES IMPACT CONSUMERS

Executive Summary . . . . . . . . . . . . . . . . . . . . . . . . . . . . . . . . . . . . . . . . . 2

Introduction . . . . . . . . . . . . . . . . . . . . . . . . . . . . . . . . . . . . . . . . . . . . . 3

Supersizing the Supermarket . . . . . . . . . . . . . . . . . . . . . . . . . . . . . . . . . . . . 3

The Rise of Monolithic Food Manufacturers . . . . . . . . . . . . . . . . . . . . . . . . . . . . 4

   Intense consolidation throughout the supermarket . . . . . . . . . . . . . . . . . . . . . . . 7

   Consumer choice limited . . . . . . . . . . . . . . . . . . . . . . . . . . . . . . . . . . . . . 7

   Storewide domination by a few firms . . . . . . . . . . . . . . . . . . . . . . . . . . . . . . 8

Supermarket Strategies to Manipulate Shoppers . . . . . . . . . . . . . . . . . . . . . . . . . 9

   Sensory manipulation . . . . . . . . . . . . . . . . . . . . . . . . . . . . . . . . . . . . . .10

   Product placement . . . . . . . . . . . . . . . . . . . . . . . . . . . . . . . . . . . . . . . .10

   Slotting fees and category captains . . . . . . . . . . . . . . . . . . . . . . . . . . . . . . .11

   Advertising and promotions . . . . . . . . . . . . . . . . . . . . . . . . . . . . . . . . . . .11

Conclusion and Recommendations . . . . . . . . . . . . . . . . . . . . . . . . . . . . . . . . .12

Appendix A: Market Share of 100 Grocery Items . . . . . . . . . . . . . . . . . . . . . . . . . .13

Appendix B: Top Food Conglomerates’ Widespread Presence in the Grocery Store . . . . . . . .27

Methodology . . . . . . . . . . . . . . . . . . . . . . . . . . . . . . . . . . . . . . . . . . . .29

Endnotes . . . . . . . . . . . . . . . . . . . . . . . . . . . . . . . . . . . . . . . . . . . . . . .30
Executive Summary                                                Safeway.4 Walmart alone sold nearly a third (28.8
Groceries are big business, with Americans spending              percent) of all groceries in 2012. 5
$603 billion on grocery products in 2012.1 Big-box food       ٔ The top companies controlled an average of 63.3
retailers like Walmart and national grocery store chains         percent of the sales of 100 types of groceries (known
now dominate the grocery industry. These mega-retailers          as categories in industry jargon). In 32 of the grocery
are the biggest buyers of grocery products, and they             categories, four or fewer companies controlled at
exert tremendous power over food companies and                   least 75 percent of the sales. In six categories, the top
ultimately farmers. This has led to a handful of food            companies had more than 90 percent of the sales,
companies producing the majority of the products in the          including baby formula and microwave dinners.
supermarket.                                                  ٔ Many firms sell multiple brands of the same product,
This growing consolidation of the food supply is severe          which leads consumers to believe that they are
at every step of the food chain, from farm to fork. And          choosing among competitors when they are actually
it impacts not only farmers and food manufacturers, but          just choosing among products made by the same
also consumers in the form of reduced consumer choices           firm that may have been made at the same factory.
and higher grocery prices. Since the Great Recession             This is true across the board, including organic and
started, grocery food prices rose more quickly than infla-       healthful brands typically seen as independent, but
tion and wages — twice as fast between 2010 and 2012. 2          which are being bought up by large food companies
At the same time, the largest food, beverage and grocery         unbeknownst to consumers.
retail companies pocketed $77 billion in profits in 2012. 3   ٔ Supermarkets engage in a host of strategies to
                                                                 manipulate the shopping experience, encouraging
Nationally, the growing size and market power of the top         consumers to make impulse and more expensive
grocery retailers has had tremendous ripple effects across       purchases that are unknown to consumers.
the food chain. Food & Water Watch examined 100 types
                                                              ٔ Regulators have largely left mega-retailers to operate
of grocery products and found that the top few compa-
                                                                 unchecked as they invented new ways to extract
nies dominated the sales of each grocery item in recent
                                                                 value from consumers and even large food proces-
years.
                                                                 sors. It is time for regulators to step in to protect
Key Findings:                                                    consumers and restore some semblance of competi-
                                                                 tion for consumers in grocery stores, providing a
 ٔ In 2012, more than half of the money that Ameri-
                                                                 chance for innovative, small or local food companies
    cans spent on groceries (53.6 percent) went to the
                                                                 to get on store shelves.
    four largest retailers: Walmart, Kroger, Target and

2                                                                         Food & Water Watch tXXXGPPEBOEXBUFSXBUDIPSH
Introduction Figure 1.$YHUDJHΖQȵDWLRQ
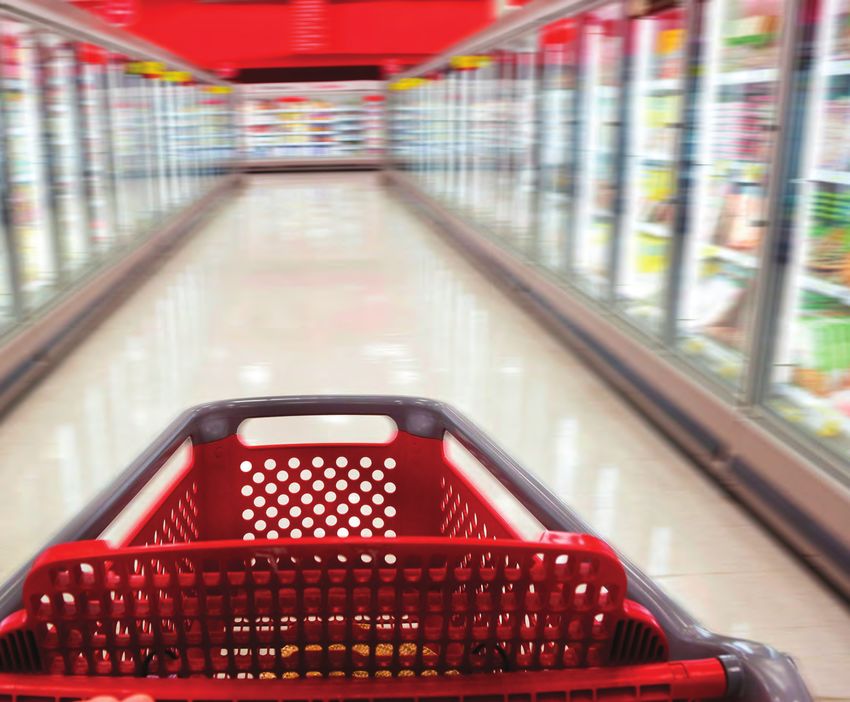
Bright lights, muzak, colorful displays and endless ways
to spend your money before you can reach the exit. No,
this is not a casino — it’s a typical supermarket. When 2.5%
consumers shop for groceries every week, they run a
gauntlet of marketing and advertising ploys just to put
food on their families’ tables.
Groceries are big business. Americans spent $603 billion
on grocery products in 2012.6 Supermarkets have gotten
bigger and more complicated to capture these sales. 1.8%
More than half (55 percent) of consumers’ purchases are
made on impulse,7 making them vulnerable to grocery
store marketing hijinks. Shoppers know that the prod-
ucts in the checkout aisle are there to encourage impulse
purchases, but every little detail of the supermarket’s 1.2%
landscape — layout, atmosphere and product placement
— is designed to alter a shopper’s decisions.
Big-box food retailers like Walmart and sprawling
grocery store chains now dominate the grocery industry.
Supermarkets pack their shelves with a cornucopia
of grocery products and brands, but consumers have
very few choices that matter when it comes to which
company made the food or whether it is a smart choice
in terms of price or quality. A handful of food companies
Food at home Total inflation Average wages
makes almost all the products in the supermarket. These
manufacturers heavily market the highly processed SOURCE: U.S. BUREAU OF LABOR STATISTICS, FOOD AT HOME, ALL ITEMS
INFLATION, AVERAGE HOURLY EARNINGS OF PRODUCTION/NON-SUPERVISORY
sugar- and salt-laden convenience foods in the middle of WORKERS
the store as opposed to more nutritious options, because
the less-healthy items are bigger moneymakers. food, beverage and grocery retail companies pocketed an
estimated $77 billion in profits in 2012.10
Big agribusiness and food companies have a strangle-
hold on every link in the food chain, from farm to fork. Supersizing the Supermarket
Only a few firms sell seeds, tractors and fertilizer, and
Today, consumers buy groceries from a small number of
a few others buy corn, cattle and carrots. For years, this
large, powerful supermarket chains and supercenters.
consolidation has meant that farmers receive a shrinking
On the local level, shoppers have a diminishing choice
percentage of the dollars that consumers spend on
of grocery stores as the biggest firms snap up local
food. But this growing consolidation of the food supply
chains and drive others out of business.11 Nationally,
impacts consumers, too — whether or not they realize
the growing size and market power of the top grocery
it — in the form of reduced consumer choices and higher
retailers has had tremendous ripple effects across the
grocery prices.
food chain. The grocery giants’ bulk purchases drive
Shoppers have certainly faced high and rising grocery food manufacturing companies to merge and get bigger,
prices over the past five years. The industry trade maga- which reduces the number of food processors filling
zine Progressive Grocer reported in 2013 that, “Prices for supermarket shelves, further eroding consumer choice
grocery items remain high” and “have risen every month and raising prices.
over the past two-and-a-half years.”8 Since the Great
Until recently, most consumers shopped at regional and
Recession started, grocery food prices rose more quickly
local supermarket chains. In 1997, Americans bought
than inflation and wages, and over the three years
about one-fifth of their groceries (20.8 percent) at the
between 2010 and 2012 grocery food prices rose twice as
four largest grocery retailers.12 But the rise of the big-box
quickly as average wages.9 At the same time, the largest
Grocery Goliaths t)PX'PPE.POPQPMJFT*NQBDU$POTVNFST 3
food retailers like Walmart precipitated a wave of               form of higher profits, while consumers rarely benefit.24
supermarket mergers starting in the 1990s that created a         The dominant supermarkets can charge consumers
network of national supermarket chains.13 Chains like the        considerably more than it costs to put groceries on
second largest grocery retailer Kroger still display the old     store shelves, and they have little incentive to pass
regional store names like Dillons, Smith’s, Fred Meyer,          price discounts on to consumers if they have few or no
King Soopers and others.14 Many shoppers may not even            competitors in a local market.25
realize that their supermarket is owned by a national or
                                                                 Instead, higher levels of grocery store consolidation lead
even foreign grocery store chain. (See Table 1.)
                                                                 to higher food prices. The link between grocery consoli-
At the same time, supercenters and warehouse club                dation and retail grocery prices has been studied exten-
stores have emerged as new grocery powerhouses,                  sively, and the vast majority of studies have found that
further shifting the food retail market toward the               food prices rise when retail concentration increases. 26
largest players. In 2012, more than half of the money            A U.S. Department of Agriculture research economist
that Americans spent on groceries (53.6 percent) went            concluded that “the overwhelming consensus is that
to the four largest retailers: Walmart, Kroger, Target           prices rise — and, in general, supermarkets set prices less
and Safeway.20 Walmart alone sold nearly a third (28.8           competitively — as concentration increases.”27
percent) of all groceries in 2012. 21 On the local level, the
                                                                 Higher levels of concentration among local retailers
consolidation can be much higher. In 231 metropolitan
                                                                 allow competitors to coordinate pricing strategies.28
areas, just four big retailers made more than 80 percent
                                                                 Local supermarkets mimic each other’s pricing strate-
of grocery sales in 2011, and Walmart made up half of all
                                                                 gies, which makes it nearly impossible for consumers
grocery sales in 35 cities. 22
                                                                 to comparison shop for grocery savings when a small
The grocery industry justifies the growing size of big-box       number of grocery retailers all price their foods at about
and merging grocery chains as a way to increase effi-            the same level.29
ciency, lower costs and pass savings on to consumers. 23
But most supermarkets just pocket any savings in the             The Rise of Monolithic
                                                                 Food Manufacturers
    Table 1.6WRUH1DPHVRI6HOHFWHG                            The largest supermarket chains and big-box stores limit
             /HDGLQJ6XSHUPDUNHW&KDLQV                          consumer choices not only on where to shop, but also
                                                                 what to buy. These mega-retailers are the biggest buyers
    Corporate           Chain Rank                               of grocery products, and they exert tremendous power
                                         Store Names
      Name                201215                                 over food companies and ultimately farmers.
                                     Kroger, Ralphs, Food        Retailers exert leverage by picking and choosing their
                                     4 Less, FoodsCo, Jay C,     suppliers, but suppliers rely on a few retailers for the
                                     Owen’s, Pay Less Super
                                                                 bulk of their sales. 30 The large quantities of products
                                     Markets, Scott’s, Ruler
 .URJHU&R                                                     required by the biggest grocery retailers favors the
                            2        Foods, City Market, King
 (Cincinnati, Ohio)16                                            biggest companies. Large food manufacturers can supply
                                     Soopers, Fry’s Food
                                     & Drug, Smith’s, Fred       large volumes and varieties of grocery products all at
                                     Meyer, QFC, Dillon’s        lower prices. Smaller, innovative food companies have
                                     Food Stores, Baker’s        difficulty getting onto supermarket shelves because they
                                     Safeway, Vons, Pavilions,
                                                                 cannot meet the contract terms or afford to accept the
 6DIHZD\ΖQF                                                   low, often unfair prices from retailers. Of the new food
                                     Randalls, Tom Thumb,
 (Pleasanton,               4
                                     Dominick’s, Carrs,          companies that survive, many end up being bought
 Calif.)17
                                     Pak ‘N Save                 out by the largest manufacturers, which reinforces the
 $KROG86$ΖQF                                                 entrenched food companies. 31
                                     Stop & Shop, Giant,
 (Quincy, Mass./            6
                                     Peapod                      Supermarket buyer power has encouraged many food
 Netherlands)18
                                                                 manufacturers to pursue their own mergers, further consoli-
 'HOKDL]H$PHULFD                   Food Lion, Hannaford,       dating much of the food processing industry. Between 1997
 (Salisbury, N.C./          9        Bottom Dollar Food,
                                                                 and 2002, most segments of the food processing industry
 Belgium)19                          Harveys, Sweetbay
                                                                 became more consolidated, and the increased concentration

4                                                                             Food & Water Watch tXXXGPPEBOEXBUFSXBUDIPSH
led to significant consumer price increases for most foods.32
Bigger food companies aim to be among the top three sellers
of key grocery items, and they actively target smaller and
local brands as well as the lesser brands of their competitors
for acquisitions or mergers.33
The Great Recession dampened the pace of food mergers,
W,KdKͳzΞ,
>E/,K>^KEͬ&>/
Food & Water Watch tXXXGPPEBOEXBUFSXBUDIPSH
Timeline:1HVWO«$FTXLVLWRQV'LYHVWLWXUHVDQG-RLQW9HQWXUHV(1905–2013)
Nestlé Co.
Nestlé and
Anglo-Swiss 1999 2000 PowerBar
1905 Coffee businesses
Condensed
Anglo-Swiss Milk Co. 2000
San Pellegrino, Findus Frozen Foods
Condensed 1929 Peter, Cailler, Kohler 1998
Chocolats Suisses S.A. Spillers Petfoods
Milk Co.
2001 Ralson Purina (pet foods),
1947 Maggi 1997 Contadina (tomato products) Häagen-Dazs
(bouillon, seasonings)
1995 2001 David & Sons (sunflower seeds)
Crosse & Blackwell Wine World Estates
1960
(canned food items)
1995 Ortega (Mexican foods) 2002 ChefAmerica frozen foods
1962 Findus Frozen Foods (Hot Pockets)
1994 Alpo (pet food)
1969 Vittel water Fonterra joint venture:
2002
Dairy Partners America
Perrier (Arrowhead, Calistoga,
Libby’s 1992 Deer Park, Poland Spring,
1970 (canned meat, fruit, Zephyrhills, Great Bear)
vegetables, and Juicy Juice) 2003 Mövenpick ice cream,
Dreyer’s ice cream
Stouffer’s 1991 Drumstick ice cream
1973
(frozen meals, Lean Cuisine) 2003
Acquisition Flipz pretzels, Ortega
1974 1991 Coca-Cola joint venture:
L’Oréal (29% minority share) Beverage Partners Worldwide 2004 Valio ice cream
Divestiture
Wine World Estates 2004
1970s (Beringer Vineyards, Chateau Nestlé USA Wonderball
Joint Venture Souverain, Napa Ridge, Meridian formed 1990
Vineyards, C&B Vintage Cellars) Jenny Craig,
2006 Uncle Toby’s (cereal),
General Mills joint venture: Joseph’s Gourmet Pasta
1977 Alcon Laboratories 1990
Cereal Partners Worldwide
(pharmaceutical)
Gerber (baby food products),
2007
1989 Butterfinger, Baby Novartis Medical Nutrition
Nestlé S.A. 1977 (name change) Ruth, Pearson (medical foods)
Rowntree (Kit Kat, Smarties, 2007 Nestlé Turtles
1981 Libby’s canned 1988
Rolo, Wonka), Buitoni (pasta)
vegetables and fruits
Kraft’s frozen pizza business
1986 2010 (DiGiorno, Tombstone, California
L.J. Minor (foodservice)
Bit-O-Honey, Chunky, Pizza Kitchen)
1984 Raisinets, Oh Henry!,
Goobers, Sno-Caps Hills Bros. Coffee 2010 Alcon Laboratories
1985
1 (Chase & Sanborn, MJB),
Carnation (Friskies,
Contadina) 2013 Bit-O-Honey candy
6
Intense consolidation
                                                                  Table 3./DUJHVW)RRG&RPSDQLHVȇ
throughout the supermarket
                                                                           0DUNHW6KDUHRI0RVW
Food & Water Watch found that the top companies
                                                                           &RQVROLGDWHG*URFHU\ΖWHPV
controlled an average of 63.3 percent of the sales of
100 types of groceries (known as categories in industry                                                             Market
                                                                       Grocery Item            # of Companies
jargon). In a third (32) of the grocery categories, four or                                                         Share
fewer companies controlled at least 75 percent of the         Sports Drinks                            2            98.9%
sales. In six categories, the top companies sold more than    Mediterranean Food                       2            96.8%
90 percent of the category sales, including baby formula
                                                              Baby Formula                             3            96.3%
and microwave dinners. (See Table 3.)
                                                              Carbonated Soft Drinks (Diet)            4            95.3%
In most cases, there were four companies that dominated
                                                              Microwaveable
the majority of the sales of each grocery item, but in                                                 3            94.6%
                                                              Packaged Dinners
23 categories only three companies sold most of the
                                                              Baked Beans                              4             91.0%
units, and there were only one or two major rivals in 15
categories. Mondelēz International (formerly part of Kraft    Canned and Bottled Tea                   4             89.9%
Foods) alone sold 60.9 percent of all cream cheese sales      Carbonated Soft Drinks                   4            89.2%
under its Philadelphia brand, and the majority of the rest
                                                              Baby Food and Snacks                     3            88.8%
of the market was store-brand cream cheese. Two little-
known manufacturers (Grupo Bimbo and Flowers Foods)           Indian Food                              3             87.0%

sold 73.7 percent of the bagels and English muffins,          Beer                                     4             86.1%
primarily Bimbo’s Thomas’ brand.                              Dry Mac & Cheese                         2            84.8%

Consumer choice limited                                       Wellness/Granola Bars                    3            84.6%

Many firms sell multiple brands of the same product,          Sugar                                    4            84.0%
which leads consumers to believe that they are choosing       Athletic Bars                            3            82.8%
among competitors when they are actually just choosing
                                                              Chili and Sloppy Joe Sauce               4             82.6%
among products made by the same firm that may have
been manufactured at the same factory. Pinnacle Foods         Tortilla Chips                           4            82.5%

sells both Mrs. Paul’s and Van de Kamps frozen fish           Frozen Meals                             4            82.0%
products. Two firms that sell a host of brands dominate       Pet Food                                 4             81.9%
margarine. Unilever sells I Can’t Believe It’s Not Butter!,
                                                              Chocolate                                4            80.8%
Shedd’s Country Crock, Imperial, Promise and Brummel
& Brown, and ConAgra Foods sells Blue Bonnet, Parkay          Gum and Mints                            3            80.6%
and Fleishmann’s.                                             Shelf-Stable Dips                        4            80.6%

This is true across the board, including organic and          Granola Bars                             3            80.5%
healthful brands typically seen as independent, but that      Breakfast Cereal                         4             79.9%
are being bought up by large food companies unbe-
                                                              Mayonnaise                               2             79.4%
knownst to consumers. And consumers won’t figure it
out by reading the labels, which often do not reflect the     Cereal/Snack Bars                        4             79.1%
corporate ownership. For example, Kashi and Bear Naked        Meat Substitute                          4            78.3%
are both Kellogg brands, but Kellogg’s ownership is           Pizza, Frozen                            4            78.2%
concealed from consumers — the Kashi and Bear Naked
                                                              Ketchup                                  3             76.7%
labels and consumer websites make them seem indepen-
dent, even though Kellogg’s government filings reveal         Crackers                                 3             76.5%
that the company owns the brands.47                           Refrigerated Yogurt                      3            75.8%

Kellogg Co., General Mills, PepsiCo and Post Foods            Potato Chips                             4             75.7%
control 79.9 percent of cereal sales, making shoppers         SOURCE: FOOD & WATER WATCH ANALYSIS OF MARKET SHARE DATA, SEE
hard pressed to find a box of cereal that wasn’t owned by     METHODOLOGY ON PAGE 29.

Grocery Goliaths t)PX'PPE.POPQPMJFT*NQBDU$POTVNFST                                                                       7
one of the big national manufacturers. The “choice” that of new flavors, and Cheetos gained 21 new varieties — to
consumers have in the cereal aisle comes largely from expand sales of the existing brands. 50
which variation (frosted or chocolate-flavored) of the big
companies’ brands they select. In the cracker aisle, the 6WRUHZLGHGRPLQDWLRQE\DIHZȴUPV
well-known brands like Ritz, Keebler, Wheat Thins and Several processed food companies have their fingers in
Triscuits are owned by Mondelēz International (formerly many pies in the supermarket, sometimes literally (see
Kraft) and Kellogg, but even seemingly independent Appendix B). Five major manufacturers (Kraft Foods,
and healthful options such as Kashi are also owned by PepsiCo, Nestlé, ConAgra Foods and General Mills) have
Kellogg.48 (See Table 4.) These two firms control 61.1 a presence — often a major market share — in more than
percent of cracker sales, making it more difficult for shop- one-sixth of the grocery products that Food & Water
pers to find a name-brand box of crackers that wasn’t Watch examined. Kraft Foods is a major manufacturer in
produced by one of the big national manufacturers. 22 items and dominates macaroni and cheese, processed
cheese, lunchmeat and mayonnaise (79.0 percent of sales,
Big food companies offer a proliferating number of
48.3 percent, 34.8 percent and 33.9 percent, respectively).
brands and varieties to increase sales, and this may also
But Kraft also sells coffee, condiments (mustard, salad
be a strategy to prevent new firms from getting onto
dressings and pickles), other dairy products (natural
store shelves.49 In the late 1980s, Frito-Lay (a PepsiCo
cheese and sour cream), frozen cakes and pies, and snack
subsidiary) stopped worrying about developing new snack
nuts. These major companies can be found in almost
products and instead just expanded on the lines of prod-
every aisle of the supermarket.
ucts they already had — Lay’s potato chips got a handful
Table 4.%UDQG3UROLIHUDWLRQE\7RS&RPSDQLHVLQ6HOHFWHG*URFHU\ΖWHPV
# of Top Company/
Grocery Item Top Brands
Firms Market Share
Frosted Flakes, Froot Loops, Raisin Bran, Raisin Bran Crunch, Special
K Vanilla Almond, Special K Red Berries, Apple Jacks, Corn Pops, Rice
Kellogg Co. 30.3%
Krispies, Kashi Go Lean, Crispix, All-Bran, Frosted Mini Wheats, Corn
Flakes
Honey Nut Cheerios, Multi Grain Cheerios, Chocolate Cheerios,
Cinnamon Chex, Corn Chex, Wheat Chex, Banana Nut Cheerios,
Top 4 General Mills 27.8%
&LQQDPRQ7RDVW&UXQFK/XFN\&KDUPV5HHVH V3XV&RFRD3XV
Breakfast Cereal Firms Trix, Golden Grahams, Cookie Crisp, Cheerios, Fiber One, Rice Chex,
Kix, Wheaties, Basic 4, Fiber One Honey Clusters, Yogurt Burst
79.9%
Cheerios
PepsiCo 11.8% Quaker, Cap'n Crunch, Life, Cinnamon Life, Oatmeal Squares
Honey Bunches of Oats, Selects Banana Nut Crunch, Selects Blue-
berry Morning, Grape Nuts, Shredded Wheat, Spoon Size Shredded
Post Foods 10.0%
Wheat, Fruity Pebbles, Cocoa Pebbles, Post Raisin Bran, Honeycomb,
Selects Great Grains
0RQGHOÕ]ΖQWO Newtons, SnackWell’s, Teddy Grahams, Barnum's Animals, Lorna
(formerly Kraft) 37.0% Doone, LU Le Petit Ecolier, Chips Ahoy, Oreo, Nilla, Nutter Butter
Top 4 Keebler, Chips Deluxe, Fudge Shoppe, Sandies Pecan, Vienna Fingers,
Cookies and Kellogg Co. 13.3%
Firms Mother's, Kashi, Murray
Cookie Bars
62.5% Campbell Soup Co. 6.7% Pepperidge Farm
McKee Foods 5.5% Little Debbie, Nutty Bar, Fudge Rounds, Choc-O-Jel, Star Crunch
0RQGHOÕ]ΖQWO
Ritz, Wheat Thins, Triscuits, Premium, Handi-Snacks, Honey Maid
(formerly Kraft) 33.3%
Top 3
Firms Cheez-It, Keebler Club, Keebler Townhouse, Keebler Toasteds, Keebler
Crackers Kellogg Co. 27.8%
Zesta, Carrs, Austin, Sunshine Krispy, Keebler Grahams
76.5%
Campbell Soup Co.
*ROGȴVK
15.4%
SOURCE: FOOD & WATER WATCH ANALYSIS OF MARKET SHARE DATA, SEE METHODOLOGY ON PAGE 29.
8 Food & Water Watch tXXXGPPEBOEXBUFSXBUDIPSHSupermarket Strategies In a report subtitled “Capturing a shopper’s mind, heart
to Manipulate Shoppers and wallet,” the Grocery Manufacturers Association
admitted that “Retailers and manufacturers realize the
Most consumers are at least aware that food manufac-
store’s potential as a strong marketing medium and
turers are competing for their dollars, with an almost
are now targeting shoppers in an effort called shopper
constant stream of television, print and social media
marketing.”51 More than half (55 percent) of sales in
marketing campaigns designed to drive demand for
a grocery store are unplanned impulse purchases.52
their largely processed food products. But the marketing
Retailers and manufacturers use every tool they can to
doesn’t stop once you get to the store. Supermarkets are
make sure that they can control those purchases.
designed with one end goal in mind: to sell as much as
possible. Every single aspect of the store, from lighting And that doesn’t include the food industry’s over-
to layout, music to aromas, is manipulated in a way to whelming television, print and social media marketing
encourage shoppers to buy more. and advertising campaigns designed to shape consumer
demands for processed foods.
Self-Defense at the Supermarket
While supermarkets and food manufacturers spend huge amounts of time and money
getting you to spend your hard-earned dollars, there are some things you can do to
defend yourself from their pervasive marketing.
Shop the perimeter of the store — In the layout used in most grocery stores, avoiding
the middle of the store will not only let you avoid the splashy packaging and marketing
for heavily processed food, but also let you focus on more healthful options like fresh
produce, meat and dairy.
Shop whole foods — %X\LQJLQJUHGLHQWVIRUDPHDOLVXVXDOO\PRUHFRVWHHFWLYHWKDQ
buying a pre-packaged meal kit, with less sodium and sugars added. And the more
steps that food goes through before it reaches you, the more of your dollar goes to the
processor, not farmers. This applies to produce, too — pre-cut produce is usually more
expensive than buying it whole and cutting it yourself.
Don’t shop on an empty stomach — When you’re hungry, you’ll be more vulnerable to
stores’ marketing strategies, such as using bakery aromas, sample stations and prod-
ucts placed in end-of-aisle displays and in checkout lines to get you to spend more.
Compare unit cost, not price — Stores can make a particular item stand out with special
signs or end-of-aisle displays, but it may still be more expensive than a similar item or a
GLHUHQWVL]HSDFNDJHRIWKHVDPHSURGXFW7KHUHVKRXOGEHDȊXQLWFRVWȋOLVWHGLQYHU\
ȴQHSULQWRQSULFHODEHOVRQWKHVKHOIȃFRPSDUHWKHVHWRVHHZKLFKGHDOLVWUXO\EHWWHUE\
comparing price per amount of product (per pound or some other measurement).
Take time to look high and low — With the most expensive shelf space at eye level,
\RXFRXOGȴQGFRVWHHFWLYHDOWHUQDWLYHVRQVKHOYHVKLJKHUXSRUORZHUGRZQ
Beware the end-of-aisle display — Supermarkets and manufacturers design fancy
displays in the aisle or at the end of the aisle to promote their products, but that doesn’t
meant that these items are necessarily a good bargain or discounted in any way. Don’t
assume that products in these special locations are the best deal without comparing
them to products in the normal location.
If you’re shopping with kids, give them a distraction —3URGXFWVPDUNHWHGVSHFLȴ-
cally to kids, like sugared cereal, will be at their eye level, making sure they’ll ask for
them. Bring a snack or a toy your child will enjoy instead.
Make a list. And stick to it! — Food manufacturers and retailers count on impulse
purchases and devote much of their marketing to enticing you to buy things that you
didn’t plan to get on that trip. The more you plan ahead of time, the less likely you will
fall prey to impulse buys.
Grocery Goliaths t)PX'PPE.POPQPMJFT*NQBDU$POTVNFST 9Sensory manipulation sions, even though most in-store bakeries use prepared
Shoppers are assaulted with sensory cues designed to foods and frozen dough. 58 There are even companies
entice purchases from the moment they enter the store. that specialize in creating these sensory experiences
Wall colors, pleasing aromas and brighter lighting are to encourage customers to buy certain products: they
designed to increase sales.53 Supermarkets know that have developed a fresh laundry scent to introduce in the
music with slower tempos tends to decrease the flow laundry aisle, a coconut aroma to use in travel agency
of store traffic and increase sales volumes. Louder and offices to evoke memories of sunny vacations and a citrus
faster music encourages customers to shop more quickly scent that can be infused into clothing to evoke a sense of
and purchase less. 54 The style of music also has signifi- fresh fabrics. 59
cant impact. One study found that wine shoppers who
heard classical music tended to select more expensive Product placement
wines and spend more overall than those listening to The industry has thoroughly studied the placement of
Top 40 hits. 55 Retailers are attuned to these variables and every product to drive shoppers to make more purchases.
make sure that their chosen music is appropriate for their Supermarkets and manufacturers allocate shelf space,
store and customer base to manipulate the shopping position more expensive products and brands, and place
experience. products carefully in relation to one another to maximize
sales.60 Key products are placed at eye level, which is a
Many stores arrange fresh produce and floral displays lower shelf for products targeting children.61 The most
at the front of the store to immediately emphasize the expensive name-brand products will be found in these
freshness and wholesomeness of their products to shop- spots, and smaller independent brands and private-label
pers. 56 Fresh fruit and vegetable sales typically account products will be found at the top and bottom shelves.
for about 11 percent of a grocery store’s revenue, 57 but it
makes a tremendous impression on shoppers. The bakery The industry knows every detail of how average shoppers
department pumps aromas of freshly baked bread to get navigate the store and select products: shoppers steer
consumers’ stomachs involved in the shopping deci- their carts counter-clockwise into the store, circle from
the back of the store to the front and typically select
items from shelves on their left side.62 These studies help
retailers and food companies know where the most lucra-
tive end-aisle displays should be placed, and where in the
store to put products relative to one another.
Most consumers know that the magazines, candy and
personal care products at the checkout aisle are designed
to drive impulse purchases. It certainly works. Products
displayed at the cash register capitalize on customers’
restlessness and boredom and have much higher sales.
One study found that placing an ointment at the cash
register instead of on the shelves increased sales by as
much as five-fold.63
Shoppers may be unaware that the ends of the aisle
displays are not actually a place to highlight special
offers, but are highly valued supermarket real estate
that also encourages impulse purchases. More than
one-sixth of grocery purchases are tied to brand display
advertisements.64 End-of-aisle displays may look like
featured sales or discounts, but they’re typically some of
the most expensive items — retailers know that singling
out their higher priced and popular items makes it harder
for shoppers to compare with other products, and leaves
consumers thinking they’re getting a deal.65 In fact,
10 Food & Water Watch tXXXGPPEBOEXBUFSXBUDIPSHthey rarely are. Food companies rent these high-traffic
display areas to give their products an edge, and it pays
off — 45 percent of all soda sales come from end-of-aisle
displays.66
Grocery stores often sell some basic staple foods like
milk and bread at below their cost to try to signal to
shoppers that all of their groceries are good values.67
The big grocery chains can offer these popular grocery
items at steeper discounts than smaller competitors to
lure consumers into the store and then recapture profits
by charging more for other products.68 These bargains
(known as “loss leaders”) are frequently placed in the
back of the store, forcing shoppers to pass more expen-
sive processed foods — where the stores’ atmospheric and prices.78 In 2013, a small competitor sued Nestlé for alleg-
pricing tricks can strongly encourage impulse purchases edly using its category captain position to exclude other
of these items.69 ice cream rivals from shelf space, relegating all smaller
manufacturers outside of giant companies like Nestlé
Slotting fees and category captains (including Häagan-Dazs and Dreyer’s) and Unilever
Some retailers charge food companies a fee (known as (owner of Ben & Jerry’s, Breyers and Klondike) to a tiny
slotting fees, slotting allowances or promotional allow- portion of the ice cream aisle.79
ances) to shelve their products in the most profitable
locations.70 These fees are especially prevalent for the Advertising and promotions
introduction of new grocery products and can run over The food industry relentlessly markets, advertises
$2 million for each new variety or brand.71 In 2000, these and promotes its products to shape consumer tastes
fees were estimated to cost companies $16 billion, the and capture consumers’ grocery dollars. In 2011, food,
most recent figure available.72 But between 2010 and beverage and candy companies spent $8.4 billion dollars
2012, Kroger alone charged companies fees that reduced on advertising and media buys, and the four largest
Kroger’s merchandise costs by about $6 billion annually.73 grocery retailers, Walmart, Target, Kroger and Safeway,
The largest companies have the easiest time paying these spent a combined $4.4 billion. 80
considerable fees, which effectively keep smaller food
The problem may be even more severe for foods
companies off store shelves.74 In a Federal Trade Commis-
marketed to children. The Journal of the American Dietetic
sion (FTC) report on slotting fees, smaller suppliers
Association reported that considerable research has
reported that they were “being squeezed off shelves” and
shown that the foods that are most heavily advertised on
that larger producers “will pay large amounts of money to
Saturday morning children’s television programs are in
keep everyone else out.”75
direct contrast to dietary guidelines, and these foods tend
Some stores have given control of their shelves to key to have high levels of fat, sugars and salt. 81 It concluded
manufacturers known as “category captains.”76 The that 91 percent of these advertised foods were high in fat,
category captain is typically a leader in the particular added sugars or salt or low in nutrients, based on federal
grocery aisle or item (like one of the soda companies for nutritional standards.82 One FTC staff report found that
beverages) and the supermarket grants the company the 85 percent of cereal advertisements directed at children
ability to choose what items are available, the placement were for highly sugared cereals.83 A diet composed of
of brands and varieties, the prices, and promotions that foods commonly marketed to children would consist
support the products. Many retailers rely on this arrange- mainly of cereal and snacks eaten outside of regular
ment with manufacturers as the primary tool to manage mealtime.
supermarket shelf space.77
Lower-income families are often special targets of the
For obvious reasons, category captains have little incen- promotional onslaught. Food manufacturers like Unilever,
tive to allow new competitors on supermarket shelves, ConAgra Foods and Hormel Foods track sales according
and they can limit consumers’ choices and increase to the “paycheck cycle.”84 Even safety net programs like
Grocery Goliaths t)PX'PPE.POPQPMJFT*NQBDU$POTVNFST 11food stamps can fatten the bottom line of food manufac- ٔ The FTC should reject mergers or sales of food
turers. One industry publication encouraged supermarkets companies or brands that add to consolidation
to ensure that processed meals (prepared pasta, dry dinner inside the supermarket. The FTC has approved food
mixes and frozen dinners) be “available and merchandised company mergers unless the firms are rival manufac-
at the right time of the month” for food stamp recipients.85 turers of specific grocery items, which has allowed
About 85 percent of all food stamp dollars are spent at food conglomerates to control the overall variety of
supermarkets and supercenters, and grocery stores adjust goods sold in grocery stores.
their product offerings, hours and prices to capture the ٔ The FTC should investigate and document the
monthly infusion of food stamp benefits. 86 level of consolidation in grocery retailing nation-
Conclusion and Recommendations
wide and in metropolitan areas and its impact on
consumer choices and prices. Grocery inflation has
Consumers have little chance to make informed decisions now significantly outstripped overall inflation and
and comparison shop in a grocery industry that is domi- wage growth; the federal government must assess the
nated by big supermarket retailers and food manufac- role of both manufacturing and retail grocery consoli-
turers. The FTC is responsible for ensuring that the largest dation on prices and choices.
grocery manufacturers and retailers do not use their
ٔ Congress must grant the FTC sufficient authority
tremendous size to disadvantage competitors and take
to effectively regulate food marketing, especially
advantage of consumers.
to children. Today, Congress has limited the FTC’s
Yet the FTC has done little to stop the aggressive authority to restrict food marketing. Congress should
consolidation of the grocery sector or the tactics used by provide the FTC with the full authority to regulate
grocery retailers to manipulate shopping environments food and beverage marketing and give the FTC the
and decrease competition that might lower prices for authority to create mandatory nutrition standards for
consumers. And mergers in the grocery retail and manu- food and beverages marketed to youth.
facturing sector have been allowed to proceed virtually ٔ The FTC must investigate and document the
unchecked. coordinated practices used by grocery retailers
It is time for regulators to step in to protect consumers and food manufacturers that act to block new,
and level the playing field to make sure that there is some local and innovative companies from getting onto
semblance of competition and a chance for innovative, supermarket shelves. Common practices that are justi-
small or local food companies to get on store shelves. fied as increasing efficiency (such as shared in-store
These steps include: marketing costs, slotting fees or category captains)
only have served to cement the dominance of the
ٔ Congress or the FTC should enact a national largest companies at the expense of the innovation
moratorium on grocery chain mergers, including and local food companies that consumers want to see
the host of deals already pending, such as the in the grocery store.
proposed merger between Kroger and Harris Teeter.
12 Food & Water Watch tXXXGPPEBOEXBUFSXBUDIPSHAppendix A
0DUNHW6KDUHRI*URFHU\ΖWHPV
Grocery Item
Grocery Type Companies Market Share Leading Brands
(Data Year)
Top Companies 56.6%
Bagged and Unilever 24.1% Lipton, PG Tips
Loose Tea RC Bigalow Inc. 14.0% Bigelow
(2011) Hain Celestial Group 11.4% Celestial Seasonings
Twinings North America 7.1% Twinings
Top Companies 86.1%
Budweiser, Stella, Beck's, Hoegaarden,
AB InBev /HH%DVV%XVFK5ROOLQJ5RFN*RRVH
47.9%
(formerly Anheuser-Busch) Island, Michelob, Natural Ice, Presidente,
Modelo, O'Doul's, Shock Top
Miller, Coors, Peroni, Grolsch, Blue
Moon, Killian's Irish Red, Henry
Weinhard's, Leinenkugel's, Hamm's,
Icehouse, Keystone, Magnum, Mickey's,
MillerCoors 28.9%
Beer Milwaukee's Best, Olde English, Red Dog,
(2010) Steel Reserve, Foster's, Molson, Redd's,
Sparks, Third Shift, Batch 19, Lech,
Cristal, Aguila
Corona, Negra Modelo, Modelo,
Constellation Brands, Inc. 5.3%
7VLQJWDR3DFLȴFR6RPHUVE\9LFWRULD
Heineken, Amstel, Birra Moretti,
Bulmers, Cruzcampo, Dos Equis,
Heineken USA 4.0% .LQJȴVKHU1HZFDVWOH2FKRWD3ULPXV
Sagres, Sol, Star, Strongbow, Tecate,
Beverages
Tiger, Zywiec
Top Companies 63.3%
Poland Spring, Nestlé Pure Life, Deer
Nestlé 25.7% Park, Arrowhead, Ice Mountain, Ozarka,
Bottled Water, Zephyrhills
Single Serve
Coca-Cola 22.0% Dasani, vitaminwater, smartwater
(2012)
$TXDȴQD3URSHO6R%H/LIHZDWHU
PepsiCo 15.6%
$TXDȴQD)ODYRUVSODVK
Supermarket Brand 22.9%
Top Companies 60.1%
San Pellegrino, Perrier, Poland Spring,
Nestlé 41.0%
Sparkling and Arrowhead
Mineral Water
National Beverage Corp. 10.2% La Croix, Faygo, Cascadia
(2012)
Talking Rain 8.9% Sparkling ICE, Talking Rain
Supermarket Brand 24.2%
Top Companies 89.9%
Ferolito Vultaggio & Sons 30.8% Arizona
Canned and
Pepsi Lipton Tea Partnership
Bottled Tea 29.9% Lipton, Tazo
(Pepsi-Unilever)
(2011)
Dr Pepper Snapple Group 17.2% Snapple
Coca-Cola 12.0% Gold Peak, Honest Tea Co, Nestea, Fuze
Grocery Goliaths t)PX'PPE.POPQPMJFT*NQBDU$POTVNFST 130DUNHW6KDUHRI*URFHU\ΖWHPV &217Ζ18('
Grocery Item
Grocery Type Companies Market Share Leading Brands
(Data Year)
Top Companies 89.2%
Coke, Sprite, Cherry Coke, Vanilla Coke
Coca-Cola 34.4% Fresca, Barq's, Fanta, Mello Yello,
&DHLQH)UHH&RNH
Pepsi, Mountain Dew, Sierra Mist, Mug,
:LOG&KHUU\3HSVL&DHLQH)UHH3HSVL
Carbonated Pepsi Throwback, Mountain Dew Code
PepsiCo 30.9%
Soft Drinks Red, Mountain Dew Voltage, Mountain
(2011) Dew Throwback, Mountain Dew White
Out
Dr Pepper, Canada Dry, 7Up, A&W,
Crush, Sunkist, Schweppes, Squirt, RC,
Dr Pepper Snapple Group 22.6%
Sun Drop, IBC, Welch's, Vernors, Cherry
7Up
National Beverage Corp. 1.3% Faygo, Shasta
Top Companies 95.3%
'LHW&RNH&RNH=HUR&DHLQH)UHH'LHW
Coke, Sprite Zero, Fresca Low Calorie,
Coca-Cola 45.9%
Coke Cherry, Diet Barq’s, Diet Coke with
Lime, Diet Cherry Coke
'LHW3HSVL'LHW0RXQWDLQ'HZ&DHLQH
Free Diet Pepsi, Pepsi Max, Diet Wild
Diet Carbonated
PepsiCo 30.9% Cherry Pepsi, Diet Sierra Mist, Diet Mug,
Soft Drinks
Beverages 3HSVL2QH'LHW0RXQWDLQ'HZ&DHLQH
(2011)
(continued) Free
Diet Dr Pepper, Diet 7Up, A&W Low
Calorie, Diet Sunkist, Canada Dry Low
Dr Pepper Snapple Group 18.2% &DORULH&DHLQH)UHH'LHW'U3HSSHU
Diet Rite, Diet Squirt, Diet Sun Drop,
Crush Low Calorie
National Beverage Corp. 0.3% Faygo Low Calorie, Shasta Low Calorie
Top Companies 63.8%
JM Smucker Co. 28.5% Folgers, Dunkin' Donuts, Millstone
Kraft Foods 14.0% Maxwell House, Yuban, Tassimo
&RHH
(2012) 6WDUEXFNV&RHH&RPSDQ\ 11.4% Starbucks, Seattle's Best
*UHHQ0RXQWDLQ.HXULJ&DULERX&RHH
Green Mountain
9.9% Tully's, Donut House, Newman's Own,
&RHH5RDVWHUV
&RHH3HRSOH
Top Companies 56.8%
Capri Sun, Crystal Light, Kool-Aid, MiO,
Kraft Foods 20.7%
Country Time, Kraft
Fruit Drinks Simply, Minute Maid, Hi-C, Odwalla,
Coca-Cola 16.4%
(2011) Fuze, Coca-Cola, Honest Tea
Ocean Spray 11.2% Ocean Spray
Trop50, SoBe, Naked, Tropicana,
PepsiCo 8.5%
PepsiCo, Dole Sensation
14 Food & Water Watch tXXXGPPEBOEXBUFSXBUDIPSH0DUNHW6KDUHRI*URFHU\ΖWHPV &217Ζ18('
Grocery Item
Grocery Type Companies Market Share Leading Brands
(Data Year)
Top Companies 50.1%
Coca-Cola 20.0% Simply, Minute Maid, Odwalla
Trop50, Tropicana, SoBe, Naked, Dole,
Fruit Juice 100% PepsiCo 18.3%
Izze
(2011)
Citrus World Inc. 6.8% Florida's Natural, Citrus World
Nestlé 5.0% Juicy Juice
Supermarket Brand 17.6%
Top Companies 57.6%
Seltzer/Tonic/ Dr Pepper Snapple Group 35.2% Canada Dry, Schweppes, Diet Schweppes
Club Soda Polar Beverages 13.0% Polar
(2011)
Cott Corporation 9.4% Vintage
Supermarket Brand 34.0%
Beverages
(continued) Top Companies 98.9%
Sports Drinks
PepsiCo 75.3% Gatorade, Propel
(2012)
Coca-Cola 23.6% Powerade
Top Companies 56.4%
Carlo Rossi, Barefoot, Twin Valley, Peter
E&J Gallo Winery 22.8% Vella, Livingston, Boone's Farm, Turning
Leaf, Redwood Creek
Wine Franzia, Inglenook, Corbett Canyon,
The Wine Group, LLC 15.9%
(2010) Foxhorn, Fish Eye, Glen Ellen
Woodbridge, Black Box, Robert Mondavi,
Constellation Brands, Inc. 12.8% Cook's, Blackstone, Arbor Mist,
Vendange, Ravenswood, Clos du Bois
Trinchero Family Estates 4.9% Sutter Home
Top Companies 73.7%
Bagels/ Grupo Bimbo 72.7% Thomas', Oroweat
(QJOLVK0XɝQV Nature's Own, European Bakers, Captain
(2012) Flowers Foods 1.0%
John Derst's
Supermarket Brand 13.6%
Top Companies 55.3%
Oroweat, Arnold, Freihofer, Mrs. Baird's,
Grupo Bimbo 26.8% Stroehmann Dutch Country, Bimbo, Sara
Lee, Beefsteak
Fresh Loaf Bread Nature's Own, Sunbeam, Wonder, Home
(2012) Flowers Foods 19.6%
Pride, Merita, Sara Lee (some markets)
Bread
Campbell Soup Co. 7.2% Pepperidge Farm
La Brea Bakery 1.7% La Brea Bakery
Supermarket Brand 25.3%
Top Companies 54.0%
New York Brand, Sister Schubert's,
Refrigerated Lancaster Colony Corp. 27.9%
Mamma Bella, Marshall's
and Frozen
Bread/Bagels/ Campbell Soup Co. 12.6% Pepperidge Farm
(QJOLVK0XɝQV Cole's Quality Foods, Inc. 7.2% Cole's
(2012)
Pinnacle Foods 6.3% Lender's
Supermarket Brand 20.5%
Grocery Goliaths t)PX'PPE.POPQPMJFT*NQBDU$POTVNFST 150DUNHW6KDUHRI*URFHU\ΖWHPV &217Ζ18('
Grocery Item
Grocery Type Companies Market Share Leading Brands
(Data Year)
Top Companies 46.6%
Arnold, Oroweat, Francisco, Ball Park,
Grupo Bimbo 22.4%
Sara Lee
Rolls/Buns/ Nature's Own, Sunbeam, Cobblestone
Croissants Flowers Foods 12.8%
Mill, Sara Lee, Wonder, Merita
(2012)
Martin's Famous Pastry Shop 6.0% Martin's
Bread
(continued) King's Hawaiian 5.4% King's Hawaiian
Supermarket Brand 33.1%
Top Companies 54.9%
Tortillas Gruma SA 38.6% Gruma, Mission, Guerrero
(2012) General Mills 10.0% Old El Paso
Olé Mexican Foods 6.3% La Banderita
Top Companies 79.9%
Frosted Flakes, Froot Loops, Raisin Bran,
Raisin Bran Crunch, Special K Vanilla
Almond, Special K Red Berries, Apple
Kellogg Co. 30.3%
Jacks, Corn Pops, Rice Krispies, Kashi
Go Lean, Crispix, All-Bran, Frosted Mini
Wheats, Corn Flakes
Honey Nut Cheerios, Multi Grain
Cheerios, Chocolate Cheerios, Cinnamon
Chex, Corn Chex, Wheat Chex, Banana
Nut Cheerios, Cinnamon Toast Crunch,
General Mills 27.8% /XFN\&KDUPV5HHVH V3XV&RFRD
Breakfast Cereal
3XV7UL[*ROGHQ*UDKDPV&RRNLH
(2011) Crisp, Cheerios, Fiber One, Rice Chex,
Kix, Wheaties, Basic 4, Fiber One Honey
Clusters, Yogurt Burst Cheerios
Quaker, Cap'n Crunch, Life, Cinnamon
PepsiCo 11.8%
Life, Oatmeal Squares
Honey Bunches of Oats, Selects Banana
Nut Crunch, Selects Blueberry Morning,
Breakfast Post Foods 10.0%
Grape Nuts, Shredded Wheat, Spoon
Size Shredded Wheat, Fruity Pebbles,
Cocoa Pebbles, Post Raisin Bran,
Honeycomb, Selects Great Grains
Supermarket Brand 12.2%
Top Companies 72.2%
Frozen Breakfast Hillshire Farm/ Sara Lee 32.5% Jimmy Dean
Entrees Pinnacle Foods 18.1% Aunt Jemima
(2012) Kellogg Co. 16.0% Eggo, Morningstar
H.J. Heinz Co. 5.6% Weight Watchers
Top Companies 61.2%
Hot Cereal/
PepsiCo 54.2% Quaker
Oatmeal
B&G Foods, Inc. 7.0% Cream of Wheat
(2011)
Supermarket Brand 26.7%
Top Companies 69.9%
:DɞHV3DQFDNHV Kellogg Co. 64.4% Pop-Tarts, Eggo
(2012) PepsiCo 5.5% Aunt Jemima
Supermarket Brand 14.0%
16 Food & Water Watch tXXXGPPEBOEXBUFSXBUDIPSH0DUNHW6KDUHRI*URFHU\ΖWHPV &217Ζ18('
Grocery Item
Grocery Type Companies Market Share Leading Brands
(Data Year)
Top Companies 82.6%
Chili and Sloppy Hormel Foods 37.3% Hormel, Stagg
Joe Sauce ConAgra Foods 33.3% Hunt's Manwich, Wolf, Dennison's
(2010) Pinnacle Foods 7.7% Nalley, Armour
Campbell Soup Co. 4.3% Campbell's Chunky Chili
Top Companies 76.7%
H.J. Heinz Co. 59.3% Heinz
Ketchup
ConAgra Foods 14.6% Hunt's
(2012)
Del Monte Foods 2.8% Del Monte
Supermarket Brand 22.0%
Top Companies 79.4%
Mayonnaise Unilever 45.5% Hellman's, Best Foods
(2012) Kraft Foods 33.9% Kraft, Miracle Whip
Supermarket Brand 10.6%
Top Companies 54.2%
Kraft Foods 24.0% A1 Steak Sauce, Kraft, Bull's-Eye BBQ
Meat Sauces Sweet Baby Ray's 13.9% Sweet Baby Ray's
(2012) Lea & Perrins Worcestershire, Heinz 57 Steak
H.J. Heinz Co. 10.6%
Sauce, Jack Daniel's BBQ Sauce
McCormick & Co. 5.7% Lawry's Meat Sauce
Top Companies 53.4%
Condiments Reckitt Benckiser 35.5% French's
and Sauces Mustard
Kraft Foods 12.6% Grey Poupon
(2012)
ConAgra Foods 2.7% Guldens
Plochman Inc. 2.6% Plochman's, Kosciusko
Top Companies 45.1%
Salov SPA 17.8% Fillippo Berio, Sagra
Olive Oil Deoleo (prev. Grupo SOS) 14.3% Carbonell, Bertolli, Carapelli, Koipe, Sasso
(2011) Pompeian 7.8% Pompeian
Star Fine Foods 5.2% STAR
Supermarket Brand 22.6%
Top Companies 69.0%
Unilever 34.5% Ragu, Bertolli
3DVWD6DXFHV
Campbell Soup Co. 17.6% Prego
(2012)
H.J. Heinz Co. 11.2% Classico
ConAgra Foods 5.7% Hunt's
Top Companies 71.6%
JM Smucker Co. 43.6% Jif, Smucker's
3HDQXW%XWWHU Hormel Foods 15.6% Skippy
(2012) ConAgra Foods 10.0% Peter Pan
Kraft Foods 2.4% Planter's
Supermarket Brand 19.3%
Grocery Goliaths t)PX'PPE.POPQPMJFT*NQBDU$POTVNFST 170DUNHW6KDUHRI*URFHU\ΖWHPV &217Ζ18('
Grocery Item
Grocery Type Companies Market Share Leading Brands
(Data Year)
Top Companies 33.0%
Pinnacle Foods 10.8% Vlasic, Milwaukee's Pickles
3LFNOHV2OLYHV Mt. Olive Pickle Co. 9.5% Mt. Olive
Relish
(2012) Kraft Foods 7.5% Claussen
GL Mezzetta Inc 5.2% Mezzetta
Supermarket Brand 28.3%
Top Companies 66.0%
Condiments Clorox Co. 22.1% Hidden Valley Ranch
and Sauces Salad Dressing
Kraft Foods 20.5% Kraft
(continued) (2012)
Pinnacle Foods 13.0% Wish-Bone
Ken's 10.4% Ken's Steak House
Top Companies 80.6%
PepsiCo 64.1% Fritos, Tostitos, Lays
Shelf-Stable Dips
Kraft Foods 8.1% Cheese Whiz
(2010)
Clorox Co. 6.7% Hidden Valley Ranch
Gruma SA 1.6% Mission
Top Companies 55.8%
I Can't Believe It's Not Butter, Shedd's Spread/
Unilever 23.8% Country Crock, Imperial, Brummel & Brown,
Promise
Butter/Margarine
(2011) Land O'Lakes 18.5% Land O'Lakes
Boulder Brands, Inc. 6.8% Smart Balance
ConAgra Foods 6.7% Blue Bonnett, Parkay, Fleischmann's
Supermarket Brand 30.8%
Top Companies 40.0%
Kraft Foods 20.2% Breakstone's, Knudsen
Cottage Cheese Dean Foods 8.6% Dean's, Land O'Lakes, Country Fresh
(2010) HP Hood 6.9% Hood, Crowley, Axelrod
Prairie Farms Dairy 4.3% Prairie Farms, Hiland, Roberts
Supermarket Brand 41.2%
Dairy and Eggs Top Companies 63.1%
Cream Cheese 0RQGHOÕ]ΖQWO
60.9% Philadelphia
(2012) (formerly Kraft)
Supermarket Brand 30.9%
Top Companies 64.5%
Nestlé 42.5% &RHH0DWH1HVWO«
Cream/Creamers WhiteWave
18.7% International Delight, Silk, Horizon Organic
(2011) (formerly Dean)
Dean Foods 3.2% Garelick Farms, Dean's
Supermarket Brand 25.5%
Top Companies 26.1%
CCF Brands, Inc. 8.3% Great Day, Farmers Market, Huevos de Calidad
Eggs Cal-Maine Foods, Inc. 8.1% Farmhouse, 4-Grain, Egg-Land's Best
(2012) Land O'Lakes 7.3% Egg-Land's Best, Land O'Lakes
Sunny Farms Corp. 2.4% Sunny Farms
Supermarket Brand 53.8%
18 Food & Water Watch tXXXGPPEBOEXBUFSXBUDIPSH0DUNHW6KDUHRI*URFHU\ΖWHPV &217Ζ18('
Grocery Item
Grocery Type Companies Market Share Leading Brands
(Data Year)
Top Companies 42.9%
Dean Foods 23.2% Dean's, Land O'Lakes, Garelick Farms
Flavored Milk HP Hood 7.9% Hood, Southern Comfort, Lactaid
(2012) Prairie Farms Dairy 6.7% Prairie Farms Dairy, Hiland Dairy
Nestlé 5.1% Nestlé Nesquik
Supermarket Brand 33.4%
Top Companies 32.4%
Kraft, Cracker Barrel, Athenos, Polly-O,
Kraft Foods 17.3%
Philadelphia, Big Slice, Snackables, Deli Fresh
Natural Cheese
Sargento Foods, Inc. 8.3% Sargento
(2012)
Lactalis USA 3.8% Sorrento, Galbani, President
Michael Foods Inc. 3.0% Crystal Farms
Supermarket Brand 44.4%
Top Companies 58.2%
3URFHVVHG&KHHVH Kraft Foods 48.3% Kraft, Velveeta, Easy Cheese
(2012) Bel Brands USA 9.9% Laughing Cow, Kaukauna, Boursin, Price's
Supermarket Brand 23.2%
Top Companies 75.8%
Refrigerated Danone 29.9% 'DQQRQ6WRQ\ȴHOG2UJDQLF$FWLYLD2LNRV
Dairy and Eggs Yogurt
(2012) General Mills 29.2% Yoplait, Go-Gurt
(continued)
Chobani Inc. 16.7% Chobani
Top Companies 20.9%
Dean Foods 11.2% Land O'Lakes, Fieldcrest, Garelick Farms
Skim/
HP Hood 6.5% Hood Lactaid, Hood, Hood Simply Smart
Low-Fat Milk
(2012) WhiteWave
3.2% Horizon Organic, The Organic Cow
(formerly Dean)
Supermarket Brand 63.4%
Top Companies 52.6%
Daisy Brand, LLC 31.1% Daisy
Sour Cream Kraft Foods 18.3% Breakstone's, Knudsen
(2010) HP Hood 1.7% Hood
Dean Foods 1.5% Friendship
Supermarket Brand 29.4%
Top Companies 16.5%
Dean's, Land O’Lakes, Fieldcrest, Oak Farms,
Dean Foods 12.9% Lehigh Valley, Tuscan Dairy Farms, Garelick
Whole Milk Farms, Swiss Dairy
(2012)
WhiteWave
3.6% Horizon Organic, The Organic Cow
(formerly Dean)
Supermarket Brand 63.2%
Grocery Goliaths t)PX'PPE.POPQPMJFT*NQBDU$POTVNFST 190DUNHW6KDUHRI*URFHU\ΖWHPV &217Ζ18('
Grocery Item
Grocery Type Companies Market Share Leading Brands
(Data Year)
Top Companies 91.0%
Bush Bros. & Co. 68.2% Bush's
Baked Beans
ConAgra Foods 14.3% Van Camp's
(2011)
B&G Foods 4.9% B&M
Campbell Soup Co. 3.6% Campbell's
Top Companies 33.2%
Canned and Del Monte, Carb Clever, Orchard Select,
Del Monte Foods 20.0%
Jarred Fruit Fruit & Gel To-Go, Fruit Naturals, Sun Fresh
(2011) Dole Food Co. 13.2% Dole
Supermarket Brand 27.7%
Top Companies 38.4%
Canned and Del Monte Foods 21.5% Del Monte, Contadina
Jarred Vegetables ConAgra Foods 9.2% Hunts, Rotel
(2011) General Mills 7.7% Green Giant, Le Sueur, Muir Glen Organic
Supermarket Brand 37.0%
Top Companies 57.3%
Del Monte Foods 38.2% Del Monte
Canned
General Mills 8.4% Green Giant
Green Beans
Seneca Foods 5.7% Libby's
(2012)
Allens Inc. 5.0% Allens
Fruit and
Supermarket Brand 35.5%
Vegetables;
Vegetarian Top Companies 58.0%
Alternatives SunMaid Growers 24.6% Sun-Maid
Dried Fruit Sunsweet Growers 14.4% Sunsweet
(2011) Ocean Spray 13.6% Ocean Spray Craisins
Mariani Packing Co. 5.4% Mariani
Supermarket Brand 21.2%
Top Companies 61.0%
Chiquita Brands Intl. Inc. 32.7% Fresh Express
Fresh
Dole Food Co. 23.2% Dole
3DFNDJHG6DODGV
(2011) Earthbound Farm (acquisition by White Wave
White Wave Foods 5.1%
Foods pending as of Dec. 15, 2013)
Supermarket Brand 26.3%
Top Companies 11.9%
Frozen Fruit Dole Food Co. 8.9% Dole, Chef-Ready Cuts
(2011) Jasper Wymans & Sons 3.0% Wymans
Supermarket Brand 75.3%
Top Companies 70.2%
Vegetarian/ ConAgra Foods 47.6% Egg Beaters
Egg Substitute Papetti Foods AllWhites, Papetti Foods Better
(2011) Michael Foods Inc. 22.6%
'N Eggs
Supermarket Brand 27.1%
20 Food & Water Watch tXXXGPPEBOEXBUFSXBUDIPSH0DUNHW6KDUHRI*URFHU\ΖWHPV &217Ζ18('
Grocery Item
Grocery Type Companies Market Share Leading Brands
(Data Year)
Top Companies 78.3%
Vegetarian/ Kellogg Co. 58.4% Morningstar Farms, Gardenburger
Meat Substitute Kraft Foods 14.7% Boca
Fruit and
(2011)
Vegetables; ConAgra Foods 3.3% Lightlife Smart Dogs
Vegetarian Turtle Island Foods 2.0% Tofurkey
Alternatives Top Companies 66.6%
(continued) Vegetarian/
WhiteWave
Non-Dairy Milk 52.7% Silk, Horizon Organic
(formerly Dean)
(2012)
Blue Diamond Growers 13.9% Almond Breeze
Top Companies 51.7%
Kraft Foods 20.3% Oscar Mayer
Bacon Hormel Foods 12.2% Hormel
(2012) 6PLWKȴHOG)RRGV 12.1% )DUPODQG6PLWKȴHOG*ZDOWQH\
Tyson Foods 7.1% Wright
Supermarket Brand 20.5%
Top Companies 46.5%
Kraft Foods 14.8% Oscar Mayer
Breakfast Meat 6PLWKȴHOG)RRGV 13.1% )DUPODQG6PLWKȴHOG*ZDOWQH\-RKQ0RUUHOO
(2012) Hormel Foods 10.1% Hormel, Farmer John
Hillshire Farm/ Sara Lee 8.5% Jimmy Dean
Supermarket Brand 19.8%
Top Companies 73.3%
Lion Capital 30.8% Bumble Bee, Snow's Clams, King Oscar
Fish,
Canned Dongwon Industries 26.6% Starkist
(2012) Chicken of the Sea 15.9% Chicken of the Sea, Tonno Genova
Meat and Fish
Supermarket Brand 11.7%
Top Companies 21.4%
Nippon Suisan Kaisha 10.5% Gorton's
Fish/Seafood, Pinnacle Foods 4.7% Van de Kamp's, Mrs. Paul's
Frozen Great American Seafood
3.2% Great American
(2012) Imports Co.
Beaver Street Fisheries 3.0% Sea Best
Supermarket Brand 44.5%
Top Companies 29.4%
Trans-Ocean
9.2% Trans-Ocean
Products Inc.
Fish/Seafood, Vita Foods Products Inc. 8.0% Vita
Refrigerated
Ocean Beauty
(2012) 7.4% Echo Falls, Lascco, Nathan's
Seafoods Inc.
Trident Seafoods Corp. 4.8% Louis Kemp
Supermarket Brand 18.6%
Grocery Goliaths t)PX'PPE.POPQPMJFT*NQBDU$POTVNFST 21You can also read