How Social Identity Affects Economic - Intersecting Identities, Livelihoods and Affirmative Action
←
→
Page content transcription
If your browser does not render page correctly, please read the page content below
Intersecting Identities, Livelihoods and Affirmative Action:
How Social Identity Affects Economic
Opportunity for Women in India
March 2021
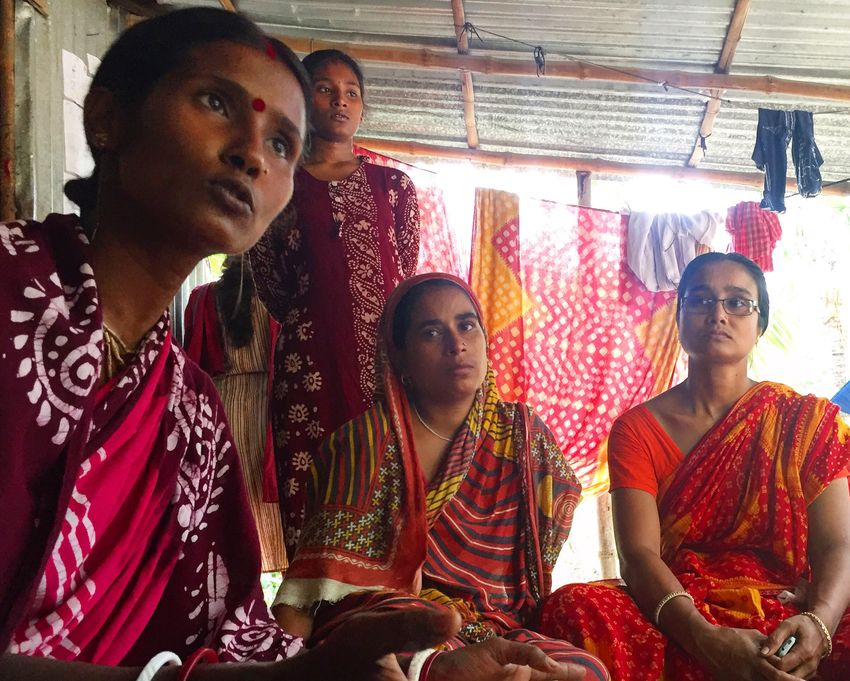
Image Credit: Adam Cohn | Flickr.com
ABOUT THIS PUBLICATION
The report Intersecting Identities, Livelihoods and Affirmative Action: How
Social Identity Affects Economic Opportunity for Women in India is an output
of the research vertical of the Initiative for What Works to Advance Women and
Girls in the Economy (IWWAGE), an initiative of LEAD at Krea University.

This document is not a priced publication. Copyright @ 2021.

Reproduction of this publication for educational or other non-commercial
purpose is authorised, without prior written permission, provided the
source is fully acknowledged. For further information, please write to
communications@iwwage.org.

ABOUT IWWAGE
Initiative for What Works to Advance Women and Girls in the Economy (IWWAGE)
aims to build on existing research and generate new evidence to inform and
facilitate the agenda of women’s economic empowerment. IWWAGE is an
initiative of LEAD, an action-oriented research centre of IFMR Society (a not-for-
profit society registered under the Societies Act). LEAD has strategic oversight
and brand support from Krea University (sponsored by IFMR Society) to enable
synergies between academia and the research centre. IWWAGE is supported by
Bill & Melinda Gates Foundation. The findings and conclusions in this report
are those of the authors and do not necessarily represent the views of the Bill
& Melinda Gates Foundation.

ACKNOWLEDGEMENT
I would like to acknowledge, with gratitude, a grant from IWWAGE that enabled
this study. A very special thanks to Sona Mitra of IWWAGE and Yamini Atmavilas
of Bill & Melinda Gates Foundation for initial conversations. Subhalakshmi
Nandi (Senior Program Officer, Gender Equality, India, Bill & Melinda Gates
Foundation), Soumya Kapoor Mehta (Head, IWWAGE) and Sona Mitra (Principal
Economist, IWWAGE) gave extremely useful comments on an earlier draft.
Thanks are due to Madhukari Mishra who collected some of the material used
in this paper. In addition, I have also extensively relied on papers and material
that I have accumulated through various other personal research projects on
women in India.

LEAD AUTHORS                               EDITORIAL
Ashwini Deshpande                          SUPORT
Professor of Economics
Ashoka University                          Atiya Anis

DESIGN
Sakthivel Arumugam
ABSTRACT
This paper presents a landscape assessment of the current state of gender
inequality in the economic sphere in India, which is a key facet of overall
inequality. The assessment comprises the latest empirical evidence based
both on demographic survey data, as well as key results from cutting-edge
scholarly literature. Male–female gaps are significant in many dimensions,
but the contours of these gaps are shaped by the overlap of gender with
other social identities, such as caste, religion or tribal identities. Thus,
women from stigmatised and marginalised groups are disadvantaged
along two dimensions and have to battle the double stigma of this
intersectionality. This paper outlines the trends in overall gender gaps in
the areas of labour force participation, self-employment and education
over the last couple of decades, but highlights the role of intersectionality
that goes into producing structures of advantage and disadvantage. The
paper discusses policies such as the National Rural Livelihood Mission
designed to encourage self-employment, which have had several other
positive impacts, such as increase in empowerment and autonomy, but
their record in terms of enhancing livelihoods is mixed at best. Evidence
shows that policies such as employment guarantee schemes or transport
infrastructure could end up having positive gendered effects, despite their
gender-blind design. The paper argues that in order to tackle inequality
fundamentally, we need to mainstream evidence-based research on
intersectionality, which should be the basic lens informing policy.
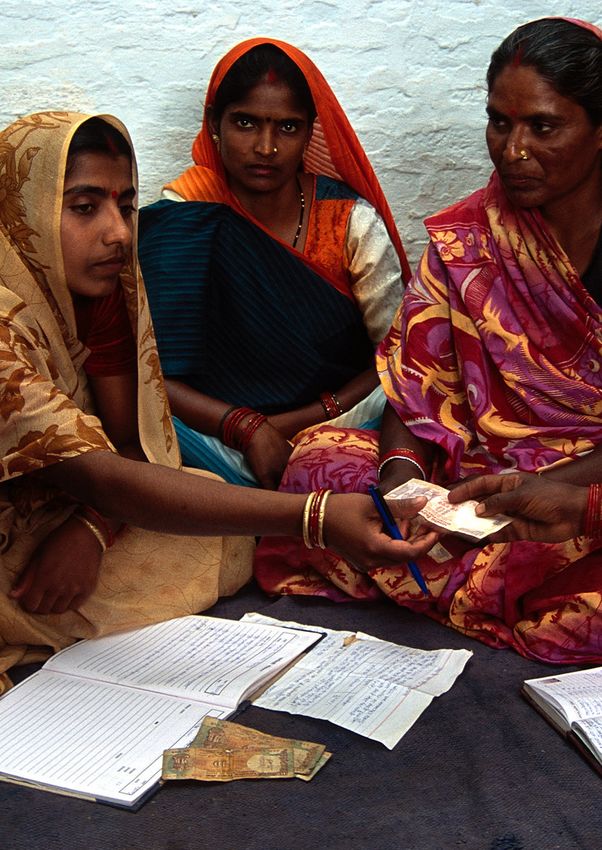
Image Credit: Adam Cohn | Flickr.com
INDEX
Page
07     1. Introduction

Page
11     2. Gender Gaps in the Labour Market

Page
29
       3. Intersecting Identities

Page
39     4. Female Self-Employment and Women in Business

Page   5. The Vanishing Trade-Off? Women’s Empowerment Through
45     the Lens of Intersectionality

Page
51     6. Policies: Affirmative Action and Beyond

Page
59     7. Discussion and Concluding Comments

Page
62     References

Page
       Appendix A
67

Page
69     Appendix B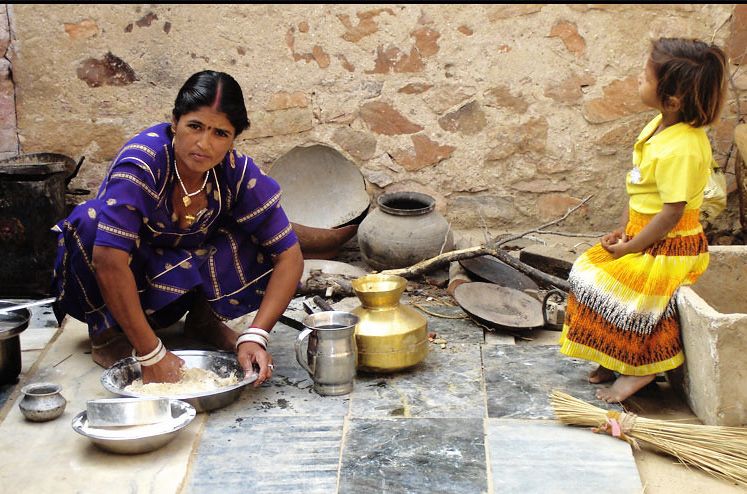
6
7

1   INTRODUCTION
    1.1 Motivation
    This paper presents a landscape assessment of the current state of
    gender inequality in the economic sphere in India, which is a key
    facet of overall inequality. The assessment comprises the latest
    empirical evidence based both on demographic survey data, as
    well as key results from cutting-edge scholarly literature. Economic
    inequalities between men and women are inextricably linked to
    social and demographic inequalities, reflected in an adverse sex
    ratio, discrimination towards the girl child in health, nutrition and
    education, and sexual violence, both inside the home and outside
    it. This paper focuses on the economic dimension, while recognising
    the crucial interconnections that present the full picture of
    contemporary gender inequality in India. We need to be cognisant
    of these interconnections, not only to fully grasp the extent and
    multifaceted nature of gender inequalities, but also to recognise the
    deep, and sometimes invisible, interconnections between policies.
    This is especially crucial when policies targeted towards one specific
    objective (say, the imbalance in the sex ratio) could have unintended
    consequences for other dimensions of gender inequalities (for
    instance, gender gaps in education).1

    1
     Sharma and Rastogi (2020) show that as a standalone measure, a ban on fetal sex determination could actually worsen the problem of
    gender discrimination rather than mitigate it.
8
While there is a large body of literature and the question of the apposite policy framework.
evidence on each of these aspects, which The paper ends with a discussion of the current
this paper summarises briefly, the role of policy framework, and how it needs to change
intersectionality in defining gender inequalities to address multiple disadvantages produced by
is discussed less often. Male–female gaps are intersectional inequalities.
significant in many dimensions, but the contours
of these gaps are shaped by the overlap of The paper should be read as a wide-angle,
gender with other social identities such as panoramic view of the landscape of inequalities
caste, religion or tribal identities. Thus, women between men and women, overall, as well as
from stigmatised and marginalised groups are along the axes of social group identities, and
disadvantaged along two dimensions and have to not as an original research paper that dives
battle the double stigma of this intersectionality. deep into one specific problem. The focus is
This paper outlines the trends in overall gender on summarising the state of knowledge on the
gaps in the areas of labour force participation, economic dimensions of male–female inequality
self-employment and education over the last based on large-scale empirical evidence. This
couple of decades, but highlights the role can be combined with specific nuances from
of intersectionality that goes into producing the multitude of ethnographic accounts and
structures of advantage and disadvantage. empirical research that zooms in on one precise
aspect of the larger matrix of inequalities.
The discussion of inequalities, especially if we
recognise intersectionality appropriately, begs
1.2 Summary of Main Conclusions
The male–female gaps in labour force from entering paid employment or prompt
participation rates (LFPR) in India are strong and their exit. The focus in this body of literature
persistent, as female labour force participation is on conservative cultural norms, the stigma of
(FLFP) continues to decline from its already working outside the home, or the deterrent effect
low level. The decline is driven by rural women, of sexual violence. However, evidence that these
especially Adivasi women. There are several factors are responsible for the decline in female
explanations advanced for the low level as labour force participation is not convincing.
well as the decline. Part of the problem is the There is indeed a supply side constraint that
inability of the statistical system to correctly women have to battle; the real cultural norm
count women’s economic work. Women are that prevents women from participating in
involved in economic work in far greater paid work is the belief that they are primarily
numbers than labour force statistics are able to responsible for domestic chores and care work.
capture. Additionally, the registered decline has Evidence from India’s first Time Use Survey (TUS)
been in paid employment, and not in women’s (2019) reveals substantial gender disparities in
reproductive labour. time spent on domestic duties.
There is a large body of academic research that However, there are important demand side
views the decline in recorded FLFP as a decision reasons for the decline in FLFPR. This is the
taken by women to drop out of paid work. The problem of the low demand for female labour,
attention of this body of work is on identifying especially commensurate with women’s
the supply side constraints that prevent women increasing educational attainment.9
The other important dimension characterising up having positive gendered effects, despite
gender gaps in the labour market relates to their gender-blind design. Electoral quotas
wage gaps and employer discrimination. Over also have positive effects, both along gender
the decade which saw a fall in women’s labour and caste dimensions. Job quotas for women
force participation rate, women’s educational are applicable to government jobs, which are
attainment increased sharply. Thus, in 2010, if shrinking. Additionally, they need several other
women were ‘paid like men’, the average wages complementary provisions to be effective.
of women would be higher than those of men.
The fact that men earn higher wages/salaries This paper is organised into seven sections.
after accounting for wage earning characteristics Section 2 presents the numbers on gender
reveals substantial wage discrimination. gaps in the labour market, focusing on both
labour force participation as well as wage
The intersection between gender and social gaps, followed by major explanations for the
identities such as caste and tribe indicate that trends. Section 3 discusses key dimensions of
Dalit women, disadvantaged on account of gender–caste intersectionality in the labour
caste, poverty and patriarchy, are the worst-off market and educational attainment. Section 4
in terms of material indicators, as well as on discusses female self-employment and women
autonomy and mobility indicators. in business, with a brief overview of self-help
groups (SHGs). Section 5 examines the issue of
Gender gaps in self-employment are even larger women’s economic empowerment through the
than those in wage employment. Policies such lens of intersectionality. Section 6 presents a
as the National Rural Livelihood Mission (NRLM) brief discussion of the policy issues, including
designed to encourage self-employment have a discussion of policy trade-offs. Section 7
had several other positive impacts, such as offers some other important facets of gender
increase in empowerment and autonomy, but inequality and concluding comments.
their record in terms of enhancing livelihoods is
mixed at best.
Other policies such as employment guarantee
schemes or transport infrastructure could end10 Image Credit: The White Ribbon Alliance | Flickr.com
11

    Gender Gaps in the
2   Labour Market
    Since 1991, the Indian economy has witnessed significant
    structural transformation. This has been accompanied by
    high growth rates in national income, with fluctuation, till
    roughly 2014–15. The fertility rate in India declined to 2.2
    births in 2019. International experience would indicate that a
    combination of high economic growth and low fertility is the
    right precondition for greater participation of women in paid
    economic activities. Yet, while gaps between men and women
    in educational attainment have narrowed considerably
    over time, gaps in labour force participation have widened.
    Female labour force participation rate, always low in India,
    has declined precipitously over the decade. This section
    presents a landscape assessment of the state of knowledge
    and empirical evidence on gender gaps in labour markets:
    labour force participation, work participation, unemployment
    and wage gaps.
12
2.1 Labour Force Participation and Unemployment Rates
2.1(A) Trends
India has among the lowest LFPRs2 in the world, Figure 1 reveals that first, male LFPRs for all the
well below the global average of 50 per cent, years are significantly higher than female, and
and East Asian average of 63 per cent. Appendix the gap between the two has been increasing
A explains the definitions used by the National over the years. Second, there is no significant
Sample Survey (NSS) to calculate LFPRs. Figure difference between rural and urban LFPRs for
1, from the Periodic Labour Force Survey Report men; however, for women, rural LFPRs have been
(PLFS) for 2017–18, shows the LFPRs for men and higher than urban for all years.
women (15 years and above) between 2004–5 and
2017–18, separately for rural and urban areas.
Figure 1: LFPR in usual status.
90
80
70
LFPR ( in per cenmt)
Rural male
60
50 Rural female
40
Urban male
30
20 Urban female
10
0
2004-05 2009-10 2011-12 PLFS (2017-18)
Source: PLFS 2017–18, p. 54
Third, while male LFPRs have also declined Since 2017, the NSS has been releasing quarterly
slightly over the period by nearly 10 percentage estimates of key labour force indicators.
points for rural men (from nearly 87 to 76.4 per However, comparison should be made with
cent) and urban men (80 to 74.5 per cent), female caution, as these are current weekly status
LFPRs have registered a sharp decline, especially (CWS) figures, whereas Figure 1 is based on usual
in rural areas. Rural female LFPRs declined by status estimates. The latest figures on LFPRs are
25 percentage points (from roughly 50 to 25 per those contained in the NSS Quarterly Bulletin
cent), whereas urban female LFPRs continued for April to June 2019.3 These show that LFPRs
their historically low levels, and declined slightly during April–June 2019 were 73.3 and 19 per cent
(from roughly 22 to 20 per cent). for men and women, respectively, the same level
as in April–June 2018.
2
See Appendix A for definitions
3
http://mospi.nic.in/sites/default/files/publication_reports/Quarterly_Bulletin_PLFS_April_June_2019_M_0.pdf.13
Unemployment
Due to the presence of disguised unemployment In 2017–18, 3.8 per cent of rural women were
or underemployment in India (i.e. workers unemployed according to usual status, compared
with very low productivity engaged in menial, to 5.8 per cent of rural men. CWS unemployment
survivalist activities), open unemployment rates for rural women were 7.7 per cent (a
historically has not been very high. There historical high) compared to 8.8 per cent for
is an additional reason for women’s open rural men. For urban areas, in 2017–18, as they
unemployment rates to be low. As we note have been in most years, unemployment rates
below, open unemployment rates for women for women were higher than those for urban
will give the lower bound of the unutilised men (10.8 and 7.1 per cent, respectively, according
portion, as there are several women who have to usual status, and 12.8 and 8.8 per cent,
an unmet demand for work (i.e. they would like respectively, according to CWS).4 The April–June
paid work), but do not actively go out looking 2019 figures for unemployment based on CWS
for work. This is due to demands of domestic reveal no significant change in unemployment.
work and the knowledge that paid work that it is The only other time when unemployment rates
compatible with domestic chores would not be for urban women according to usual status were
available close to home. Thus, they would not in double digits was 1977–78 (when urban female
be classified as unemployed, but in the NSS they unemployment rate was 12.4 per cent, compared
are declared as mainly engaged in domestic work to 5.4 per cent for urban men).
because of the non-availability of work. Such
women declare themselves to be ‘not working’ A defining feature of contemporary open
but not unemployed. NSS code 92 refers to those unemployment is that it characterises
who attended domestic duties only, and code ‘educated’ people more than the uneducated.
93 to those who attended domestic duties, but Here ‘educated’ is defined as individuals with
also engaged in free collection of goods. Until secondary level and higher education. As Table
2011–12, the NSS Employment–Unemployment 1 shows, the unemployment rate for rural
Surveys (EUS) allowed us to probe the details educated males rose to 10.5 per cent in 2017–
of women’s work because there was an entire 18, from 3.6 in 2011–12. For rural women, it rose
section in the survey devoted to understanding from 9.7 to 17.3 per cent over the same period.
the specific activities women were engaged in, For urban women, the rise is even larger—it
whether strictly for household use or not. This almost doubled from 10.3 to 19.8 per cent. Thus,
detailed probe, through Block 7 of the EUS, of the educated urban women who are in the
revealed that women were engaged in unpaid labour force, one in five was looking for a job
economic activities, but were not classified as in 2017–18. This is a telling statistic emphasising
workers. The PLFS has dropped Block 7. Thus, it the demand side constraints to women’s labour
does not allow us to probe the nature of work for force participation.
those individuals who declare their work status
as code 92 or 93.
4
Statement 30, p. 82, PLFS 2017–18.14
Table 1:
Unemployment rates by educational attainment (%) according to usual status (ps+ss),
15 years and above, 2004–5 to 2017–18, all-India
2004-15 2009-10 2011-12 PLFS 2004-05 2009-10 2011-12 PLFS
Rural Male Rural Female
Not literate 0.3 0.3 0.5 1.7 0.2 0.0 0.2 0.1
Lit & upto 1.0 1 1 3.1 1.0 0.5 0.3 0.6
primary
Middle 1.6 1.8 1.8 5.7 3.4 2.3 2.5 3.7
Sec & above 4.4 3.5 3.6 10.5 15.2 1.8 9.7 1.3
ALL 1.6 1.6 1.7 5.7 1.8 1.6 0.6 3.8
Urban Male Urban Male
Not literate 1 1 0.7 2.1 0.3 0.9 0.4 0.8
Lit & upto 2.1 1.6 1.9 3.6 2.9 0.5 1.3 1.3
primary
Middle 4.2 2.6 2.2 6.0 8.0 3.7 3 5.1
Sec & above 5.1 3.6 4.0 9.2 15.6 12.2 10.3 19.8
ALL 3.7 2.8 3.0 6.9 6.9 5.7 5.3 10.8
Source: Statement 32, PLFS, 2017-18, p. 84.
2.1(B) Explanations
The literature on Indian LFPRs focuses on two However, it is important to note that the evidence
distinct but related issues: one, the persistently for the U-shaped relationship is widely debated,
low level, and two, the decline over the last and, in fact, individual countries display a great
decade. Several studies have explored either deal of heterogeneity in the relationship between
one or both of these dimensions (Neff et al., economic growth and LFPRs (see Chaudhary and
2012; Das et al., 2015; Chatterjee et al. 2015; Afridi Verick, 2014 for an extensive list of references on
et al., 2017; Klasen and Pieters, 2015; Siddiqui et this debate).
al., 2017; Sarkar et al., 2019; and Afridi et al., 2020,
among others). We can broadly group the literature on both the
low levels and the recent decline of female LFPR
There are several alternative explanations for into the following rough thematic groups, while
low female LFPRs in India. At the macroeconomic noting that several works address more than
level, it has been suggested that female LFPRs one theme.
have a U-shaped relationship with economic
growth (Goldin, 1995). Whether India is on the
declining part of the U-curve, only time can tell.15
2.1.1 Measurement
If women’s participation in economic work is These women are also very likely to fall through
measured through a dichotomous indicator (in the cracks of the statistical system.
the labour force, or out of it), we tend to miss
a crucial dimension about women’s work in Several of these women are home-based workers,
specific regional contexts such as South Asia. To seen not only in India, but in large parts of the
understand this better, we need to appreciate developing world. For decades, such women
what I have elsewhere called the ‘Grey Zone’, have remained underpaid, invisible, but often
which defines the unpaid, invisible and fractured vital parts of domestic or global supply chains.
nature of women’s work (Deshpande, 2019). They are contracted by firms (multinational or
domestic) or sub-contracted on a piece rate
At the two ends of the spectrum are women basis. In the garment industry, they are the
who clearly work outside the home for pay, and among the lowest category of workers, stitching
those who are clearly not in the labour force (i.e. sleeves, sewing buttons, trimming threads,
are in the working age group, but are neither embroidering. Other examples of home-based
working nor looking for work) out of choice, and work include food processing, rolling agarbatti,
are exclusively involved in care activities, such bidi-making, assembling sticker bindi sheets,
as cooking, cleaning, routine household chores, weaving, etc. It is estimated that their number is
caring for children and the elderly. over 38 million.
However, the majority of women in South Asia A short summary of this is: women are ‘working’
are in between these two extremes. These but are not being counted as such. Their
are women whose involvement in economic participation in economic work is invisible. Mehta
work (activities that are within the standard and Pratap, (2017) demonstrate how counting
boundaries of the System of National Accounts women’s work correctly can make their work
[SNA], i.e. counted as economic activities when visible and enable their contribution to national
national income or GDP is measured) lies in a income to be counted correctly. Mondal et al.
grey zone. These are women who might work (2018) show that a large part of the so-called
in the house or outside, and whose work might decline in women’s work participation is not an
be paid or unpaid, and whose work might be actual decline, but a shift from paid to unpaid
continuous throughout the year, or seasonal, work.
and it might be full time or part time. A woman
might be involved in the family business, or the Overcoming Measurement Bias in Official Statistics
main activity that provides the livelihood for the Neff et al. (2012) demonstrate how estimates of
family. For example, she could be involved in female LFPR become higher using NSS data, if we
livestock rearing or farming or helping with the include unpaid economic activities. Deshpande
kirana shop, or involved in artisanal activity such and Kabeer (2019), through a large primary
as making baskets, or weaving or making pots. If survey conducted in West Bengal, show how
these are family activities, then her contribution even small changes to the NSS questionnaire
to economic work (over and above her ‘care’ can make big differences to the estimates of
work) would not be paid. In such a case, it is labour force participation by better capturing
highly likely that she would not be seen as a the unpaid economic work women routinely do
worker, neither by her family, nor by herself. on family farms, businesses or enterprises.
The National Data Innovation Centre (NDIC)16
conclusively demonstrates the importance of in wage work, non-wage subsistence work and
correct measurement. Their study (Deshmukh family business, the same women were more
et al., 2019) shows how work participation rates likely to be included as workers. They point out
are sensitive to survey design. They argue that that this omission is particularly large for work
standard labour force status questions, where on family farms and in caring for livestock; i.e.
respondents are asked to identify primary and about 96 per cent of women’s omitted activities
secondary activities of women, resulted in women are in these two areas. Thus, they make a case
being listed as ‘homemakers’. However, when for counting work, not workers.
respondents were asked about who participated
2.1.2 Women’s Work through Time Use Surveys
The focus in western literature has been on because a large part of women’s economic work
women’s unpaid non-market work—domestic (distinct from domestic chores) was unpaid and
chores, care and reproductive work. The sexual unvalued.
division of such work, which disproportionately
falls on women everywhere, is a key feature of What happens if women’s work is not counted
gender inequality globally. adequately?
However, in developing countries including India, As Devaki Jain has noted, this failure to measure
there is another crucial dimension to women’s women’s economic contribution reduces them
unpaid work: unpaid economic work, the kind of to ‘virtual non-entities in economic transactions,
work that would get counted as ‘work’ if it were such as property ownership or offering bank
done by a man. This includes work on farms and loans as collateral’ (Jain, 1996, p.WS 47).
fisheries, on livestock and orchards, in family
enterprises engaged in artisanal production These words are as valid today as when they were
(handloom, handicraft), family-run stores in written. Women become invisible as workers,
retail, family-owned workshops (woodwork, and are seen primarily as engaged in domestic
metal work) and so on. Thus, women in work, even when their economic contribution is
developing countries are engaged in unpaid critical to the success of their family enterprises.
work that would conventionally fall within the In other words, often men and women do very
boundaries of the SNA, i.e. activities that get similar work, but men get counted as ‘workers’
counted in the measurement of a country’s and women do not.
national income or GDP.
Jain reminds us that ‘if women's unpaid work were
Pioneering Indian feminist scholars were properly valued, it is quite possible that women
concerned that labour force statistics that would emerge in most societies as the main
formed the basis of GDP estimation by measuring breadwinners—or at least equal breadwinners—
‘workers’—for instance those collected by the since they put in more hours of work than men...’
NSS or national Census in India—were unable (Jain, 1996, p. WS 47).
to capture women’s economic contributions17
The First Official TUS:
1998 Pilot
Advocacy by leading scholars to count women’s Combining time spent on SNA with that on
work adequately led to the Indian Ministry extended SNA, the report found that rural men
of Statistics and Programme Implementation were spending 46.05 hours on ‘work’, compared
(MoSPI) conducting a pilot TUS in 1998–99 across to rural women who were spending 56.48 hours.
six states in India: Haryana, Madhya Pradesh, Corresponding figures for urban men and urban
Gujarat, Odisha, Tamil Nadu and Meghalaya. This women were 44.5 and 45.6 hours, respectively.
was based on a survey of 18,591 households. The
main objectives of this pilot were to quantify The major headline finding from the pilot was
the contribution of women in the ‘national that the share of women’s work to total work
economy’ and to assess ‘gender discrimination (male + female) was 55 per cent, far higher than
in household activities’. figures from official statistics would reveal.
Further, including extended SNA activities,
The report found that out of 168 hours (24*7) in women’s participation in economic work was
a week, men spent 42 hours in SNA activities, higher than men’s. If these activities had been
whereas women spent 19 hours. However, in counted correctly, there would still have been a
what the report described as extended SNA’, gap in labour force participation between men
which includes unpaid economic activities, men and women, except in the opposite direction.
spent 3.6 hours compared to women who spent
34.6 hours.18
The First National TUS,
2019
The pilot highlighted the need for an all- The presentation of data in this report is in a
India survey, but it took two decades before it format different from the pilot. It uses three
saw the light of day. This national level survey categories to refer to SNA, non-SNA, Other
interviewed 1,38,799 households and covered activities (instead of clearly identifying extended
the entire country except Andaman & Nicobar SNA, as the pilot did). It finds that in employment
Islands. In contrast to international surveys, the related activities (for all individuals 6 years and
Indian TUS relies on the interview method, where above), rural men spent 434 minutes/day, which
information on all members of the household amounts to 50.63 hours/week. Rural women
6 years and older was collected from a single spent 317 minutes/day, or 36.98 hours/week. The
respondent, as we noted at the beginning of this corresponding figures for urban men and urban
piece. women were 514 minutes/day (59.96 hours/
week); and 375 minutes/day (43.75 hours/week).
Unlike in international TUS, the reporting of
time spent on various activities was not done Thus, focusing only on SNA activities (paid
separately by each person in the household, but economic activities), the 2019 TUS confirms
often by a central respondent for all members of the findings from employment or labour force
the household. When the respondent was giving statistics. The report shows that share of time
details about their own time use, it would be spent in SNA activities is greater for men than
‘self-reporting’. In the 2019 TUS, 56 per cent of women, and the gaps are larger in urban
rural males self-reported (49.5 per cent urban), compared to rural areas. This is in accordance
and 65.8 per cent rural women self-reported (62.5 with the gaps in LFPRs.
per cent urban). This is an important disclaimer
to be noted when we analyse figures from TUS. However, if we examine the percentage share of
It is entirely possible that male respondents total time in a typical day by age group, gender
overstated their own contribution to domestic and rural/urban residence, we find that women
chores and understated their wives’ contribution spend a far greater proportion of their time in
to economically productive work. non-SNA production compared to men, regardless
of age group and rural/urban residence. Non-
The broad buckets were participation and time SNA production activities are unpaid and they
spent on paid activities, unpaid caregiving include unpaid domestic services for household
activities, unpaid volunteer work, unpaid members, unpaid caregiving services for
domestic service producing activities, learning, household members, unpaid volunteering for
socialising, leisure and self-care activities. household and community.19
Male–Female Difference:
‘Unpaid Domestic Service’
The 2019 TUS reports numbers from the self- These are fancier labels to describe routine and
reported distribution of total time in a day across humdrum cooking and cleaning chores. In 2019,
broad categories for men and women separately. Indian women spent ten times more time on
We have noted the male–female difference in these activities compared to men.
SNA work. A major difference between men and
women is in terms of time spent on ‘unpaid This highlights the structural issue of sexual
domestic service’. What does this category division of domestic work, which is among the
include? It includes ‘food and meal management most unequal in South Asia, especially in India
and preparation’, ‘cleaning and maintenance of and Pakistan, compared to the global average.
own dwelling and surrounding’, ‘DIY maintenance, The results of the TUS 2019 show that there is no
repair, decoration’, ‘care and maintenance of evidence of movement towards the more equal
textiles and footwear’, ‘household management sharing norms that are seen internationally.
for own final use (e.g. paying bills)’, ‘pet care’, and
‘other unpaid domestic services’.
Image Credit: Paula Rey | Flickr.com20
2.1.3 Demand Side or Supply Side?
The focus on a binary indicator such as labour would throw light on factors determining entry
force participation reduces the issue of women’s and exit into the labour force. Using data from
involvement to a labour supply one. If women’s two rounds of the India Human Development
involvement is seen only as a supply side story, Survey (IHDS) panel for 2005 and 2012, which is
then the attention, quite naturally, would be on the only nationally representative panel data,
factors that inhibit women’s ability or inclination Sahoo et al. (2019) examine factors that govern
to go out of the house and work. Thus, the the entry of women into the labour force, and
spotlight turns to constraints such as the stigma exit from it.
attached to working outside the home—which
may or may not be internalised by women—or However, there are demand side explanations,
a rise in religious conservatism, or a resurgence which draw our attention to the lack of demand
of a patriarchal mindset which asserts the for labour in the occupations and activities
supremacy of the male breadwinner model, in which women are concentrated. There is
where the man earns and the woman cooks, important work which shows that what we note
cleans and cares for the household. as a decline (which is equated to withdrawal of
women from the labour force in a supply side
Supply side explanations also highlight that mindset) is actually a manifestation of the
poverty appears to be a major factor in women’s changing nature of work availability, especially
economic activity (e.g. Olsen and Mehta, 2006). As for rural and less educated women. This body
household per capita income rises, an ‘income’ of work questions the ‘decline’ narrative (Desai
effect appears to come into play, leading women [2017]; Desai et al. [2018]; Chatterjee et al.
to withdraw from the labour force so that [2015]). This work shows that the proportion of
participation rates decline with rising income economically active women has not declined,
(Kapsos et al., 2014; Srivastava and Srivastava, but the number of days they work has, which
2010). Examining data from five large sample shows up as a decline in LFPRs. In India over the
rounds of the NSS EUS (1993–94, 1999–2000, last three decades, there has been a massive
2004–5, 2009–10 and 2011–12), Das et al. (2015) decline in agricultural jobs, and this has not
confirm that income has a dampening effect necessarily been accompanied by an increase
on FLFPRs, in contrast to men, whose LFPRs are in manufacturing jobs, and/or other non-
not significantly related to household spending. agricultural wage employment. There has been
But they find that the negative income effect is movement out of agriculture into informal and
non-linear and decreases as income increases. casual jobs, where the work is sporadic, and
This non-linear relationship between income often less than 30 days at a stretch. The new
and participation is driven by urban women. As modern sector opportunities, especially in high
women’s education has increased, it may have value-added service sectors, mostly accruing to
altered their preferences and especially their men.
reservation wage. This is likely to be higher for
urban women; highly educated urban women will Lahoti and Swaminathan (2016) demonstrate
work when available work is commensurate with that economic development in India has not
their qualifications. Therefore, these supply-side been led by labour-intensive manufacturing,
explanations only partly explain the decline in which has resulted in producing growth with low
FLFPRs. employment intensity, disadvantaging women
more than men. Chatterjee et al. (2015) show
One characteristic that sets women’s economic that sectors that tend to hire female workers
work apart from men’s is that due to reasons of have expanded the least during the last decades.
marriage, childbirth and child care, women might Gupta (2017) investigates the effect of trade
enter and exit the labour force at several points liberalisation in India (post-1991) on women's
in their lives. Good quality longitudinal data employment and finds that establishments21
exposed to larger tariff reductions reduced their greater decline in women’s than men’s labour in
share of female workers. This evidence would Indian farms. They find that reduced demand for
confirm the questioning of the decline narrative. labour in weeding, a task requiring precision and
one that was more often undertaken by women,
Since the decline in LFPRs has been driven by explains a large part of a decline in women’s
rural women, the latest evidence from Afridi et labour. The study shows that when specialisation
al. (2020) offers valuable insights. They show of work is sex-specific, technological change can
that mechanisation has led to significantly have gendered impacts.5
2.1.4 Cultural Norms, Social Barriers, Stigma and Sexual
Violence
In the literature on female LFPRs in India, a great conservatism; indeed, internationally, women
deal of the focus is on the decline. However, covering their faces in public spaces is often
an equally (if not more) important issue is the attacked as an oppressive practice. Of course,
persistently low level of women’s LFPR in India, the context in the West is different in that
lower than our other South Asian neighbours, covering heads/faces is associated with being
Bangladesh and Sri Lanka. In joint work with Muslim. In India, the practice is followed by both
Naila Kabeer, I explore factors that shape the Hindus and Muslims, and in recognition of that,
low level (Deshpande and Kabeer, 2019). Our we label it more broadly as “veiling”, and not as
results are based on a large primary household wearing a burqa or hijab.
survey in seven districts in West Bengal. We
collect data on all the indicators included in the As noted above, we implemented simple changes
official surveys, and on additional variables that to the official survey questionnaires in order to
are usually not included in surveys. get better estimates of women’s work that lies
in the grey zone. Accordingly, our estimates are
Since we wanted to focus on which specific higher than official estimates, but even with
internal constraints inhibit women from improved measurement, a little over half (52
working, we asked specific questions about if percent) get counted as “working”. Which means
they were primarily responsible for child care, that participation in work is low, even after work
for elderly care, for standard domestic chores in the grey zone is included.
(cooking, washing clothes etc.), and if they
covered their heads/faces always, sometimes, or
never. The latter is taken as a proxy for cultural
The critical role of domestic chores
In the literature on female LFPRs in India, a great low level (Deshpande and Kabeer, 2019). Our
deal of the focus is on the decline. However, results are based on a large primary household
an equally (if not more) important issue is the survey in seven districts in West Bengal. We
persistently low level of female LFPR in India, collected data on all the indicators included in
lower than our other South Asian neighbours, the official surveys, and on additional variables
Bangladesh and Sri Lanka. In joint work with that are usually not included in surveys.
Naila Kabeer, I explore factors that shape this
5
While studies can be divided into those focusing on supply side versus demand side explanations, there are several studies combining demand and supply side explanations, such as Klasen
and Pieters (2012); Neff et al. (2012), and so on.22
Since we wanted to focus on which specific practice is followed by both Hindus and Muslims,
internal constraints inhibit women from working, in recognition of which we label it more broadly
we asked specific questions about what their as ‘veiling’ and not as wearing a burqa or hijab.
primary responsibilities were: child care, elderly
care, standard domestic chores (cooking, washing As noted above, we implemented simple changes
clothes, etc.), and if they covered their heads/ to the official survey questionnaires in order to
faces always, sometimes, or never. The latter get better estimates of women’s work that lies
is taken as a proxy for cultural conservatism; in the grey zone. Accordingly, our estimates are
indeed, internationally, women covering their higher than official estimates, but even with
faces in public spaces is often attacked as an improved measurement, a little over half (52 per
oppressive practice. Of course, the context in the cent) get counted as ‘working’. This means that
West is different in that covering heads/faces participation in work is low, even after work in
is associated with being Muslim. In India, the the grey zone is included.
Is there an unmet demand for work?
Do women really want to participate in paid work, marriage or paid work is not a fair or realistic
or have they internalised the male breadwinner choice. We asked women who were currently not
model, which relegates them to care of the working if they would accept paid work if it were
home and family? What about the ‘income made available at or near their homes: 73.5 per
effect’, according to which women work only if cent said ‘yes’. When questioned further, 18.7 per
necessary for economic reasons, and withdraw cent expressed a preference for regular full time;
from work as soon as they don’t need to? What 7.8 per cent for regular part time; 67.8 per cent
about the marriage penalty, i.e. women drop for occasional full time; and 5.78 per cent for
out of the labour force once they are married? occasional part time. It would appear that there
Thus, women’s work might be a sign of economic was indeed a major unmet demand for paid
compulsions of trying to make two ends meet, work, whether regular or occasional, full time or
rather than an expression of their desire for part time, as long as the work in question was
economic independence. compatible with their domestic responsibilities.
Based on this, we suggest that being out of the
We explore the evidence for this in our survey. labour force is less a matter of choice for large
Married women are less likely to be working than numbers of women, and more a reflection of the
unmarried women, but marriage in India is near demands of unpaid domestic responsibilities.
universal, and asking women to choose either
Role of stigma or fear of sexual violence
There is a belief that women’s work outside the than rural. But the entire decline in LFPRs is due
home is stigmatised by family and society, and to rural women. Does this mean that stigma,
this sigma could be a factor underlying low LFPRs. which might be greater in urban areas, has
However, we should note that urban LFPRs have remained roughly constant, but has increased
always been lower than rural. If stigma is the in rural areas? This does not appear plausible.
main reason underlying this gap, then it follows Finally, the stigma of working outside the home
that urban women have faced greater stigma as a mark of low status is typically characteristic23
of upper caste women, as discussed in Section probability of urban women working outside
3; Dalit and Adivasi women have always worked the home. Borker (2018) finds that fear of sexual
outside the home in far greater proportions. But violence influences college choice by women in
as we noted above, the largest decline in LFPR Delhi; compared to men, they are more likely
has been for rural Scheduled Tribe women. to choose a lower quality college if the route
of travel is safer, as well as spend an amount
The only set of explanations that fit all these facts as high as double the average college tuition
is the following: (non)availability of work which to travel on a safer route. This evidence is
is compatible with domestic responsibility, i.e. entirely plausible: women are less likely to go to
either at or near the home or easy to get to. regions with high rates of public crimes against
women. Yet, these results do not shed light on
What about fear of sexual violence? Recent the persistence of low average labour force
studies6 find that perceptions of violence deter participation of Indian women. Also, the sexual
women from working outside the home—that violence and stigma narrative does not account
either women are less likely to work in regions for the decline which is driven by a decline in
with greater violence against women, or that the LFPRs of rural women, and especially of rural
increased reports of sexual violence reduce the Adivasi women.
Internal migration
Contrary to the stigma/fear of violence narrative, migration, but its importance has declined over
based on the Census figures for 2011, we see the last three decades. Between 2001 and 2011,
that nearly 70 per cent of internal migrants in the proportion of women migrating for work
India were women. This is not to suggest that increased by 101 per cent, which was more than
there are no risks of violence or concerns about double the rate for men (48.7 per cent).7 Women
safety of women as they migrate. Exploitative, who cited ‘business’ as a reason for migration
unsafe, informal working conditions with poor increased by 153 per cent during 2001–11, more
pay continue to characterise a large number of than four times the rate for men. Even women who
women migrants, who are vulnerable to sexual migrated for marriage ended up looking for work
violence. Yet, women are taking huge risks and and/or working. Thus, migration for marriage
are migrating in growing proportions. does not preclude women’s participation in
work; again, it all boils down to availability of
Marriage induced migration continues to be suitable work.
the single largest cause of women’s internal
Is the decline in FLFPR across the board?
The continuous focus on the decline in FLFPRs female dominated activities in health and
masks the fact that employment for some education. The increase in numbers of women
categories of women has increased over time. health professionals was driven by traditional
Most of this increase has been in jobs that are occupations, such as nurses and midwives. In
low paid, with long hours of work, no social urban areas, they reveal gains in employment in
protection, and/or hazardous. Mondal et al. white collar jobs within a small section of highly
(2018) record an increase in SHG-related work, educated urban women, notwithstanding the
classified as self-employment. They show overall picture of occupational segregation by
an increase in employment in traditionally gender.
6
http://ftp.iza.org/dp11874.pdf and https://www.sciencedirect.com/science/article/pii/S0305750X17303534
7
https://archive.indiaspend.com/cover-story/women-migrate-for-work-at-double-the-rate-that-men-do-9351224
Employer attitudes
The discussion on social norms or cultural one-woman employee is strongly influenced by
barriers is concentrated on cultural attitudes that firm characteristics such as location and size,
prevent women from accessing paid jobs. Das et after controlling for which employer attitudes
al. (2019) investigate if there are cultural factors are not a significant determinant of whether or
that bias employers against hiring women. not the firm hires a woman. The implication of
Based on a unique survey of over 600 firms in their findings is that culture might be slow to
three large cities of Madhya Pradesh, they find change, but policies aimed at increasing female
that the likelihood of the firm having at least employment need not wait for cultural change.
2.2 Gender Wage Gaps: Labour Market Discrimination
The discussion on gender bias by employers leads Deshpande et al. (2018) analyse the issue of
us to a discussion of labour market discrimination gender parity in wages by focusing on the
which would result in wage gaps. Indeed, in evolution of male–female wage gaps for an
addition to clear and persistent differences in emerging economy, India, and decompose the
LFPRs, data reveal sharp gender wage gaps, the gaps to understand patterns of gender-based
latter consistent with international experience. labour market discrimination. The paper uses
Mahajan and Ramaswami (2017) investigate EUS data from two large NSS rounds: the 55th
the apparent paradox that gender wage gaps round in 1999–2000 and the 66th round in 2009-
in agricultural wages are higher in south India, 10 to explore gender wage gaps among Regular
a region with more favourable indicators for Wage/Salaried (RWS) workers, not only at the
women, compared to north India. They examine mean, but along the entire distribution to see
whether this could be due to Esther Boserup’s ‘what happens where’, i.e. assess where in the
proposition that higher gender gaps in the south wage distribution are gaps higher.
are due to higher female LFPRs in that region
(Boserup, 1970). They find that differences in The gaps are decomposed into an ‘explained
female labour supply are able to explain about component’ (due to gender differences in wage
55 per cent of the gender wage gap between the earning characteristics), and the ‘unexplained
northern and southern states of India. component’ (due to gender differences in
the labour market returns characteristics).
Formal sector, urban labour markets, presumably The latter is treated as a proxy for labour
more meritocratic, are not immune to gender market discrimination. The paper performs the
wage differences either. Varkkey and Korde (2013) standard mean decomposition9 and quantile
document gender pay gaps using paycheck data decomposition,10 evaluates changes in each of
between 2006 and 2013 for 21,552 respondents, these over the 10-year time period between the
of which 84 per cent were males. This data is two NSS rounds.
based on a voluntary internet survey conducted
among formal sector workers, and hence, the The main findings are as follows: in a four-way
sample is not representative. They find that the division of workers into Self-Employed, RWS
pay gap increased with skill level and position in workers, Casual Labour and Unemployed, in
the occupational hierarchy.8 2009–10, the sharpest gap was in the proportion
of male and female workers in RWS work. The
8
These findings are at variance with our findings of a sticky floor. This is perhaps because their sample is not representative and is restricted to internet users. Also, their educational categories
are not comparable to ours.
9
Using the Blinder–Oaxaca method.
10
Using Melly’s refinement of the Machado–Mata decomposition method.25
average (raw/unconditional) wage gap for RWS the discriminatory component of the wage gap
workers, expressed as a percentage of female has also increased. In 2009–10, if women were
average wages, declined from 30 per cent to 26 paid like men, they would earn more than men
per cent over this decade. At the same time, on account of their characteristics.
educational attainment of women increased
over the decade, and a greater proportion of Moving beyond average wages, for both years,
women are in professional occupations than male wages are higher than female wages across
men, which could explain some of the decline the entire wage distribution. For both years, the
in average wage gap. Both in 1999–2000 and in gender wage gap decreases as we move from
2009–10, average female wages were less than lower to higher deciles. In 2009–10, the highest
male within the same education level, occupation gap across deciles is at the 1st decile (103 per
and industry, and type of work, i.e. public versus cent), and it declines steadily thereafter to reach
private sector, permanent or temporary, union approximately 7 per cent at the 9th decile. Thus,
member or not. for both years, we see the existence of the ‘sticky
floor’, in that wage gaps are higher at lower ends
The decomposition exercise indicates that the of the distribution and steadily decline over the
bulk of the wage gap is unexplained, i.e. possibly distribution. We can see this pattern clearly in
discriminatory. While average characteristics for Figure 2.
women in RWS have improved over the decade,
Gender log wage gaps across percentiles and at the mean
Figure 2:
Gender log wage gaps across percentiles and at the mean with 95% CI, 1999-2000 and
2009-2010.
Gender log wage gaps across Percentiles and at the Mean
1
.8
.6
.4
.2
0
0 20 40 60 80 100
percentile
Percentile 1999-2000 Lower CI Upper CI
Percentile 2009-2010 Lower CI Upper CI
Mean 1999-00 Lower CI Upper CI
Mean 2009-10 Lower CI Upper CI
Source: Deshpande, Goel and Khanna (2018), p. 33626
Based on decompositions, the paper also skills as they are perceived to be inferior in these
shows that RWS women at the lower end of the skills relative to men. Ironically, the biggest
distribution face higher discriminatory gaps in constraint for women to access paid employment
wages. opportunities, i.e. societal expectations about
their primary role as being responsible for
An analysis of the gender pay gap captures reproductive labour, which includes domestic
one crucial dimension of discrimination. Das work and care duties, becomes a key factor
et al. (2019) document literature showing based on which employers discriminate against
discriminatory attitudes towards women that them. Women are seen as having low attachment
affect women’s labour supply as well as demand. to labour markets, and are routinely assigned to
They cite studies that show how women are less ‘female’ occupations that require caregiving or
likely to be hired in jobs which require technical domestic skills.
2.3 Wage Gaps: Glass Ceilings Versus Sticky Floor
In contrast to Western developed economies, At the higher end of the wage distribution the
gender wage gaps in India (similar to China and nature of jobs is very different from those at
several other countries) exhibit a sticky floor, the bottom. The women working in these jobs
and not a glass ceiling, i.e. these are higher at are more likely to be the urban educated elite
the bottom of the wage distribution than at the working in managerial or other professional
top. positions. These high wage earning women are
more likely to be aware of their rights and might
One explanation for the sticky floor might be the be in a better position to take action against
statistical discrimination by employers. As noted perceived discrimination. Employers would
above, in India, social norms place the burden be aware of these possibilities themselves,
of household responsibilities disproportionately and hence, may not be able to discriminate a
on women. Because of this, men are perceived great deal between similarly qualified men and
to be more stable in jobs vis-à-vis women. Given women. Second, the payment mechanism in
the higher probability of dropping out of the these jobs would be far more structured and
labour market, employers discriminate against rigidly defined. Whether in the public sector or
women when they enter the labour market the private sector, most high paying jobs will
because they expect future career interruptions. have written contracts with predefined clauses
As women move up the occupation structure and for basic increases in salaries, year on year.
gain job experience, employers become aware
of their reliability and therefore discriminate Contrast this to a situation where an employer
less. Men usually have more work experience is paying a regular wage to a woman with no
or tenure than women on average. Women who education working in an elementary occupation,
have high levels of education and are at the which is a typical example of a worker at
top end of the distribution might be perceived the bottom of the wage distribution in the
to have high levels of commitment, and due to Indian context. It is easier for the employer to
their past investments in education are thought discriminate in this case, as these jobs are in
to be stable employees. the informal sector and outside the jurisdiction27
of labour laws. Women at the bottom have less larger at the bottom of the distribution.
bargaining power compared to men due to
family commitments or social custom, and are Job segregation is also a known contributor to
more likely to be subject to the firms’ market wider gaps at the bottom as men and women
power. Thus, a sticky floor could arise because only enter into exclusively ‘male’ and ‘female’
anti-discriminatory policies are more effective jobs. Low skilled jobs for women may pay less
at the top of the distribution. than other jobs that require intense physical
labour, which men typically do. Our model
Article 39 of the Indian Constitution envisaged specifications control for broad industry and
equal pay for equal work for both men and occupation groups; however, within certain low
women. To this end, legislations such as the Equal paying broad industrial categories, men and
Remunerations Act (1976) were enacted after the women could be doing different kinds of jobs
equal remuneration ordinance was introduced and that could be picked up as the discrimination
in the year 1975. Absence of strong minimum component.
wage legislations means that wage gaps can be
Image Credit: SWEAYou can also read