How Spatial Audio affects Motion Sickness in Virtual Reality
←
→
Page content transcription
If your browser does not render page correctly, please read the page content below
B ACHELOR ’ S T HESIS

           How Spatial Audio
         affects Motion Sickness
            in Virtual Reality

Author:                                               Supervisors:
Tim P HILIPP                           Prof. Dr. Stefan R ADICKE
Matricel no.: 32230                          Prof. Oliver C URDT

       A thesis submitted in fulfillment of the requirements
             for the degree of Bachelor of Engineering

                              in the

                 Faculty Electronic Media
           Study Programme Audio Visual Media

                          January 9, 2020
iii

Declaration of Authorship
Hiermit versichere ich, Tim P HILIPP, ehrenwörtlich, dass ich die vorliegende
Bachelorarbeit mit dem Titel: „How Spatial Audio affects Motion Sickness in Virtual
Reality“ selbstständig und ohne fremde Hilfe verfasst und keine anderen als die
angegebenen Hilfsmittel benutzt habe. Die Stellen der Arbeit, die dem Wortlaut
oder dem Sinn nach anderen Werken entnommen wurden, sind in jedem Fall unter
Angabe der Quelle kenntlich gemacht. Die Arbeit ist noch nicht veröffentlicht oder
in anderer Form als Prüfungsleistung vorgelegt worden.

Ich habe die Bedeutung der ehrenwörtlichen Versicherung und die prüfungs-
rechtlichen Folgen (§26 Abs. 2 Bachelor-SPO (6 Semester), § 24 Abs. 2 Bachelor-SPO
(7 Semester), § 23 Abs. 2 Master-SPO (3 Semester) bzw. § 19 Abs. 2 Master-SPO (4
Semester und berufsbegleitend) der HdM) einer unrichtigen oder unvollständigen
ehrenwörtlichenVersicherung zur Kenntnis genommen.

I hereby affirm, Tim P HILIPP, on my honor, that I have written this bachelor thesis
with the title: “How Spatial Audio affects Motion Sickness in Virtual Reality”
independently and without outside help and did not use any other aids than those
stated. The parts of the work that were taken from the wording or the meaning of
other works are in any case marked with the source. The work has not yet been
published or submitted in any other form as an examination performance.

I have taken note of the significance of the assurance on honor and the consequences
under examination law (§26 paragraph 2 Bachelor-SPO (6 semesters), §24 paragraph
2 Bachelor-SPO (7 semesters), §23 paragraph 2 Master-SPO (3 semesters) or §19
paragraph 2 Master-SPO (4 semesters and part-time) of the HdM) of an incorrect
or incomplete assurance on honor.

Signed:

Date:
v

“A sure cure for seasickness is to sit under a tree. ”

                                                         Lord Nelson (1758 - 1805)
vii
HOCHSCHULE DER MEDIEN
Abstract
Electronic Media
Study Programme Audio Visual Media
Bachelor of Engineering
How Spatial Audio affects Motion Sickness in Virtual Reality
by Tim P HILIPP
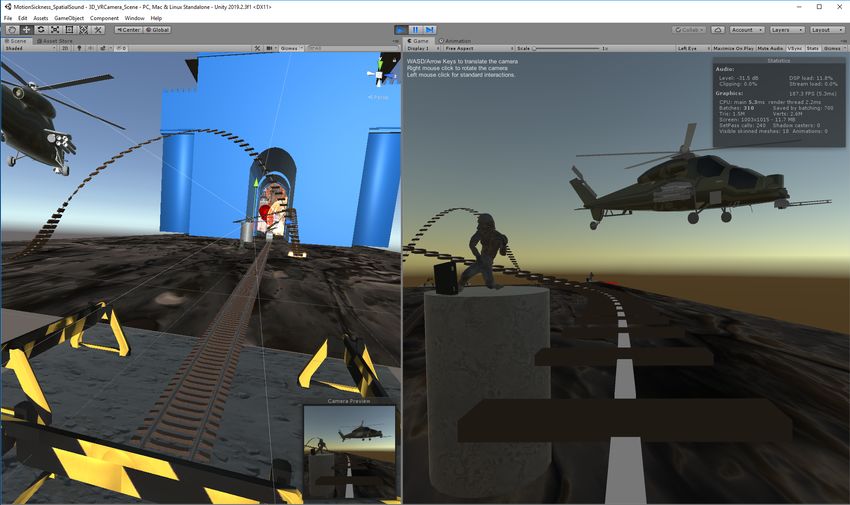
In this research work I examine the effects of spatially perceptible ambient sound on
visually induced motion sickness (VIMS) in Virtual Reality (VR).
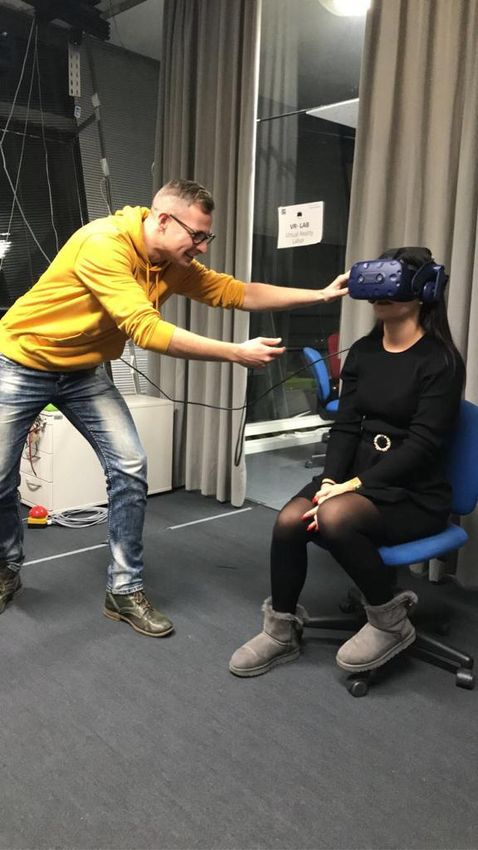
For this purpose, I will let a total of 38 participants, divided into two test groups,
experience the same VR application twice, one with stereo and one with spatial
audio setup. While measuring their pulse, I let the users travel in a moving vehicle
a 5-minute ride along a winding track with ascents and descents at medium speed.
Before the journey, the general susceptibility for motion sickness is recorded,
between and after the test units the current symptoms are queried by means of
a questionnaire developed especially for simulator sickness.
The test results then give me information whether the use of surround sound has a
positive effect on the VIMS in virtual environments.
In dieser Forschungsarbeit untersuche ich die Auswirkungen von räumlich
wahrnehmbaren Umgebungsgeräuschen auf die visuell induzierte Bewegungs-
krankheit in Virtual Reality (VR).
Dazu lasse ich insgesamt 38 Teilnehmer, aufgeteilt in zwei Testgruppen, die gleiche
VR-Anwendung zweimal erleben, einmal mit Stereo und einmal mit räumlichem
Audio-Setup. Während der Pulsmessung lasse ich die Benutzer in einem fahrenden
Fahrzeug eine 5-minütige Fahrt auf einer kurvenreichen Strecke mit Auf- und
Abstiegen bei mittlerer Geschwindigkeit durchführen. Vor der Fahrt wird die
allgemeine Anfälligkeit für die Bewegungskrankheit erfasst, zwischen und nach
den Testeinheiten werden die aktuellen Symptome mit Hilfe eines speziell für die
Simulatorkrankheit entwickelten Fragebogens abgefragt.
Die Testergebnisse geben mir dann Auskunft, ob sich der Einsatz von Surround-
Sound in virtuellen Umgebungen positiv auf die Bewegungskrankheit auswirkt.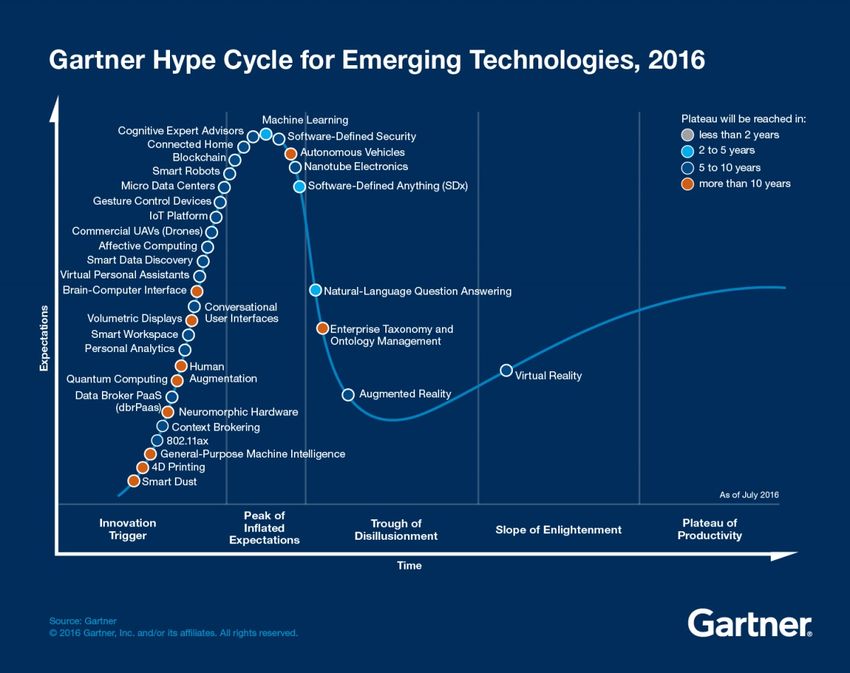
ix

       Acknowledgements
            Prof. Dr. Stefan Radicke
              Prof. Oliver Curdt
                 Lisette Vonk
              Dr. Jurriaan Mulder
       Stuttgart Media University (HdM)
Amsterdam University of Applied Sciences (HvA)
                 Dennis Boon
xi

Contents

Declaration of Authorship                                                                    iii

Abstract                                                                                     vii

Acknowledgements                                                                             ix

1   Introduction                                                                              1
    1.1   Motivation . . . . . . . . . . . . . . . . . . . . . . . . . . . . . . . . . . .    1
    1.2   Related Research Papers on Motion Sickness and Sound . . . . . . . .                3
          1.2.1   Demonstrating the Potential for Dynamic Auditory Stimulation
                  to Contribute to Motion Sickness . . . . . . . . . . . . . . . . . .        3
          1.2.2   Pleasant music as a countermeasure against visually induced
                  motion sickness . . . . . . . . . . . . . . . . . . . . . . . . . . . .     3
          1.2.3   Visual-vestibular conflict induced by Virtual Reality in humans             4
    1.3   Preview of the Thesis . . . . . . . . . . . . . . . . . . . . . . . . . . . . .     4

2   Stereoscopic Vision and Displays                                                          5
    2.1   Human visual system and depth perception . . . . . . . . . . . . . . . .            5
    2.2   Technical characteristics of Head Mounted Displays . . . . . . . . . . . 10
    2.3   Overview and comparison of current Head Mounted Displays . . . . . 15
          2.3.1   Product choice and explanation . . . . . . . . . . . . . . . . . . . 16

3   Audio and Spatial Sound                                                                  19
    3.1   History and recent Development . . . . . . . . . . . . . . . . . . . . . . 19
    3.2   Sound Waves . . . . . . . . . . . . . . . . . . . . . . . . . . . . . . . . . 23
    3.3   Human Audio Perception . . . . . . . . . . . . . . . . . . . . . . . . . . 24
          3.3.1   Interaural Time Difference . . . . . . . . . . . . . . . . . . . . . . 25
          3.3.2   Interaural Intensity Difference . . . . . . . . . . . . . . . . . . . 25
          3.3.3   Blauert Bands . . . . . . . . . . . . . . . . . . . . . . . . . . . . . 26
          3.3.4   Head-Related Transfer Function . . . . . . . . . . . . . . . . . . 27
    3.4   Spatial Game Audio . . . . . . . . . . . . . . . . . . . . . . . . . . . . . 29

4   Kinetosis (Motion Sickness)                                                              39
    4.1   Vestibular system . . . . . . . . . . . . . . . . . . . . . . . . . . . . . . . 40
    4.2   Motion Sickness Susceptibility Questionnaires (MSSQ) . . . . . . . . . 41
    4.3   Simulator Sickness Questionnaire (SSQ) . . . . . . . . . . . . . . . . . . 41
xii
5 Experimental Setup Description 45
5.1 Research Components . . . . . . . . . . . . . . . . . . . . . . . . . . . . 45
5.2 Metrics . . . . . . . . . . . . . . . . . . . . . . . . . . . . . . . . . . . . . 45
5.3 Hypothesis . . . . . . . . . . . . . . . . . . . . . . . . . . . . . . . . . . . 50
5.4 Execution . . . . . . . . . . . . . . . . . . . . . . . . . . . . . . . . . . . . 51
5.5 Test Results . . . . . . . . . . . . . . . . . . . . . . . . . . . . . . . . . . 51
6 Evaluation 55
6.1 Metrics Assignment . . . . . . . . . . . . . . . . . . . . . . . . . . . . . . 55
6.2 Main Conclusion . . . . . . . . . . . . . . . . . . . . . . . . . . . . . . . 61
6.3 Room for Interpretation . . . . . . . . . . . . . . . . . . . . . . . . . . . 61
6.4 Further Research Potential . . . . . . . . . . . . . . . . . . . . . . . . . . 62xiii
List of Abbreviations
VIMS Visually induced Motion Sickness
VR Virtual Rreality
AR Augmented Rreality
MR Mixed Rreality
e.g. exempli gratia (Latin), meaning “for example”
VVC visual-vestibular conflict
CGI Computer-Generated imagery
MSQ Motion Sickness Questionnaire
SSQ Simulator Sickness Questionnaire
HMD Head Mounted Display
DoF Depth-of-Field
LCD Liquid Crystal Display
OLED Organic Light Emitting Diode
AMOLED Active Matrix Organic Light Emitting Diode
TFT thin-film-transistor
i.e. id est (Latin), meaning „that is to say“
fps frames per second
CFF critical flicker frequency
HFR higher frame rate
IT Information Technology
DoF Degrees of Freedom
HDMI High-Definition Multimedia Interface
USB Universal Serial Bus
ppi pixels per inch
USP Unique Selling Point
HiRes High Resolution
CD Compact Disc
PCM pulse code modulation
SNR signal-to-noise-ratio
DAW Digital Audio Workstation
MIDI Musical Instrument Digital Interface
SQNR signal-to-quantization-noise-ratio
ITD Interaural time difference
IID Interaural intensity difference
API Application Programming Interfacexiv
SDK Software Development KIT
DSP Digital Signal Processor
CNS central nervous sysytem
IEEE Institute of Electrical and Electronics Engineersxv
Physical Constants
m
Speed of Light c0 = 2.99792458e8 × 108 s (exact)
m
Speed of Sound vsound in air = 340.29 s (approx)xvii
List of Symbols
m
c0 Speed of Light s
f Frequency Hz
1
T Period Hz = s
λ Wavelength m
A Amplitude m
Φ Phase rad
x Distance m
m
v Velocity s
t Time s1
Chapter 1
Introduction
1.1 Motivation
Virtual Reality, VR for short, is currently
on everyone’s lips. Although the
Gartner Hype Cycle 2016 still predicted
a breakthrough for VR ("Slope of
Enlightenment"), the technology is
not included in this year’s forecast of
the market research company, as are
Augmented Reality (AR) and Mixed
Reality (MR). The reason for this is the
fact that VR is already almost mature
and the technology is predicted to reach
the high level of maturity ("Plateau of Fig. 1.1 Gartner (2016): Hype Cycle For
Productivty") in three to eight years Emerging Technologies
from now. Partly this new technology is
seen as an opportunity for some areas but it is not yet possible to estimate what effect
a continuous consumption will have on the human psyche and body. Long-term
studies on this topic are not available yet. In my following thesis I will therefore
explore how different stereo or spatial sound sources affect the human sense of
balance in VR.
Before I begin to dive further into the test scenario, it is good to take a step back and
understand the illusions of presence in order to achieve the intended VR experience
for my test audience. Presence in a synthesized multi-sensory environment is
generally defined as a user’s subjective sensation of "being there" in a scene depicted
by a medium (Barfield and Furness 1995), usually virtual in nature. In the field of
presence research, VR is therefore located between real experience and hallucination
and characterized by a sensory or non-sensory experience of para-authentic or
artificial objects (Lee 2004).2 Chapter 1. Introduction
Presence is a psychological state or subjective perception in which even though part or all
of an individual’s current experience is generated by and/or filtered through human-made
technology, part or all of the individual’s perception fails to accurately acknowledge the
role of the technology in the experience. (Presence Research[online] 2000)
For me personally, a research work in this intermediate space of human senses
represents a special fascination. It’s not only the borderline experience of human
resilience that plays a role but also the approach and gradual fusion of human
individuals with computer technology built by him.
Much has been said about the positives of VR technology that can reshape reality
or even create a new one, be it creating new methods of communication, of medical
treatment or of military training. But in my opinion we should also be aware of
the potential negatives of reality technologies. The high speed with which new
technologies develop may be the basic problem here: As soon as new possibilities in
science or technology become public, the industry and economy immediately insists
on pouring them into products and investment options as quickly as possible in
order to withstand the pressure of our commercialized financial world. The problem
isn’t the technology; it’s that its adoption rate has been so relatively quick that
people, society and potential thoughts on consequences haven’t had a chance to
catch up. In early technologies, be it the vehicle or the color TV, we can see a steep
but still relatively prolonged adoption rate. But when it comes to the smartphone,
the internet or mobile AR the lines are nearly vertical.
Fig. 1.2 Stephanie Llamas, Nielsen/SuperData Research (2019):
Technology adoption rates, share of U.S. households, 1960 - 2020
So, questions about ethics, sense and last but not least the consequences for nature,
people and health fall by the wayside. I would like to oppose this compulsion for
high-speed development by taking a step backwards and discuss the question of an
immersive, visual digital burden on human health.1.2. Related Research Papers on Motion Sickness and Sound 3
Indeed, VR is perfect for creating environments in which to test, train, teach and
treat people. That’s because this technology can be used to create the ultimate
Skinner box (Skinner 1935): In this experiment rats were conditioned (so-called
operant conditioning) differently in a box with the help of a lever. Pressing the
lever was the desired behavior. After pressing the lever, different consequences
followed in different test series. Depending on the amplifier, the behavior of
the rat changed as follows: Positive/negative amplification or positive/negative
punishment. Accordingly, it is possible to put someone in a (virtual) environment,
let him interact in 3D space and actually change how his brain functions, e.g.
reducing the peoples’ implicit racial bias (Hasler, Spanlang, and Slater 2017).
I would like to highlight the physical effects of VR usage and try to establish a
relation between the auditory spatiality and the influence on the sense of balance
during an experience. My assumption here is that spatially occurring sounds have a
considerable influence on the VIMS. My theory is that sound - similar to the strength
of anxiety in a horror movie - has a significant and, in my opinion, underestimated
value. For this very reason, I will prove in this present work that 3D auditory sensory
impressions have a remarkable influence on the human balance perception.
1.2 Related Research Papers on Motion Sickness and Sound
1.2.1 Demonstrating the Potential for Dynamic Auditory Stimulation to
Contribute to Motion Sickness
The study found that motion sickness was not affected by the inclusion of
corresponding auditory information such that visual-only and combined auditory
plus visual cues elicited comparable sickness results. In contrast, auditory cues
increased the level of vection when they were added to the corresponding visual
stimulus whereas vection elicited by pure auditory stimulation was rather weak.
Most interestingly, motion sickness symptoms induced by pure auditory stimulation
were observed in a sub-set of participants, demonstrating the existence of auditorily
induced motion (Keshavarz, Hettinger, et al. 2014). With the help of this basic
consideration I prepare my application with sound sources that correspond to
what is currently seen as well as those that can only be heard in the background.
The resulting mix of visible and subtle audio sources will cause motion sickness
symptoms and make my results more meaningful.
1.2.2 Pleasant music as a countermeasure against visually induced
motion sickness
In this article (Keshavarz and Hecht 2014) , the researchers found that when
factoring the subjective pleasantness of music, a significant reduction of VIMS
occurred only when the presented music was perceived as pleasant, regardless of
the music type. On the basis of these results I decide to build my test application4 Chapter 1. Introduction with a dark auditory basic mood and to extend it at some places with rhythmically pleasing but also heroically epochal music. I hope to create a broad emotional arc between tension, excitement and joy for the testers in order to achieve significant and meaningful results at certain points of the test ride. 1.2.3 Visual-vestibular conflict induced by Virtual Reality in humans In this study, the researchers examined the development of subjective sickness- and balance related symptoms and objective equilibrium ataxia induced by visual–vestibular conflict (VVC) stimulation using VR. The study suggests that the VVC inputs are processed in different pathways causing subjective autonomic symptoms and postural instability in humans (Akiduki et al. 2003). I take this caused instability as a basis for my approach to visually induce the participants motion sickness in VR. 1.3 Preview of the Thesis In this study, I used a VR-based 3D environment to imitate a real-world situation. I put a moving vehicle on a track to mimic realistic motion stimuli, surrounded the scene with computer-generated imagery (CGI) and implemented different audio sources the enhance the level of realism and immersion. Subjects are asked to sit in the vehicle to explore the ride. It was found that this scene is sufficient enough to induce simulator sickness symptoms almost identical to real motion sickness. First, the Motion Sickness Questionnaire [(Golding 1998), (Golding 2006a)] (MSSQ-Short) is used to indicate the vulnerability of the test subjects, then the heart rate is observed during the experience and the Simulator Sickness Questionnaire (R. S. Kennedy et al. 1993) (SSQ) is filled in between and afterwards to determine typical symptoms of simulator sickness.
5

Chapter 2

Stereoscopic Vision and Displays

Head-mounted displays, or HMDs, are an almost
ancient piece of tech which have begun to see a
reboot in the past few years as computers get more
powerful and the games inside them more visually
spectacular by the day. They are probably the most
instantly recognizable objects associated with VR.
As such, they are also referred to sometimes as ’VR
headsets’ or ’VR glasses’. HMDs attach straight to
the head and present visuals directly to the eyes, and
perhaps most excitingly, to the peripheral vision as
well. As humans, the vision systems have evolved
to a point where we have very high resolution in the     Fig.   2.1    Sutherland,    I.E.
front, wherever we’re looking. Also, humans have (1968): A Head -Mounted Three-
                                                                Dimensional Display
very low resolution on the periphery but motion
in the periphery is something that we pick up on
because there could be a threat.
HMDs are not only used in VR gaming, they’ve also been utilized in military,
medical and engineering contexts to name a few. As seen in films such as The
Terminator (1984), these devices can be used to create AR which overlays digital
information through an HMD filter onto the real world. They also have an incredible
range of use. In order to allow the best possible experience with an HMD, I listed a
number of basic principles and technologies below that need to be incorporated.

2.1   Human visual system and depth perception
Light-sensitive sensory cells on the retina are responsible for color vision. There are
two types of these photoreceptors: Rods and cones. Both receptor types contain
visual pigments that react to a specific wavelength between 780 nm (red) and
380 nm (violet). The visual pigment embedded in the rods is called rhodopsin,
the visual pigment of the cones is called iodopsin. Rhodopsin and iodopsin are
light-sensitive protein molecules with different dye additives. They change their
6 Chapter 2. Stereoscopic Vision and Displays
chemical composition as soon as light enters the receptor cells. The retina of the
human eye is covered with about 120 million rods that are optimized for twilight
vision. They mainly perceive light-dark contrasts and convey the perception of grey
tones (detection sensitivity). The approximately seven million cones are responsible
for high-resolution color vision during the day and the perception of movement.
They occur in three specialized types which differ in the composition of the visual
pigment and the corresponding observed wavelength. There are cones whose visual
pigment responds most strongly to red, green or blue whereas green contains
the highest brightness information. The chemical process that is triggered in the
photoreceptors by the absorbed light energy converts the optical signal into an
electrical nerve impulse. Subsequently, the so-called ganglion cells convert this
electrical stimulus into a neural signal that reaches the brain via different switching
points and pathways.
Humans have two eyes which means we can receive monocular and binocular
depth cue information. Monocular depth cues require the use of only one eye
whereas binocular depth cues require the use of both eyes working together in
order to provide information to the brain about depth and distance. The following
signal processing factors are important for monocular stimuli:
Motion parallax refers to the fact that
objects moving at a constant speed
across the frame will appear to move a
greater amount if they are closer to an
observer (or camera) than they would if
they were at a greater distance.
Fig. 2.2Krantz, J. H., Schwartz, B.L. (2015):
ISLE 7.5 (a1): Motion Parallax Illustrated
Perspective: On a drawing in central
perspective two lines converge at a point
in the horizon. Between the lines there
are two bars, one further down on
the paper (perspectively in front) and
one further up (perspectively further
away). The upper bar is perceived as
larger although both lines have the same
length. Fig. 2.3 Ponzo, M. (1913): rail illusion2.1. Human visual system and depth perception 7
Object size: Relative object size refers
to the tendency to visually perceive the
object that produces the largest image
on the retina as being closer and the
object that produces the smallest image
on the retina as being further away.
However, the objects being perceived
must be expected to be about the same Fig. 2.4 Ebbinghaus, H. (1890): Ebbinghaus
size in real life. illusion (l)., Delboeuf, J. R. L. (1865): Delboeuf
illusion (r.)
Accommodation involves the automatic
adjustment of the shape of the lens to
focus an object in response to changes in
how far away the object is. It bulges to
focus on nearby objects and flattens to
focus on objects further away. The brain
then judges distances by how much the
lens bulges or elongates.
Fig. 2.5 Sweet, B., Kaiser, M. (2011): Depth
Perception, Cueing, and Control
Depth-of-Field (DoF): Blur in images
can create the sensation of depth
because it emulates an optical property
of the eye; namely, the limited depth of
field created by the eye’s lens. When the
human eye looks at an object, this object Fig. 2.6 Mauderer, M. , Conte, S. ,
appears sharp on the retina but objects Nacenta, M. A., Vishwanath, D. (2014):
at different distances appear blurred. Depth perception with gaze-contingent depth of
field8 Chapter 2. Stereoscopic Vision and Displays
Occlusion is produced by partially
overlapping objects: Objects that
partially block other parts of the scene
are perceived to be closer to an observer
than the blocked objects (and vice
versa).
Fig. 2.7 McIntire, J., Havig, P. R., McIntire
L. (2009): Ideas on authenticating humanness
in collaborative systems using AI-hard problems
in perception and cognition
Lighting (shading, reflection and
illumination): Brightness of a surface
depends on its orientation with respect
to the light source. The visual system
assumes that the light comes from
above (sun). Brighter patches appear to
be tilted up facing the light. Also, the
interpretation of shape from shading Fig. 2.8 Adelson, E. H. (1995): The checker
shadow illusion
interacts with the interpretation of
shape from contours.
The following signal processing factors are important for binocular stimuli:
Retinal Disparity (Stereopsis) refers to
the very slight difference in the location
of the visual images on the retinae which
enables humans to make judgements
about the depth or distance of an object.
Fig. 2.9 Cooper, R. (1995): How to See 3D2.1. Human visual system and depth perception 9
Convergence involves the brain
detecting and interpreting depth or
distance from changes in tension in the
eye muscles that occur when the two
eyes turn inwards to focus on objects
that are close. The brain interprets
greater tension in the eye muscles as
an object gets closer and less tension
as an object gets further away. As a Fig. 2.10 Duane, A. (1912): Normal values
person ages, the ability to accommodate of the accommodation at all ages Journal of the
American Medical Association, pp. 1010-
decreases resulting in the condition 1013
called presbyopia.
Stereoscopic Rendering simply renders
two views, one for each exact eye
position and provides a single, correct
3D view relative to the display.
Fig. 2.11 Marten, C. (2011): Stereoscopic
Rendering tinySG
Technically there are two types of stereoscopic displays:
• Simultaneous (parallel), e.g. HMDs, polarization displays (linear or
circular) or autostereoscopic displays (lenticular or parallax barrier):
Providing each eye its own set of pixels, color and display.
• Time sequential (alternate), e.g. Active Shutter or Passive Polarized
Glasses: Providing each eye its own time slot.10 Chapter 2. Stereoscopic Vision and Displays
2.2 Technical characteristics of Head Mounted Displays
Display Technologies: Today’s HMDs are usually built with two LCD, OLED or
AMOLED monitors integrated into the glasses.
LCD, short for Liquid Crystal Displays,
use polarizing filters and emit linearly
polarized light. Liquid crystals do not
produce light themselves. LCDs require
backlighting. The spiral liquid crystals
wind up to a greater or lesser extent
depending on the amperage and allow
more or less light to pass through.
Between two crossed polarizing
filters the liquid crystals change the
Fig. 2.12Wuerger, S. M. (2011): Visual
polarization direction of the light gamma correction for LCD displays
depending on their orientation.
Organic Light Emitting Diode (OLED) is a further
development of the light emitting diode (LED). In
contrast to LEDs, coloured self-luminous OLEDs
consist of organic semiconductors that emit light in
an electric field. The cathode generates the electrons
which are injected via the Electron Injection Layer
(EIL) and drift via the Electron Transport Layer
(ETL) to the Emission Layer (EML). In the EML, an
organic light-emitting polymer layer, the electrons
and the holes recombine to form an electron-hole
Fig. 2.13 Ruhstaller, B. (2011):
pair, an exciton. The holes are injected from the Advanced Numerical Simulation of
hole injection layer (HIL) and drift through the hole Organic Light-emitting Devices
transport layer (HTL) to the emission layer (EML)
due to the voltage potential between anode and cathode. When the electrons are
recombined with the holes, they emit photons as visible light.
AMOLED means Active Matrix Organic Light Emitting Diode. The single pixels are
controlled by an Active Matrix. Each pixel has its own power connection and is thus
made to glow. The active matrix is responsible for the electronics and control of the
TFT (thin-film transistor) layer. An image is displayed line by line, i.e. sequentially.
This technology uses a TFT with a capacitor memory which stores the pixel lines.2.2. Technical characteristics of Head Mounted Displays 11
The refresh rate indicates how many
images are displayed in one time unit. It
is a characteristic value for the sequence
of moving image sequences and for the
flicker-free representation. The image
repetition in fast sequences is necessary
to bypass the sluggishness of the eye
and to make moving objects in images
appear continuous. The number of Fig. 2.14 Muggeridge, E. J. (1878): The Horse
frames per second (fps) is calculated in Motion
from the refresh rate. The critical flicker
frequency (CFF) depends on age and lies between 22 Hz and 90 Hz. This is the
cut-off frequency at which the human eye can no longer distinguish a periodic
light stimulus from a uniformly luminous one. As a comparison: Cinematic film
generally runs at a uniform rate of 24 fps. However, The Hobbit (2012) was the first
film to transition to a higher frame rate (HFR) of 48 fps. This caused the film to look
very smooth or ’hyper real’. But it has had a mixed reception from audiences – some
people report that this newer frame rate feels less immersive. In VR, a refresh rate of
90 Hz is recommended. Setups that operate below 90 fps are more likely to induce
nausea and disorientation (IrisVR[online] 2009). If the frame rate drops down to the
30 to 60 fps range it can lead to jumping and stuttering images and therefore break
the immersion even more.
Latency is the delay time that elapses between the occurrence of a particular event
and the subsequent event expected to occur. In the information technologies (IT),
latency is the travel time required by data from the source to its destination.
Although the quantized IT world works at almost the speed of light (c0 =
m
2.99 × 10⁸ s ), circumstances such as material processing, shielding, translation of
individual components or worn can affect the latency. In order for VR devices to
provide an immersive world, the setup requires very low latencies. An absolutely
top-notch experience usually equals a latency of 20 ms or less.
Optics: In order to create that immersive
feeling of inhabiting a virtual world, a
predistorted image has to be stretched
(Pincussion distortion) to entirely fill the
visual field. This effect is achieved by
using a Fresnel lens. It consists of a
concentric series of simple lens sections
and results in a thin lens with short focal
length and large diameter. In doing so, Fig. 2.15 Tykkälä, T. (2013): Real-time
image-based RGB-D camera motion tracking
the lens distributes more even resolution and environment tracking
area and less distortion.12 Chapter 2. Stereoscopic Vision and Displays
The quality of the lens is also significant
to avoid poor picture quality, low clarity,
and unwanted distortions. The pixel-
based predistorted image must then be
corrected in graphics rendering (Barrel
distortion) using linear interpolation.
Fig. 2.16 Kilgard, M. (2016): NVIDIA
OpenGL in 2016
Head Tracking is important for viewing and
interaction in VR. In general, there are two different
approaches for tracking head movement: 3 Degrees
of Freedom (DoF) and 6 DoF. Where 3 DoF only
allows turning and rotating (rotation around 3 axes:
orientation - yaw, pitch, roll) of the head, 6 DoF
allows to walk through (rotation around 3 axes:
orientation + translation along 3 axes: position -
yaw, pitch, roll, up/down, left/right, forward/back)
and explore the environment even more precise. Fig. 2.17 Kilograph.com (2017):
The accuracy of the parameters can be calculated Virtual Reality and 6 degrees of
absolute and relative. HMDs accomplish this using freedom
an optical process with infrared, gyroscope and
accelerometers. The software’s speed in turning the head position information into
visual information is vital to the immersion of the virtual world. To acknowledge
the head’s position and transform that into data, the HMD needs an accurate head
tracking technology. A distinction is made between two procedures: Inside-Out
and Outside-In tracking. It is defined by where the photons originate and where
they are received. The Inside-Out procedure places the corresponding sensor on the
user whereas the Outside-In tracking procedure places the sensor in the immediate
environment. In addition, these procedures can be supported by so-called fiducial
markers. These markers are visible objects placed in an imaging system (e.g. camera)
as reference points or measuring units in order to improve tracking accuracy.
Audio Hardware: Some HMDs currently attach their own headphones while
others only use a corresponding signal input socket and offer the corresponding
headphones as an optional purchase option. Multi-speaker audio that gives the
illusion of a 3-dimensional world is a technology that already very much exists as
well as the availability of high resolution audio quality.
Computer Hardware: There are two types of HMDs: The first operates on a2.2. Technical characteristics of Head Mounted Displays 13
totally self-contained basis. It possesses all the necessary computer hardware
required to function as a VR headset, allowing it to collect and display the input it
receives. These standalone devices are generally mobile, battery-powered systems.
The second type of HMD does not have any computing power. This means it
must interact with an external computer. Usually these PC- or console-tethered
HMDs accept an High-Definition Multimedia Interface (HDMI) input and use
an Universal Serial Bus (USB) connector to send head tracking data through.
Although smartphone hardware is at the point where it can provide reasonable VR
experiences, they are still in notable distance behind what is possible with powerful
computers and major video games consoles. This means that, in terms of pure visual
fidelity and frame rate, dedicated external computers are still the best choice. Also,
wireless display links for computers do exist but getting these to work within the
ideal latency requirements needs some effort.
Other Hardware: HMDs are made from all sorts of materials: Cardboard, plastic,
metal and anything else that will hold the parts together. It’s important to consider
what adjustments are available on a particular HMD. The adjustment range of the
headstrap is important in this regard. If a user wears glasses the HMD should
accommodate them or allow for lens adjustments that makes them unnecessary.
Finally, the comfort padding and ergonomics of the HMD are often overlooked but
very important in my opinion because the device spends a lot of time strapped to
the user’s head.
Additional Input Devices: At present, the most common way of navigating virtual
worlds is with existing video game peripheral devices such as game pads, flight
sticks, racing wheels or keyboard and mouse. More immersive devices meant
specifically for VR are available such as specialized devices like the HTC Vive or the
Valve Index controllers which are even capable of capturing finger movements. At
the very high-end there are also full-body suspension and motion tracking systems,
like the Xsens 3D suite, hydraulic vehicle simulation rigs, and active mechanical
force feedback technology which reacts kin-aesthetically to the virtual environment,
like the rumble pad on console controllers.
With the listing of these features there are also some issues which can occur:
• Leakage
Provided images reach the wrong eye.
• Flicker
Insufficient refresh rate is given.
• Latency
A lag measured by the difference between the time there is a signal input
and the time it takes the input to display on the screen.14 Chapter 2. Stereoscopic Vision and Displays
• Resolution
Human visual acuity is maximum between 0.02◦ and 0.03◦ possible
(Ratnam et al. 2013).
• Field of view
Humans have about 180◦ .
• Restricted head movement
Wired setups, auto-stereoscopic or linear polarization displays.
• Accommodation-convergence relation
Our focus is always in near field on the screen.
• 3D fusion problems
Not everyone can easily fuse stereoscopic images.
• Depth perception/judgement
Underestimation can occur.2.3. Overview and comparison of current Head Mounted Displays 15
2.3 Overview and comparison of current Head Mounted
Displays
The range of HMD eyewear on the market has increased continuously in recent
years. In order not to lose sight of the bigger picture, I would like to present three
devices, each representing a specific product category of VR headsets:
Product category Standalone Tethered (console-based) Tethered (PC-based)
VR device Oculus Quest Sony PlayStation VR (ZVR2) HTC Vive Pro
For a comparison it is worthwhile to investigate the specifications:
Oculus Quest Sony PlayStation VR HTC Vive Pro
Display OLED OLED AMOLED
technology
Resolution (in 1440 x 1600 960 x 1080 1440 x 1600
pixels, per eye)
Pixel density (in 538 386 615
pixels per inch)
Refresh rate 72 120, 90 90
(in Hz)
Field of view 100 100 110
(in ◦ )
Headphone In-Ear In-Ear On-Ear
type
Headphone 3.5 mm audio jack 3.5 mm audio jack USB-C 3.0
socket
Sensors Accelerometer, Accelerometer, SteamVR tracking,
gyroscope, internal gyroscope G-sensor, gyroscope,
cameras proximity,
interpupillary distance
sensor
Tracking wireless Inside-Out Outside-In marker-based Inside-
technology Out
Additional - PlayStation 4 PC with advanced VR
requirements readyTM specs
Operating Oculus Mobile PlayStation 4 SteamVR
platform
Release date 2019-05-21 2016-10-01 2018-04-05
Table 2.1 Specification overview of current HMDs
Considering the technical features listed above, I will discuss now which device is
most suitable for my research purpose.16 Chapter 2. Stereoscopic Vision and Displays 2.3.1 Product choice and explanation First of all, it should be noted that the current HMDs have not yet fully reached the mass market. This is partly due to the high product prices but also to the lack of mass-suited application scenarios and stress symptoms after staying too long in virtual worlds. Thus, I would like to give my test audience an experience as close to reality as possible but only let them wear the glasses for so long that my research series still becomes meaningful and verifiable. The testers should therefore not only experience the highest possible wearing comfort but also the maximum visual clarity during the test series. The headset by HTC with their Vive Pro with built-in AMOLED screen technology meets this visual demand better than the competitor from Oculus and Sony. Respectively, AMOLEDs are even brighter and more luminous than OLEDs and therefore better suited to maintain a realistic claim. If I take a look at the per eye resolution of the glasses, I notice that both the Quest and the Vive Pro have the same amount with a total pixel number of 1440 in width and 1600 in height. The VR headset by Sony clearly falls behind at this point with 960 × 1080 pixels per eye. Here as well, it is important to offer the user a high level of realism. Accordingly, it is worth taking a look at the pixel density of the devices: The Vive Pro with 615 ppi comes out as the clear winner ahead of the Quest with 538 ppi and the PlayStation VR with 386 ppi. Looking at the refresh rate, it’s clear to see that both Sony and HTC guarantee 90 Hz on their devices. Oculus takes a different approach with only 72 Hz. I consider this a risky step because the framerate can also be a reason for enhanced motion sickness symptoms. Sony promises besides regular 90 Hz a frequency of 120 Hz with its headset. Since this is usually not native 120 Hz, - it depends on the imaging application - 60 Hz is operated in the application and 120 Hz can be displayed on the glasses by interpolation and reprojection. The additional 60 frames are generated by taking the HMD tracking data and adjust or warp the last rendered image to fit the movement done since then. So, in order to offer the best possible immersion I will stick to Sony and HTC when it comes to refresh rate. In terms of audio, the manufacturers are somewhat covered with information. This may be due to the fact that the obvious really visible improvements can be seen in the spatial and temporal resolution of the glasses and therefore be advertised better. On the other hand sound for most potential buyers is a minor argument to purchase. Furthermore, the manufacturers are very similar in their specifications which probably does not produce a USP (unique selling point). In particular, they all use the advertising term HiRes (High Resolution) what stands for a higher sound quality in audio technology. These are digital music formats that have a sampling rate of at least 96 kHz or a sampling depth of at least 24 bits. However, from a scientific point of view an audible improvement in sound quality cannot be proven by a higher sampling rate [(Lüke 1999), (Meyer and Moran 2007)]. The audibility of a sampling depth greater than 16 bits is only given for music with quiet
2.3. Overview and comparison of current Head Mounted Displays                           17

passages that is reproduced at a very high volume. But what all manufacturers
without exception provide is a connection for headphone components.
In particular, the Quest and PlayStation VR have
a standard 3.5 mm audio jack. The Quest doesn’t
come with headphones but the PlayStation VR
in the 2018 version (CUH-ZVR2) already does.
Oculus recommends their costumers to buy their
in-ear headphones, Sony already includes them at
purchase. The Vive Pro takes a different approach:
It comes with fixed on-ear headphones connected to      Fig. 2.18   Suovanen, J. (Creative
a USB-C 3.0 socket which can also be detached and Electron, 2018): Radiography of
replaced.                                                  the HTC Vive Pro headphone

A look at the tracking methods of the device
manufacturers reveals that they all use a different technology. While Oculus and
HTC choose the way of Inside-Out tracking for their products, Sony’s headset offers
the Outside-In method. Thus, the PSVR uses an external camera connected to the
PlayStation 4 via cable to scan the room for the headset and accordingly send the
position data to the console. Sony has also recognized that this tracking method
is dying out more and more and is already working on an Inside-Out method, as
a recent patent application shows (Sony/USPTO[online] 2019). Although both the
Quest and the Vive Pro use the Inside-Out technology for tracking, they differ in one
characteristic: While the Quest uses a markerless variant, the Vive uses markings
on the glasses themselves which are continuously scanned by the Lighthouses via
infrared. So, while markerless Inside-Out tracking "intelligently" detects the glasses’
position in space with integrated sensors, marker-based Inside-Out tracking does
therefore not need a bright environment but tracking markings on the glasses and
Lighthouse sensors to detect positional change. In order to achieve the most accurate
head tracking possible, I believe that the marker-based tracking variant of HTC
works more accurately here.

For the quest, since it’s a standalone headset, no further equipment is necessary for
a proper use. Whereas the PSVR requires a compatible console such as a PlayStation
4 or newer and the HTC Vive requires a very powerful computer or laptop with
special VR readyTM certification. However, if I take a look at the operating system,
it becomes clear that for a custom-built application to run on the Quest or PSVR, a
special build would have to be made for each platform. This is much easier with
SteamVR because an application which is already running in the game engine (I use
the Unity Editor) can be exported as an executable file (*.exe Build) and can be easily
accessed via the already installed SteamVR headset configuration. In return, I save a
lot of time and nerves not having to generate a special build for different appropriate
18                                    Chapter 2. Stereoscopic Vision and Displays

platforms.

The bottom line is that the performance and accessibility advantages of the Vive
Pro dominate those of the competing products. I would have liked to see a build
of my application on the Oculus Quest or another comparable standalone device.
Nevertheless, due to the limited time and the already existing knowledge regarding
VR build workflow in Unity, I put myself in safety with the HTC Vive Pro and its
benefits.
19

Chapter 3

Audio and Spatial Sound

3.1   History and recent Development
Hardly any other specialist area has such a great
effect on our everyday life but nevertheless such
a low active awareness.      For most, sound, both
analog and digital, is simply present and completely
normal.   The first sound recording known to us
dates back to 1857 and began with the idea of
making sound waves visible. Édouard-Léon Scott
de Martinville set himself this goal and developed
the first "phonautograph". To make sound visible
                                                        Fig. 3.1   Scott de Martinville, É.-
the phonautograph used a horn connected to a L. (1911): The Century Dictionary,
membrane that made an image on a hand-wound Vol. VI, Page 4450, Pholadidae to
cylinder with a pig’s bristle. However, the device                   Phonikon

was still unable to play anything. Not until 1877
Thomas Alva Edison, who became better known for his patent for the first light bulb,
succeeded in building a device that could also reproduce sound recordings. The
sound was recorded via a membrane with a blunt needle onto a wax roller in deep
writing, thus with vertical needle deflection and played back again via a funnel.
He received the patent for his "speaking machine" a year later. Only 10 years after
this remarkable achievement, two German researchers, Emil Berliner and Werner
Suess, recognized some weak points and optimized the device. From now on more
easily stackable sound pads made of hard rubber, later of shellac and from 1930 of
PVC, were used which was much more cost effective and durable. In addition, there
were some changes to the sound box which served to bundle the tones produced
in order to make an even better sound possible. With the birth of the gramophone
1987 it became possible to use such devices commercially. Through improvements
such as stereophony or quadrophony, records could be found in every household,
even today the record still has many lovers. A further development was taken in
1921 with the invention of the optical-sound-processing which enforced against the
magnetic sound-recording system because of the lower technical complexity and
better durability in continuous operation. For the first time it was possible to record
20 Chapter 3. Audio and Spatial Sound
sound and images simultaneously. The audio track is recorded parallel to the image
and later scanned with a photodiode. However, this happens with a delay in time,
since images are always passed by the lamp step by step and the sound must be
sampled continuously. Today, in addition to analog audio tracks, digital audio tracks
are also written on the film. This method was used until digital film projection was
established and is still standard in cinemas with film projectors today.
The magnetic sound and image recording was presented in the current sense around
1935 by the AEG-Telefunken AG Berlin. The medium used in their magnetophone
is a plastic tape coated with a magnetic emulsion. Due to the poor sound quality,
the device was only intended as a voice recorder. However, from the beginning
there was a great interest by radio stations which until then still recorded with wax
rollers. The frequency range at that time was already 50 to 10.000 Hz and had a
dynamic range of about 35 dB. By pre-magnetization this process offered from 1940
a completely new sound quality and was standard because of improvements such as
Dolby A or the 48 multi-channel technology in every recording studio for a very long
time until they were replaced by digital hard disk recording. From 1976 onwards
magnetophones were replaced by cassettes in the consumer sector although they
functioned according to the same principle.
The first attempts to digitalize audio signals were already there 1970 before the
Compact Disk (CD) was introduced in 1983. Hereby, the audio signal is sampled and
stored digitally via PCM (pulse code modulation). PCM is a coded data stream that
is generated when analog audio information is converted into digital signals. The
sampling rate determines how often the analog signal is picked up and converted
into a digital value in one second. The quantization (also called resolution or word
width) indicates how many different digital values a signal can be converted into
and therefore it’s possible to let different amount of sound data information to be
displayed. Examples of common sample rates are:
Medium sample rate (in Hz)
CD 44.100
DVD 48.000
Blu-Ray and High Definition Recording 96.000
High Resolution Rate 192.000
Table 3.1 Examples of common sample rates3.1. History and recent Development 21
Examples of common bit depths are:
Bit depth dynamic range (in dB)
16 ca. 96
24 ca. 144
32 ca. 192
Table 3.2 Examples of common bit depths
More dynamic range means a better signal-to-noise ratio (SNR), better precision
when mixing and less worrying about headroom. Professional Digital Audio
Workstations (DAW) are using an internal bit depth of 32 or 64 bits nowadays by
default.
The Australians Peter Vogel and Kim Ryrie
were pioneers in this field with their Fairlight
audio workstation: The CMI (Computer Musical
Instrument), the first digital synthesizer with
sampling technology and the MFX 3, the world’s
first fully digital 24-track disc recorder. The greatest
advantage of the digital workflow is the non-linear
way of operating recordings and audio data and
also the consistency in quality when multiplying
and playing back. The last big improvement is Fig. 3.2 Bizzle, J. (2011):
the DAW, so to say an integrated recording studio. Fairlight CMI II, National
Association of Music Merchants
The digital audio recording made it possible to cut
(NAMM) in Anaheim,
audio tracks directly in the computer. By continuous California (U.S.)
improvement of the computers it was also possible
to emulate more and more studio devices (e.g. via MIDI, short for Musical
Instrument Digital Interface, devices), so that today apart from a powerful computer
and an interface no other devices are necessary anymore to make good recordings.
To convert analog signals to digital data values some basic principles need to be
explained: The sampling or Nyquist-Shannon theorem says that a signal can be
completely reconstructed from its samples taken at a sampling frequency F if it
contains no frequencies higher than F2 , referred to as the Nyquist frequency:
F
f max < f Nyquist = ; i.e. F > 2 f max
2
This equation is referred to as the Nyquist condition for perfect signal reconstruction.
The SQNR (signal-to-quantization-noise ratio) reflects the relationship between
the maximum nominal signal strength and the quantization error (also known as22 Chapter 3. Audio and Spatial Sound
quantization noise) introduced in the analog-to-digital conversion.
3 × 22n m m ( t )2
SNR =
1 + 4Pe × (22n − 1) m p (t)2
The SQNR formula is derived from the general SNR formula for the binary PCM
communication channel where
Pe is the probability of received bit error,
m p (t) is the peak message signal level and
mm (t) is the mean message signal level.
As SQNR, like SNR, is a ratio of signal power to some noise power and can be
calculated as:
Psignal E[ x2 ]
SQNR = =
Pnoise E[ x̃2 ]
The following table uses the signal-to-quantization-noise ratio formula, the Nyquist
frequency and bitrate formulas to determine various properties of uncompressed
PCM digital audio:
Format sample rate bit depth channels max. dynamic unique folding frequency
(in Hz) (in dB) range (in dB) values (in Hz)
CD-DA 44.100 16 2 96.329 65536 22.05 (total bit rate
1411.2 kbps)
DVD-A 192.000 24 2 144.494 16777216 96 (total bit rate
stereo 9216 kbps)
DVD-A 96.000 24 6 144.494 16777216 48 (total bit rate
surround 13824 kbps)
DTS-HD 192.000 24 8 144.494 16777216 96 (total bit rate
Master 36864 kbps)
Audio
Table 3.3 Various properties of uncompressed PCM digital audio3.2. Sound Waves 23
3.2 Sound Waves
In physics, sound is a vibration that typically propagates as an audible wave
of pressure through a transmission medium such as a gas, liquid or solid. In
human physiology and psychology, sound is the reception of such waves and their
perception by the brain.
Sound waves are often simplified to a description in terms of sinusoidal plane waves
which are characterized by these generic properties:
Period T
Frequency f
Wavelength λ
Amplitude A
Phase Φ
Fig. 3.3 Nave, C.R. (2016): HyperPhysics: Traveling Wave
Relationship
A single frequency traveling wave will take the form of a sine wave. A snapshot of
the wave in space at an instant of time can be used to show the relationship of the
wave properties frequency, wavelength and propagation velocity. Sound is a wave
of pressure and the basic wave is a sinusoid which means each sound signal can be
constructed out of (or decomposed into) multiple sinusoids. The motion relationship
x = v × t is the key to the basic wave relationship. With the wavelength as distance,
1
this relationship becomes λ = v × T. Then using f = T gives the standard wave
relationship
v = f × λ.
This is a general wave relationship which applies to sound and light waves, other
electromagnetic waves and waves in mechanical media.24 Chapter 3. Audio and Spatial Sound
3.3 Human Audio Perception
The sound pressure waves enter the ear
canal and make the ear drum vibrate.
This action moves the tiny chain of
bones (ossicles – malleus, incus, stapes)
in the middle ear. The last bone in
this chain "knocks" on the membrane
window of the cochlea and makes the
fluid in the cochlea move. The fluid
movement then triggers a response in
the hearing nerve. This is passed on to Fig. 3.4Osborne Head and Neck Institute
(2016): Ear, Nose and Throat Doctors Los
the brain. The main sound perception Angeles
sensations are:
• Frequency f (pitch): Humans can hear sound waves with frequencies
between about 20 Hz and 20.000 Hz and can differentiate between approx.
3000 different tone levels.
• Amplitude A (volume): The sound pressure level or volume perception
is presented by a logarithmic scale according to the Weber-Fechnersches
law [(Weber 1834) (Fechner 1860)]. This basic psychophysical law states
that there is a precise numerical relationship between the intensity of a
physically measurable sensory stimulus and the strength of the sensation
triggered by that stimulus. They found that the physical and the
experienced stimulus strength are not in a linear relation to each other
but that the intensity of the sensation (I) is proportional to the logarithm
of the strength of the triggering stimulus (S):
S
I = c × log
S0
where c = constant of proportionality.
Humans auditory threshold is at 2 × 10⁻⁵ Pa = 0 dB at 1000 Hz while the
pain threshold is at 120 dB =
b 20 Pa. Within the limits of the audible range,
the sensitivity of the ear depends on frequencies. Normal equal-loudness-
level contours (Fletcher and Munson 1933) show that this dependence
is particularly pronounced at low frequencies and low sound pressure
levels between 2 and 5 kHz (Standardization/TC 43 Acoustics[online]
2003).
• Phase Φ: The increase and decrease in pressure cycle of any single
vibration.3.3. Human Audio Perception 25
• Timbre (tone color): The perceived quality of any sounds’ multiple
frequencies changing through time.
• Localization (3D/spatial sound): Humans can localize sound, directly in
front of them most accurately while to the sides and behind their heads
least accurately.
Spatial Sound Perception:
An explanation for binaural hearing, or hearing with two ears, is the duplex theory
of Lord Rayleigh from 1907 (Plack 2005). The duplex theory is based on the
relationship between the physical properties of a sound reaching the ears and the
geometry of the head. Humans have two ears, each positioned at a different location.
This causes interaural differences in
• time: Interaural time difference (ITD), in
• intensity: Interaural intensity difference (IID) and in
• spectral differences: Spectral change of the signal dependent on the angle
of incidence due to shape of auricle and external auditory canal. But these
differences are not perceived consciously by human.
3.3.1 Interaural Time Difference
The speed of sound in dry air is given approximately by
m
vsound in air ≈ 331.4 + 0.6 × TC
s
for temperatures reasonably close to room temperature where TC is the celsius
temperature. It would take approximately 0.6 ms for sound to travel the width
of an average head [(Feddersen et al. 1957), (Green 1976)]. ITD occurs because
sound from a sound source closer to one ear than to the other reaches the facing
ear earlier than the averted ear. The position of the head plays an important role
in recognizing the transit time differences. In our environment several sounds are
perceived simultaneously by our ear. A "cone of confusion" (Goldstein 1996) occurs
when several sounds with the same time differences arrive at the ear. In this case,
humans cannot locate the individual sound sources. In order to locate the sound
source correctly the head has to be moved.
3.3.2 Interaural Intensity Difference
If the wavelengths of the sound are smaller in comparison to the head, they are
reflected by it and a sound shadow is formed. This shadowing on the opposite side26 Chapter 3. Audio and Spatial Sound
of the head results in different sound intensities on the left and right ear. These
are called interaural level differences. This happens because the head is an obstacle
to sound propagation. The averted ear lies therefore in an acoustic shadow and
reaches rather lower frequencies and a less intense sound. This only applies to high
frequencies because they are slowed down, less intense and do not travel around
the head as much as low frequencies do. That’s why low frequencies (e.g. base
drums) from a concert at a certain distance are still recognizable compared to high
frequencies.
Fig. 3.5 Cohen, M. (2016): Schematic Summary of Binaural Effects:
ITD and IID, Applications of Audio Augmented Reality: Wearware,
Everyware, Anyware, and Awareware
3.3.3 Blauert Bands
Jens Blauert found out that in the natural hearing of sound sources in the
median plane, only certain frequency bands raised in level are decisive
for the spatial directional localization in front, above and behind because
there are no evaluable level and time differences at the ears (Blauert 1974).You can also read