Water Quality Monitoring in Singapore - Your First Guide to Kwok Chen Ko
←
→
Page content transcription
If your browser does not render page correctly, please read the page content below
Your First Guide to
Water Quality Monitoring
      in Singapore
           Kwok Chen Ko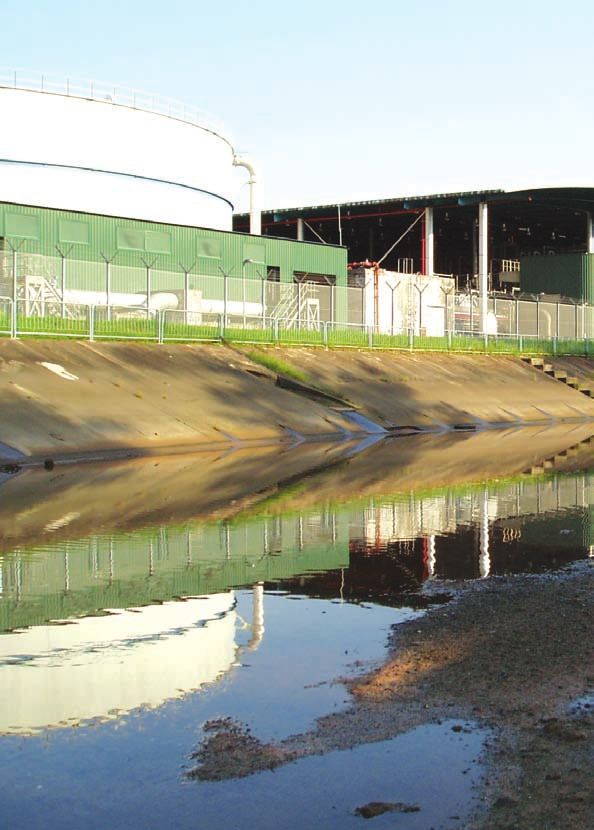
Your First Guide to
WATER QUALITY MONITORING
IN SINGAPORE

By Kwok Chen Ko

All rights reserved. No part of this book
may be reproduced or transmitted in any
form, by any means (electronic, photo-
copying, recording or otherwise) with-
out the prior written permission of the
author, except for the inclusion of brief
quotations in a review.

Copyright © Kwok Chen Ko 2011

ISBN: 978-981-08-7715-6
Foreword

Your first guide to water quality monitoring in singapore
Water plays an essential role in our everyday lives and it is a critical part of the eco
system. Yet we often take this precious resource for granted. In order to ensure that
we have a sustainable water resource not just for us, but for our future genera-
tions, it is all the more important to ensure that this precious resource is conserved
and used wisely. As a socially responsible retailer, FairPrice recognises this and has
a dedicated team that actively looks into environmental conservation within the
cooperative.

You may be familiar with some of our green intiatives such as the Bring-Your-Own-
Bag (BYOB) as well as our pilot eco-friendly supermarket at City Square Mall which
showcases the latest eco-friendly solutions in grocery retailing. This includes the use
of recycled and biodegradable materials for store fixtures, energy-saving equipment
and lighting, as well as “green technology” like the reverse vending machine.

We, however, realised that to bring this cause to the next level, raising awareness
among the community is of utmost importance as well. As such, we look into ways
we can partner the community to support education on various environmental top-
ics including water conservation. In 2010, we adopted the Sengkang Floating Wet-
land as part of our efforts to conserve the environment and announced the setting
up of the FairPrice Water Education Fund of $30,000, in partnership with PUB,
Singapore’s National Water Agency. This Fund will be utilised for water education
over a period of two years.
The Fund will serve to help schools enhance their water education programmes
for students as well as enable teachers to attend relevant training on water-quality
monitoring and acquire resource teaching materials. This guidebook, “Your First
Guide to Water Quality Monitoring in Singapore”, is part of this holistic initiative.

With this guidebook, we hope to raise awareness and educate the community on
water quality monitoring in Singapore. Readers like you will gain insights on water
quality monitoring in the natural water catchment areas in Singapore, ranging from
canals, rivers to reservoirs. The guide provides a deeper understanding of the efforts
and processes in place to ensure safe and clean waters for everyone. In reading this
book, I am confident that you will also be inspired by the author, Kwok Chen Ko’s
passion and enthusiasm, to spread the word on the importance of protecting this
important resource and keeping our waters clean.

At FairPrice, we strive not only to be a world-class retailer, but a retailer with a heart.
We aim to be the most responsible corporate citizen, caring for our customers, the
community and the environment. We believe that together with the community,
we can build a far better community for all. So let us work together to ensure there
is safe and clean water for everyone in the years to come.

We hope that this book will inspire many to take action to protect our environ-
ment.

							   Mr Seah Kian Peng
							   CEO (Singapore)
							   NTUC FairPrice
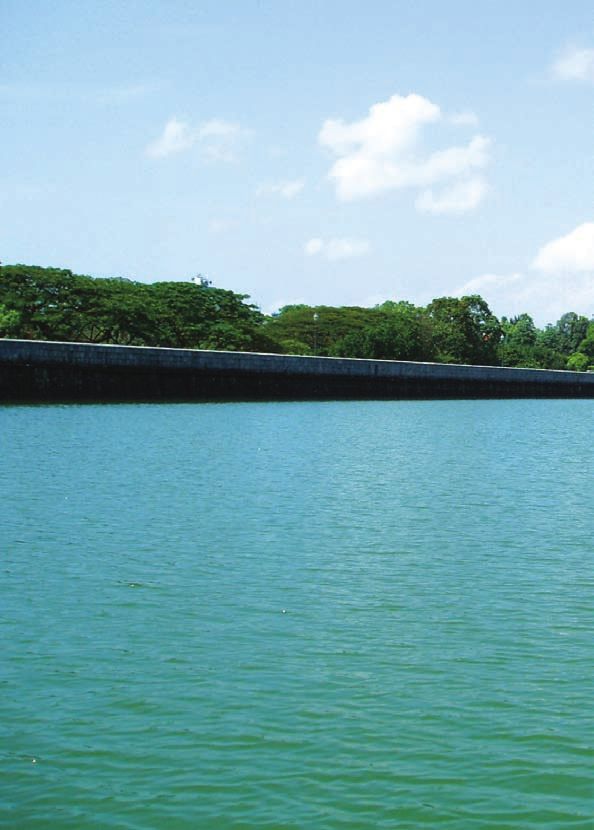
Table of Contents

1.   Introduction                                                 5

     1.1    Why am I writing this book?                           6
     1.2    Why do water quality monitoring (WQM)?                7
		          1.2.1    An educator’s perspective                    7
		          1.2.2    A conservationist’s perspective              9
		          1.2.3    A perspective on national security           9
		          1.2.4    Money talks                                 10
     1.3    Who should read this book?                           10
     1.4    How to use this book?                                11

2.   Types of freshwater systems in Singapore                    12

     2.1    Open-country                                         14
     2.2    Forest                                               17
     2.3    Intermediate                                         19

3.   Water quality                                               20

     3.1    Introduction                                         22
     3.2    The watershed concept                                22
     3.3    PUB’s Active, Beautiful, Clean Waters (ABC Waters)   24
		          Design Guidelines
     3.4    Water quality parameters                             25
		          3.4.1    Dissolved oxygen (DO)                       26
		          3.4.2    Temperature                                 30
		          3.4.3    Electrical conductivity                     31
3.4.4   Turbidity                                     33
		         3.4.5   pH                                            36
		         3.4.6   Alkalinity                                    40
		         3.4.7   Hardness                                      42
		         3.4.8   Nitrogen                                      44
		         3.4.9   Phosphorus                                    47
     3.5   Filling in the data form and taking measurements      48
		         3.5.1   Stream and sampling station                   51
		         3.5.2   Topo(graphical) map quadrant                  51
		         3.5.3   Latitude and longitude                        51
		         3.5.4   Tidal range                                   53
		         3.5.5   Weather conditions                            53
		         3.5.6   Water quality parameters                      53

4.   Designing a WQM programme                                   68

     4.1   Objectives of WQM                                     70
     4.2   Choosing a monitoring site                            71
		         4.2.1   Nature reserves and parks                     71
		         4.2.2   Reservoirs, rivers and canals                 72
		         4.2.3   Singapore Armed Forces (SAF) training areas   72
		         4.2.4   Other authorities                             73
		         4.2.5   Choosing a monitoring station                 74
     4.3   Frequency of monitoring                               75
     4.4   Water sampling                                        76
		         4.4.1   Types of samples                              76
		         4.4.2   Sampling guidelines                           79
4.4.3   Sampling at depth and in large water bodies      82
		         4.4.4   K.I.S.S.                                         83
     4.5   Precautions and Potential problems not covered earlier   84
		         4.5.1   Help, my forest has disappeared!                 84
		         4.5.2   Help, the water level is reaching my chest!      86
		         4.5.3   Help, there is no water!                         87
		         4.5.4   Help, I am stuck!                                87
		         4.5.5   Know your site!                                  88
     4.6   Gear checklist                                           89
     4.7   Where to go from here?                                   90

5.   Some last thoughts                                             92

6.   Acknowledgements                                               94

7.   References                                                     95

8.   About the author                                               96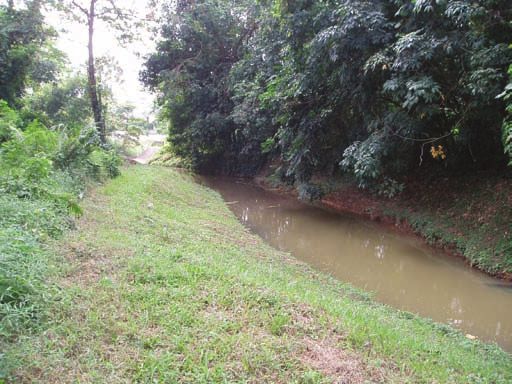
1. Introduction
1.1	Why am I writing this book?
1.2	Why do Water Quality Monitoring (WQM)?
1.3	Who should read this book?
1.4	How to use this book?

                              5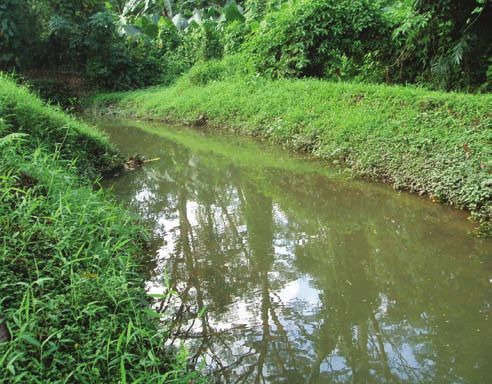
1. Introduction
1.1	Why am I writing this book?

I first started my first water quality monitoring (WQM) with trepidation in 2006.
There was simply no guide for reference on such a topic in Singapore.

Regardless, I gathered whatever information I could from the Internet, books and
journals and dived right into it. Naturally, I had my share of mistakes and oversights.
For example, recording the weather conditions on the day of sampling and up to 24
hours before sampling can be significant in explaining the water quality data. This
was regrettably missed out in my early days.

Besides supervising my polytechnic students in their WQM projects, I began to de-
velop and conduct WQM courses for teachers and students from primary to junior
college level. These experiences in research and teaching were invaluable in honing
my WQM capabilities.

Nonetheless, after almost five years of WQM and teaching, I think of myself more
as a qualified beginner rather than an expert. (Incidentally, this is what a black belt
means in the martial arts – a qualified beginner.) Still, I felt ready to impart my
knowledge and experiences to a wider audience by writing this book. The contents
here do not merely spout theory like a slow lecture on a lazy afternoon. Wherever
possible, I flesh out the theoretical portions with my real life experiences, whether
in the classroom, laboratory or field. I believe that giving this book a local and per-
sonal flavour will be essential to planning for a successful WQM activity by you, the
reader.

I hope that you will treat this book as a light hearted and handy reference (some-
thing like a “WQM for dummies”) rather than a boring academic manual. By all
means, bring it along for your field trip, hopefully getting it wet and dirty. WQM is
not meant to be an armchair exercise.

                                          6
1.2 Why do water quality monitoring (wqm)?
1.2.1 An educator’s perspective
Too often, I have heard from teachers about a lack of ideas for conducting out-of-
classroom lessons. They seem to want something more than just classroom and
laboratory in their lesson delivery. They want fieldwork, they want their students to
go down to the ground and get all wet and muddy. They want an experience (sci-
entific or otherwise) that cannot be captured within the confines of a classroom!
Figure 1: A common scene in WQM. Here, students from 2 secondary schools were on a field trip to
“Ngee Ann Stream”. As Ngee Ann Stream is often used for my WQM activities, I have taken the liberty
of naming it as such because it is located opposite Ngee Ann Polytechnic, running perpendicular to
Clementi Road. [Chiang Ah Choo]
7WQM is the ideal vehicle to do just that. If one uses a basic setup, it does not require
a huge monetary investment. It is perfect for a multidisciplinary approach as it can
incorporate many subjects from our secondary school curriculum – chemistry, biol-
ogy, physics, mathematics, geography, history and many others besides – ecology,
culture, sociology, ethnography etc. Very rarely do you find all these subjects so
vividly interconnected to one another in a single activity i.e. WQM.
In an approach adopted by an international school in Malaysia, students visited the
Malaysian wilderness to experience life outside the classroom. In one such visit to
Tasek Bera, a peat swamp, the students set out to answer basic questions about
the ecology of the swamp and “demystify the process of scientific enquiry”. One
group was interested in studying the stream flow in which mathematics and phys-
ics were involved. Another group wanted to investigate the chemistry and biology
of water quality. Yet another group intended to research on the geographical and
cultural aspects of the Orang Asli populations living next to the swamp. At the end
of 3 days, each group presented their findings, offering insights and knowledge of
a place rarely studied.
Perhaps most important of all, WQM teaches its participants about environmental
education, a topic sadly lacking in today’s “standard” school curriculum. To solve
today’s environmental problems like climate change and pollution, we need our
youth to be well informed and passionate about the environment. Reading about
them is a good start but we need our students to immerse themselves in the en-
vironment to experience firsthand how environmental degradation is taking place.
For example, how can one appreciate the significance of water pollution if one does
not experience the ecological differences between a healthy stream and a polluted,
dying one. Only then will the youth of today be ready to become staunch stewards
of the environment for tomorrow.
81.2.2 A conservationist’s perspective
Water quality may seem unrelated to nature, plants, birds, fishes, butterflies and
wildlife. Nothing can be further from the truth as the health of the environment
— water, air and soil quality, is intimately linked to the flora and fauna. The living
world constantly interacts with water, air and soil through numerous processes,
whether chemical, physical or biological.
Sampling of the plant and animal populations can indeed provide useful informa-
tion about the health of a natural area. However, if data on the environmental qual-
ity is also available, it can be compared with the plant and animal data to generate
a comprehensive understanding of the natural environment. This is especially true
if human activities have exerted a significant impact since environmental quality
will be the first to show signs of that impact, for example presence of pesticides or
heavy metals.
Why water quality? Water is vital to all life forms. Aquatic life forms are continu-
ally exposed to water while terrestrial life forms require water for sustenance. Any
change in water quality will surely affect life in the surrounding area. Moreover, wa-
ter can flow over a wide area and hence distribute its effects extensively, whether
for good or worse.
1.2.3 A perspective on national security
Water has always been an issue of national security in Singapore. Water does not
only come from rain falling into our reservoirs directly. It also comes from the water-
shed (also known as drainage basin or catchment area) serving the reservoir.
In Singapore’s case, the watershed can extend to quite a large area serviced by a
network of canals running into the reservoir. Dirty watershed or canals will mean
dirty reservoirs. As once remarked in a WQM document, “everyone lives down-
stream”. It is quite apt as anything bad upstream will impact us downstream one
way or another.
Today’s technology can clean up almost any raw water sufficiently to make it po-
table. But if the raw water is already contaminated, treatment cost will increase,
ultimately jacking up the price of water utilities for the consumer.
91.2.4 Money talks
Sooner or later, the topic of money is bound to pop up so I might as well address
it now.
WQM cannot be done without a budget. You will need to invest in capital costs
such as portable testing meters and colour comparators. Running costs will come in
the form of consumables such as chemical reagents, replacement sensors, gloves,
paper towels etc.
However, the testing methods given in this book are designed for the budget con-
scious. No individual piece of equipment should go past the $2k mark. You will not
need high-tech equipment with fancy names such as gas chromatography, induc-
tively coupled plasma or atomic absorption spectrometer.
What you do need are an inquisitive mind, a keen sense of observation and a little
budget, certainly within the financial ability of a school or a company.
1.3 who should read this book?
I designed this book for the novice and layperson to WQM. Though targeted at
educational institutions from secondary to junior college level, the contents can be
grasped by anyone from NGOs and corporations to government agencies.
In fact, I believe that anyone having a genuine interest in environmental conserva-
tion should give WQM a try. It can be lots of fun to get your hands working instead
of sauntering aimlessly in Singapore’s natural and rural areas. WQM can be won-
derfully empowering for the individual when you realise that you can actually do
something for the environment.
On the corporate front, corporate social responsibility (CSR) is becoming a hot buzz-
word nowadays. WQM can be seen as a useful tool in walking the talk of CSR.
On a more sobering note, WQM is not meant to be a one-off activity. You will need
bucket-loads of passion for nature and the environment to commit long term. Only
then will the basic aims of WQM be achieved – establishing a baseline and detect-
ing changing trends or sudden spikes in our water quality, if any.
10This book is intended to provide the fundamentals for implementing a simple yet
adequate WQM programme. If you, the reader, find that certain topics should be
left out or included in this book, please let me know via my email given at the end
of this book. Any other feedback will also be warmly welcomed.
1.4 How to use this book?
The contents in this book are arranged to give you a good grounding in the funda-
mentals of water quality before proceeding to the nitty-gritty details of planning a
WQM programme, seeking permission from the relevant authorities and using the
relevant gear.
Feel free to flip right to the juicy parts on planning for a WQM adventure, especially
if you have all your WQM equipment up and ready but do not know what to do
with them. Sure, jump straight in to the exciting world of fieldwork. However, do
return to the front part of the book and read up on the science behind water quality
to make sense of your data collected from your WQM activities.
However you want to read this book, ENJOY!
About this book
This book is not intended to turn you into a water quality expert. Instead, it aims
to raise your awareness on water quality and its importance to us. I sincerely hope
that you can spread the water quality message to ten people around you (pyramid
scheme-style) so as to raise their awareness about this vital environmental issue.
Through this book, I offer you tips and ideas so that you can go ahead to do your
own WQM without complicated and expensive equipment. I have included a list of
references at the end if you wish to dive deeper into the world of WQM.
112. Types of freshwater
systems in singapore
2.1 Open-country
2.2 Forest
2.3 Intermediate
1213
2. Types of Freshwater
Systems in Singapore
2.1 open-country
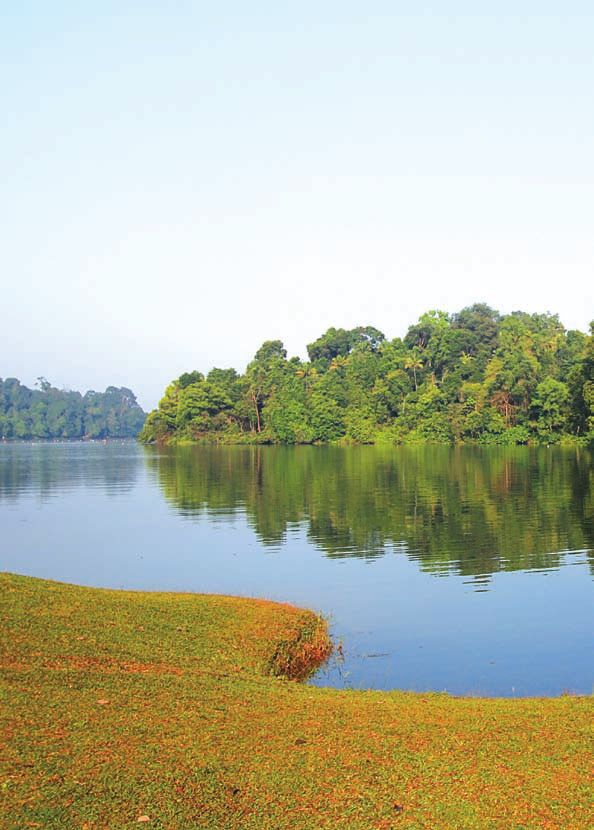
Open-country water bodies are as the name implies – they are open to the sky. The
waters may be relatively stationary such as ponds, lakes and reservoirs, or they may
be flowing such as streams, rivers and canals.
Open-country water bodies may also be catergorised into urban (e.g. concrete
drains and canals) and rural (presence of vegetated banks and natural substrate).
Figure 2: Open-country rural stream – Ngee Ann Stream.
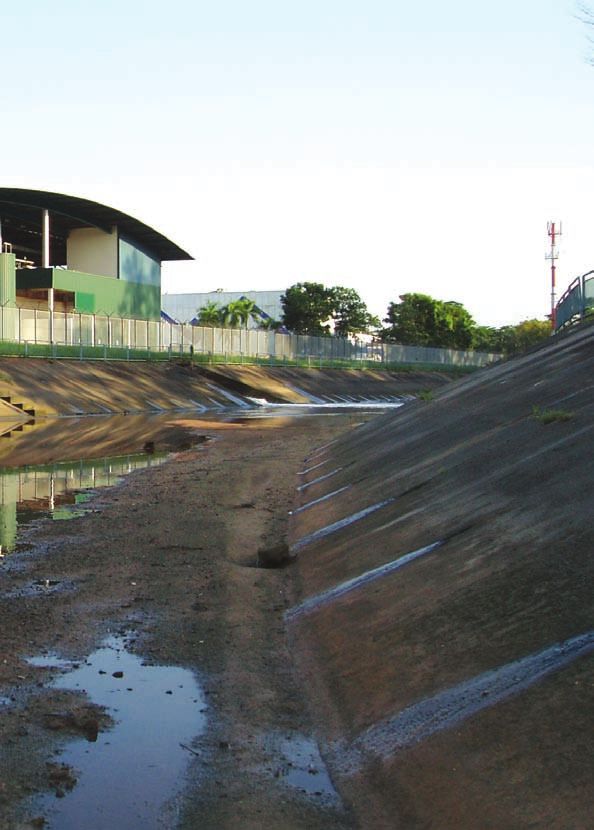
14Figure 3: Open-country urban stream (aka canal) at Sungei Mandai Besar.
Open-country water bodies are generally turbid, moderately hard, near neutral in
pH and eutrophic (high levels of organic matter and nutrients). The exceptions are
freshwater reservoirs which tend to be cleaner as compared to others. All of the
open-country water bodies normally experience greater fluctuations in temperature
due to a lack of overhanging vegetation cover. This in turn leads to fluctuations in
other water quality parameters, hence making it harder for aquatic life to adapt.
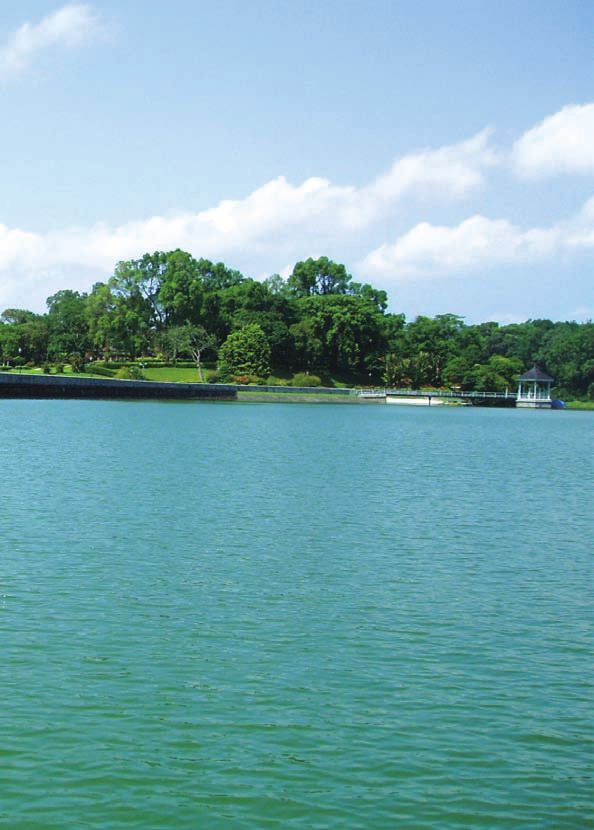
15Figure 4: Open-country, stationary water body - MacRitchie Reservoir.
The water is generally cleaner.
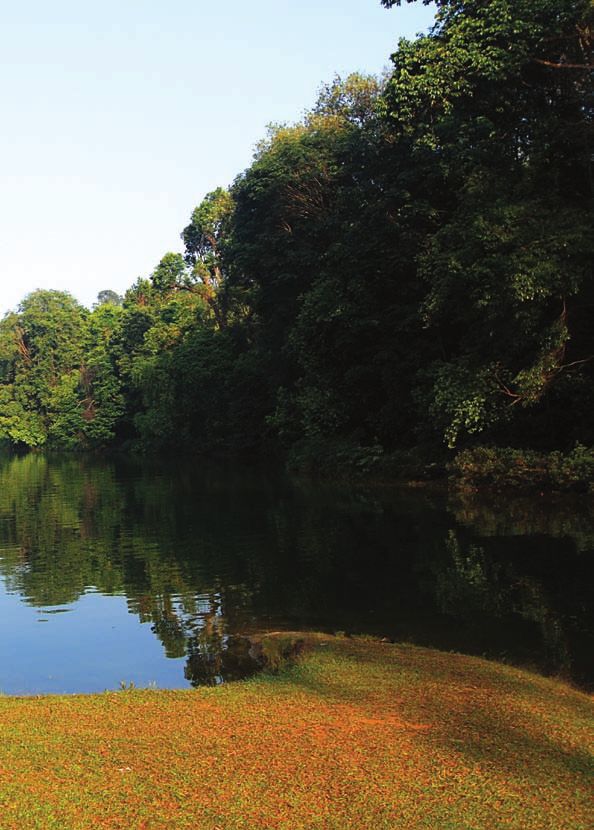
162.2 Forest
Forest fresh waters are usually well shaded by overhead vegetation. They may be
categorized into secondary forest streams, the rarer primary forest streams and
freshwater swamps.
Whether a stream is classified into a primary or secondary forest stream, depends
on the forest type it is located in. Check out a good vegetation map of Singapore
for the delineation of primary and secondary forests. Alternatively, if you are good
with plants, their identities will reveal whether you are in a primary or secondary
forest. A useful guideline to remember is the only primary forest patch in Singapore
is located within Bukit Timah Nature Reserve (BTNR) around the Jungle Fall Valley.
Some literature works have classified Nee Soon Freshwater Swamp as primary for-
est but in terms of water quality, it is categorised differently.
Figure 5: Primary forest stream crossing Jungle Fall Path at BTNR.
17Figure 6: Secondary forest stream in Bukit Timah area.
Figure 7: Nee Soon freshwater swamp. Get an experienced guide to show you the
way as you won’t find friendly signboards or maps pointing to this gem of nature.
18Unlike the flowing waters in primary or secondary forest streams, the waters in a
freshwater swamp tend to be quiescent. The only freshwater swamp in Singapore
is located at Nee Soon.
Forest fresh waters are relatively clear, very soft, acidic (pH 4-6) and oligotrophic
(low levels of organic matter and nutrients).
2.3 Intermediate
A fresh water body can have the characteristics of both an open-country and for-
est fresh water. This can be a result of both types of fresh water merging along the
same water body. Such a water body is known as an intermediate habitat.
193. Water quality
3.1 Introduction
3.2 The watershed concept
3.3 pub’s active, beautiful, clean Waters (abc waters)
design guidelines
203.4 Water quality Parameters
3.5 filling in the data form and taking measurements
213. Water Quality
3.1 introduction
What is water quality? In environmental science, water quality is determined by
several parameters — physical, chemical and biological. Each parameter describes
or indicates the components of water, such as bacteria, algae, pesticides, oxygen,
metals or any other substances. Sounds simple, doesn’t it?
Then what is good or bad water quality? To answer this, you have to ask, “What is
the intended use of the water?”. Is it for drinking or washing; industry or agricul-
ture? Each use has its own water quality requirements usually described in terms
of water quality parameters. If the water is suitable for its intended use, then it is
considered as good quality.
When you flip through these pages, you probably realise that I am writing from the
perspective of environmental conservation. Just imagine that you are an aquatic
animal. How would you want your habitat’s water to be like in order for you to
survive and thrive? After all, aquatic life can only survive within a certain range in
water quality parameters. However, never forget that most waterways in Singapore
eventually lead into our reservoirs where it is then channelled for treatment into
drinking water so the ultimate purpose of producing drinking water should also be
taken into consideration.
3.2 The watershed Concept
Water quality does not just reflect the health of the water upstream, it also indicates
what goes on in the watershed. In other words, water quality does not just tell you
about the characteristics of the water, it also reveals the land use patterns and pol-
lution problems on the ground, which are part of the watershed.
Watershed is also known as drainage basin or catchment area, the latter term being
more commonly used in Singapore. It refers to the land area from which the water
in a water body comes from. When rain falls over a given area and acts according
to the rules of gravity, it flows over the land or sometimes underground. Along the
way, the rain water picks up salts, metal ions and organic compounds of both natu-
ral and human origins. Eventually, the water and the substances it carries end up in
a water body. As you would have seen by now, the stuff in the water determines its
water quality, essentially generating a fingerprint of where the water has travelled
through.
22For example, Turf City is part of the watershed for Marina Barrage. Rainfall in Turf
City flows into Bukit Timah Canal, then Rochor Canal and into Kallang Basin before
charging headlong into the Marina Reservoir. In fact, this particular watershed cov-
ers a whopping one-sixth of the land area of Singapore.
Figure 8: The Marina Catchment. Marina Reservoir will play a key role in enhancing Singapore’s
water supply from local catchment. It has the biggest catchment among the 17 reservoirs, some
10,000 hectares (ha) in size or about one-sixth of Singapore’s land area. [Image from PUB]
By now, I hope you have understood that a good WQM programme should include
knowledge of the watershed of your monitoring site. This will be helpful when you
want to go beyond the reporting of water quality and into explaining the water
quality you observed.
233.3 PUB’s active, beautiful, clean waters (abc waters)
design guidelines
In 2009, the ABC Waters Design Guidelines (www.pub.gov.sg/abcwaters/
abcwatersdesignguidelines/Pages/ABCDesignGuidelines.aspx) was created and
launched by PUB, Singapore’s national water agency. These guidelines advise devel-
opers and industry professionals to incorporate environment friendly features such
as rain gardens, bio-retention swales and wetlands in their developments.
Remember our watershed concept? Almost 70% of rainfall in Singapore lands in
a watershed somewhere, ultimately ending up in our reservoirs. The plants and
soil media employed in the above features act as “filters” to remove nutrients and
sediments from the water going into our waterways. Besides improving the water
quality in our reservoirs, they are also pretty to look at, especially if the wetland at-
tracts a diverse range of wildlife.
Figure 9: Extensive roof garden at Marina Barrage. Rainwater is filtered
by the grass and soil before being directed into the drains.
243.4 Water Quality Parameters
The testing methods discussed in this chapter are intended for fresh waters. If sea-
water or brackish water is your interest, some methods may need to be modified.
As usual, do your homework before heading out to the field.
Some literature works have classified water quality parameters into physical, chemi-
cal and biological (including microbiological). However, I find that there is much
ambiguity over such definitions so I shall not be using these terms in the rest of the
book.
Another possible classification is based on whether a parameter is measured on-site
(in situ) or in an off-site laboratory (ex situ). Again, ambiguity is present for many
parameters. Some parameters must strictly be measured on-site e.g. pH, while oth-
ers can only be measured in a laboratory due to procedural requirements or logisti-
cal constraints. For instance, microbiological tests typically require incubation which
takes a day or two and requires an incubator only available in the laboratory.
Certain parameters which used to be tested in a laboratory can now be tested on-
site with the miniaturisation of formerly bulky equipment thanks to technological
advances. For instance, titrations can now be performed conveniently on a fresh
water sample by using micro scale apparatus, eliminating the need to lug around
cumbersome pieces of burette, flask and retort stand. Hence, shades of grey exist
for some parameters that can be tested both on-site and off-site.
In general, on-site testing minimises the degradation and loss of analytes in WQM,
while laboratory testing offers better accuracy and precision in measuring an ana-
lyte (provided there is little loss or degradation).
In the following testing methods, instead of dwelling on the pros and cons of on-
site vs. laboratory testing, I shall present the ones I found to be relatively low cost
and simple and yet have worked well for me in producing reasonable results.
I will first discuss about the various water quality parameters, factors affecting
them and their effects on the water environment. In the subsequent section on “fill-
ing in the data form and taking measurements”, I will elaborate on the methods of
testing these parameters.
253.4.1 Dissolved Oxygen (DO)
Dissolved oxygen (DO) is vital to aquatic creatures as air is to us. In fact, we are
breathing the same oxygen as fishes except that ours is mixed in air with other
gases, while theirs is dissolved in water. I cannot emphasise enough that DO is such
a vital parameter that I shall cover it first in my list. In some instances of massive fish
kills (e.g. off Pasir Ris and Pulau Ubin in Dec 2009/Jan 2010), fishes died from lack
of DO rather than from any particular poisons in the water.
Aquarium keepers are probably familiar with the lack of DO in their aquariums
when fishes are seen desperately gulping in air near the surface of the water. Fishes
are not the only aquatic denizens needing DO. Crabs, shrimps, insects and worms
too need DO though their requirements can be quite varied and dependant on how
well they have evolved and adapted to surviving in the absence of DO.
Oxygen is moderately soluble in water. The solubility limit or saturation concentra-
tion is largely regulated by temperature. Concentrations that exceed the saturation
value are described as supersaturated. Such conditions reflect high photosynthetic
activity (i.e. during an algal bloom). Under-saturated conditions prevail when DO
concentration is less than the saturation value, indicating that DO is used up by
processes which demands oxygen faster than can it be replenished.
DO in surface water is acquired from the dissolution of atmospheric oxygen and the
photosynthesis of aquatic plants and algae. However, many other factors affect the
level of DO. Here are some of the more common ones.
Organic matter
Organic matter pollutant (whether man-made or natural) uses up DO to decom-
pose (a.k.a aerobic decomposition). Man-made organic matter includes raw sew-
age, food waste, oil, detergents, pesticides etc., each of which has a different sus-
ceptibility to decomposition.
Natural organic pollutants in water include dead vegetation, animal carcasses, nat-
ural oils, tannins and humic substances. In the Amazon and other tropical forests,
the presence of tannins and humic substances gives the water its characteristic
black (or tea) yet clear coloration. No prizes for guessing that the colour of your tea
comes from similar substances.
26Turbulence
Increased turbulence in water or mixing will increase DO. Waterfall, rapids and
other artificial obstructions in flowing water tend to introduce atmospheric oxygen
into the water. Wind and rapid flow can also produce the same effect.
However, remember that these effects are the strongest at the interface between
water and air, where oxygen dissolves into water surface. Once dissolved, oxygen
will need time to diffuse into the deeper parts of the water.
Temperature
A rise in temperature decreases the solubility of oxygen in water, hence lowering
the DO level. Under natural circumstances (i.e. weather or seasonal changes), this
factor does not lower the DO enough to threaten aquatic life. But if other factors
(e.g. organic pollution) have already removed much DO, heat in water may just
push the more delicate aquatic organisms over the brink.
An increase in temperature will also stimulate the growth of bacteria and hence
increase the rate of decomposition of biodegradable organics. DO can drop drasti-
cally, making the situation worse.
Figure 10: Graph of dissolved oxygen at saturation against temperature in
water at sea level and zero salinity.
27Time of the day
Photosynthetic activity in plants and algae absorbs carbon dioxide and gives out
oxygen. Naturally, this process heightens as light intensity increases. Therefore, DO
level increases as the day goes on, reaching its peak in late afternoon. Conversely,
DO level tends to be at its lowest just before sunrise when respiration instead of
photosynthesis occurs in darkness.
Clear sparkling waters usually indicates healthy photosynthetic activity as oxygen
bubbles rise to the water surface. This is especially obvious when you visit one of
Singapore’s sea grass meadows (e.g. Labrador Park, Pasir Ris Park) where you can
literally watch the countless oxygen bubbles given off by these marine plants. Un-
der such an influx of oxygen, DO can rise above 10mg/L to 14mg/L or more.
Ammonia in water
High ammonia concentrations in water can also reduce the DO level as certain
bacteria consume ammonia and DO together to convert ammonia to nitrate in a
process known as nitrification.
In general, this mode of DO reduction by nitrification occurs at a slower pace com-
pared to aerobic decomposition of organic matter. It normally kicks in only after
the organic matter has been decomposing for a few days, assuming both organic
matter and ammonia were dumped into the water at the same time.
See the section on “nitrogen” for more information on ammonia.
Now I know DO is important but how much do I need?
In general, a DO level of above 5-6 mg/L is desirable for aquatic life. A DO level
between 1 and 5 mg/L allows various fishes to survive but their metabolism and
growth may be affected. Naturally, different fishes have different requirements.
For example, perch requires a DO of above 5mg/L to survive well whereas carp and
catfish only require a DO of 2.0–2.5mg/L. At DO levels of 1 mg/L and below, only
small creatures such as worms and mosquito larvae can survive.
Case in point: After the massive fish kill experienced by the fish farms off Pasir Ris
28and Pulau Ubin in Dec 2009/Jan 2010, several fish farm owners have taken the
initiative to install DO monitoring systems which are set to trigger an alarm when
DO drops below 4mg/L. This is apparently the critical DO level for the sea bass and
garoupa reared in these fish farms.
The fact that different organisms require different DO levels has been developed
into a useful tool in the form of a biotic index, to monitor the water quality in coun-
tries such as USA and UK. These aquatic organisms serve as “bioindicators” and
are invariably macroinvertebrates (insect larvae, crustaceans, snails, worms, leeches
etc.).
For example, a water body having a healthy mix of mayflies, dragonflies, worms
and leeches is likely to have good water quality. On the other hand, a stagnant
pond containing only leeches probably suffers from poor water quality.
Figure 11: Half a dozen aquatic leeches were found in a stagnant and muddy pond in a forest
next to Commonwealth Avenue West. The forest has since been cut down for development.
293.4.2 Temperature
Surface water temperature is mainly affected by the ambient temperature and solar
radiation. It is an important parameter to aquatic life since it affects physical, chemi-
cal and biological processes. However in the tropics, it usually does not fluctuate
much to have any significant effect unless certain human activities are present (e.g.
industrial discharge of cooling water which is warm and not cool). Even then, ther-
mal pollution is rare in Singapore.
Shade is a factor since a heavily forested stream is likely to have a cooler and more
stable temperature compared to an open-country canal.
Suspended solids in the water are prone to trap heat, raising the water tempera-
ture. Therefore, a stream with more suspended solids (or higher turbidity) is likely to
be warmer, at least near the surface.
Based on my WQM experience, normal water temperature differs from air tempera-
ture by at most a few degrees Celsius. In the day, water temperature tends to be
lower than air temperature as water takes a longer time to heat up compared to air.
This trend is reversed at night.
Effects of temperature changes in water
Besides the effects stated in the above section on DO, unnatural changes in water
temperature can adversely affect the health of aquatic life. In extreme cases, the
animals can be killed, though I have yet to observe such an occurrence.
You probably would have guessed by now – different organisms have different level
of tolerance to temperature change. Trout cannot survive in water above 25°C and
will not reproduce in water warmer than 14°C. On the other hand, hardy fish such
as carp can do well in water as warm as 35°C. This is why you never see trout in
Singapore except on the dinner table whereas carp (Koi is a member of this family)
are commonly found in ponds (and on the dinner table too).
303.4.3 Electrical conductivity
Like its electrical circuit counterpart, electrical conductivity (EC) expresses the ability
of a medium (water in this case) to conduct electricity. Units are in microSiemens
per centimetre (µS/cm) standardised at 25°C, or for larger values (e.g. seawater),
mS/cm.
The more dissolved salts there are in water, the higher the EC because dissolution
converts a salt into its constituent ions which enhance electrical flow. For example,
our common table salt is sodium chloride and upon dissolution, turns into sodium
and chloride ions. In this book, the term “salt” is based on its definition in chemistry
i.e. a chemical compound formed from an acid and a base. It does not exclusively
mean table salt.
These dissolved substances commonly include positive ions such as calcium, mag-
nesium, sodium, potassium and negative ions such as chloride, sulphate, carbon-
ate, bicarbonate. Other elements like iron and manganese may also be present in
trace quantities.
In nature, dissolved substances are predominantly derived from the erosion of soil
and rocks and are carried by surface run-off into water. Not surprisingly, a rise in
EC is commonly encountered during and after rain when surface run-off is at its
greatest.
There is also some direct contribution from rainwater which contains minute
amounts of salts. And in other parts of the world, saline groundwater may directly
infiltrate into rivers.
Terms with close meanings
Even though the terms below are often (erroneously) used interchangeably with EC,
each of them has a distinctive meaning.
Salinity refers to the total concentration of dissolved salts (or ions) present in water.
Units are usually in mg/L.
Total dissolved solids (TDS) refer to the amount of dissolved material in water, usu-
ally measured in mg/L. It includes dissolved salts and dissolved organic matter e.g.
sugar, so TDS tends to overestimate salinity.
31A typical (and probably overused) conversion between TDS and EC in fresh water
is:
TDS (mg/L) = 0.64 EC (µS/cm)
This relationship varies with the concentration of salts in the water and the propor-
tions of the various salts present. Primarily due to differences in catchment geology,
concentrations and proportions of salts vary among different locations. Hence EC
does not always convert to TDS based on the above equation.
What do I use EC for then?
Measurement of EC can tell you a useful piece of information – are you looking at
fresh, brackish or salt water?
Table 1: Definitions of different types of water
EC (µS/cm) Type of water
0 - 1990 Fresh
1990 - 19900 Brackish
> 19900 Salt
Now, compare the above values with rain water having an EC of 60µS/cm and be-
low – obviously fresh. Surface fresh waters tend to have an EC within the range of
30-500 µS/cm.
This is especially helpful when you are monitoring a stream that leads to the sea.
Which part of the stream are you sampling - the freshwater upstream, the salt wa-
ter near the coast or the brackish water in the estuary (or mangroves)? Also, keep in
mind that during low tide, the stream may be fresh water but once high tide comes
in, the same stretch of stream turns into brackish or even salt water.
In addition, you can monitor the EC in a stream to affirm whether tidal influences
are present. In other words, the EC should not be changing if the water is free of
tidal influence.
32Effects of EC changes in water
Freshwater organisms can only survive within a certain range of EC. They perform
osmoregulation to maintain a steady ionic concentration in their bodies. Since the
external aquatic environment (fresh water) has a lower ionic concentration com-
pared to within their bodies (blood, intercellular fluid etc.), they need to expend
energy to excrete water and retain ions (nutrients). Different freshwater species
have different requirements for EC.
A general rule is fresh water should remain at less than 1000-1500 mS/cm to main-
tain a rich diversity and abundance of aquatic invertebrates and plants. (As always,
there are exceptional organisms e.g. mangrove plants, that can tolerate waters
ranging from fresh to salty.)
The converse unfortunately holds true for marine organisms too as they are mostly
unable to survive in fresh water. In December 2006/January 2007, an interesting
occurrence of fresh water intrusion into the sea off Pulau Ubin resulted in a mass
death of marine life. In this particular episode, the main cause was unusually heavy
rain (fresh water of course) which significantly diluted the seawater.
On a more global perspective, rising sea levels due to climate change has led to
seawater intrusion into freshwater rivers, severely affecting agriculture and aqua-
culture. For example, in Bangladesh, seawater rushing into formerly fresh waters is
forcing the local fishermen to fish for prawns instead of the usual fishes which have
migrated to less salty waters upstream.
3.4.4 Turbidity
Turbidity measures the loss in transparency in water due to the presence of sus-
pended particles in water such as phytoplankton (free floating micro-algae) and silt
from surface runoff. Therefore, turbidity often increases significantly after a heavy
rain. Remember the part about taking the weather into account? This fact can eas-
ily be missed out, especially for newbies to WQM.
In addition, discharge of sludge (suspension of solids in wastewater) from industrial
activities could have contributed to turbidity in natural waters though this is rare
and illegal in Singapore.
33Turbidity is measured with a nephelometer in nephelometric turbidity unit (NTU). In
general, natural surface waters have a range from 1 – 300 NTU. For comparison,
our tap water is limited to a maximum of 5 NTU, beyond which turbidity becomes
visible in water.
Figure 12: (From left to right) Turbidity standards of 1 NTU, 10 NTU, 100 NTU, 1000 NTU. They are
used for calibration of a turbidity meter.
34Next time when you go around Singapore, take a good look at the open-country
streams and canals. Many of them take on a perpetually muddy appearance (think of
kopi susu or teh susu). From Sungei Ulu Pandan, Sungei Pandan and Ngee Ann Stream
to Sungei Pang Sua, these waterways receive lots of runoff carrying eroded soil from
their watersheds.
Figure13: Kopi susu in Ngee Ann Stream. Such turbidity is quite commonly observed in Singapore.
35How will turbidity affect aquatic life?
High turbidity (> 5 NTU) can affect light penetration, reducing photosynthesis of
aquatic plants and algae. This leads to a drop in DO, further affecting many other
aquatic animals.
Suspended particles may also settle on the stream bed over time, resulting in a shal-
lower water depth and smothering benthic (bed dwelling) organisms.
Fishes in particular can become very stressed in waters that remain highly turbid for
a long time. Signs of stress include increased respiration rate, reduced growth and
feeding rates, delayed hatching and in severe cases, death. Fish eggs are ten times
more sensitive than adult fish. A turbidity of 10 NTU for several hours is enough
to cause stress in fishes while 1000 NTU for several months can cause death. As
always, different species of fishes have different tolerances as they would have de-
veloped different adaptations to handle turbidity.
3.4.5 pH
pH is a measurement of the acidity or alkalinity in water, having a scale of 0 to 14
with 0 being very acidic, 7 being neutral and 14 being very alkaline.
Figure 14: Rough estimates of the pH of various
commonly encountered substances
Before going further, here is a small bit on chemistry. A water molecule can split into
one hydrogen ion (H+) and one hydroxyl ion (OH-). Acidity is due to the presence of
more hydrogen ions than hydroxyl ions in water. These hydrogen ions are contrib-
uted by acids. Conversely, alkalinity is due to the presence of more hydroxyl ions
than hydrogen ions in water. These hydroxyl ions are contributed by alkalis or bases.
36Neutrality means that hydrogen ions and hydroxyl ions are in equal quantities.
pH is another one of the master parameters (temperature was introduced earlier)
affecting many chemical and biological processes in water. Hence, it influences
aquatic life both directly and indirectly.
Most literature cite a pH 6 - 9 or 6.5 – 8.5, depending on how tight you want the
specifications to be for optimum growth and health of freshwater organisms. Fresh
water within this pH range is therefore healthy and unpolluted, assuming that there
are no other aggravating factors. For comparison, seawater tends to be alkaline
with a narrower pH range of 7+ to 8+.
Why is near neutral pH conducive to freshwater aquatic life?
Fish and other vertebrates have an average blood pH of 7.4. This blood comes into
close contact with water (separated by only 1 or 2 cells) as it passes through the
blood vessels of the gills and skin.
Hence, a desirable pH range in water would be close to that of fish blood to mini-
mise the metabolic burden of adaptations for correcting a pH imbalance between
the internal bodily environment and the external environment.
Adverse effects of acidity in water
Below is a typical table of pH tolerances for various freshwater organisms.
Table 2: Effects on aquatic life at various pH levels
pH Effects
< 6.0 Death of snails and crustaceans
< 5.5 Death of salmon
< 5.0 Death of perch and pike
< 4.5 Death of eels
Toxic metals e.g. Aluminium leach into water
< 4.0 Most life forms in surface water die
A observant reader will realise that the above information pertain more to temper-
ate zones rather than hot and humid Singapore. Will the figures apply here then?
See next page for a further discussion.
37What is the optimum pH range then?
The “optimum” pH range of 6 - 9 is commonly based on studies done in developed
countries of the temperate zone. The authors were probably not thinking about
forest streams or acidic freshwater swamps found in the tropics. And this is not to
mention extreme freshwater environments such as highly acidic peat swamps and
volcanic lakes, also found in the tropics.
Typically pH values recorded at the BTNR range from 3 to 5 while the pH values for
Nee Soon Freshwater Swamp are commonly found to range from 4 to 5.
Before we confidently conclude that these fresh waters in BTNR and Nee Soon are
not desirable, first consider the following; these waters are naturally acidic due to
the character of the dominant soils in the area and the organic decomposition of
leaf litter from the rainforest. More likely than not, the freshwater organisms would
have found a myriad of ways to adapt to the “hostile” environment.
Back to our question, what then is the optimum pH range? Unfortunately, there is
no hard and fast rule. Your best bet is to perform a long term WQM of your water
body of interest to establish a baseline pH range. Any deviation, whether sharp or
gradual, from this range in the future should prompt you to investigate further to
determine if something bad has gone down.
Actually, this should be applied to all other WATER QUALITY parameters. Hence a
long term WQM programme with regular monitoring is the cornerstone in protect-
ing our aquatic environment.
The miniature survivor
Here is a perfect example of how animals adapt and survive in a supposedly hostile
environment.
Let me introduce the world’s smallest freshwater fish – Paedocypris progenetica. At
7.9mm for a female specimen, its small size can be an advantage in the highly acidic
peat swamps in Sumatra and Borneo. These swamps experienced great fluctuations
in water level. As the water level drops, only small puddles of water remain in a
previously wet swamp. The fish’ small size enables it to survive in such puddles.
38Feeding on plankton, P. progenetica is found in reddish black swamp water with extreme
acidity at pH as low as 3. Contrary to common belief that such swamps are species poor
ecosystems, they harbour a significant number of miniature endemic fish species.
What makes water acidic?
Dangerously alkaline waters (> pH 9) are rare in Singapore. Therefore, we shall narrow
our discussion to acidic waters.
Industrial pollution can be a cause of acidity in fresh water though this is uncommon in
our inland waters in view of the strict regulation and enforcement by National Environ-
ment Agency (NEA).
Acid rain CAN be a cause of acidity in fresh water. Just think of the big ruckus raised
over the acidic lakes in Europe and U.S.A. when the acid rain issue was first raised to
global attention. Based on my rainfall data collected in Singapore Polytechnic in 2006,
pH of rainwater ranged from 3 to 5. Another set of data collected by PUB from January
to December 2010 showed that the pH of rainwater in various reservoirs and a pump-
ing station ranged from 5.6 to 7.2. The point is keep in mind that the pH of surface
water can be adjusted to a level close to rainwater.
Common in tropical zones, decomposing vegetation produces organic acids (e.g. humic
acid, tannic acid). If the vegetation is already in the water, the water’s pH will immedi-
ately be impacted. Even if the decomposition is on land, an abundance of rainfall in the
tropics can wash these acids into water. This phenomenon is the main cause of acidic
peat swamps.
In areas with underground ore containing sulphur or its compounds, acid mine drainage
can occur. If this ore is somehow brought to the surface where oxygen is present, it is
oxidised to sulphuric acid, usually via bacterial action. The effect on surface water pH
can be tremendous as pH plunges to about 1.5 to 3.5.
39Time of the day
The savvy WQM practitioner would do well to remember that pH fluctuates natu-
rally on a daily basis so as not to quickly jump to the conclusion that pollution has
occurred. The main driver for such fluctuations is the presence or absence of sun-
light and its intensity.
Algal and plant activities take in carbon dioxide under sunlight, reducing the acidity
due to carbonic acid which can arise from carbon dioxide in water.
Thus, pH is lowest (or most acidic) just before sunrise and becomes progressively
higher as the day goes on. It normally reaches its peak in late afternoon.
At this point, some of you will realise that pH and DO rise and fall in tandem with
the time of the day. This could be a useful check for your WQM data if you plan
to track water quality over the course of the day, perhaps as part of establishing a
baseline for a particular water body.
3.4.6 Alkalinity
Alkalinity reflects the water’s capacity to neutralise acids. It may also be interpreted
as the quantity of bases present in water. Familiar to fish hobbyists or commercial
fish farmers, it acts as a buffer to changes in pH.
Alkalinity is derived from bicarbonate, carbonate and hydroxide though ammonia,
phosphate and borate may make a minor contribution. However, in Singapore’s
context (again due to it being in the tropics...), bicarbonate is the major player.
Most of the time, the kind of alkalinity relevant to WATER QUALITY is total alkalin-
ity. It is expressed in mg/L as calcium carbonate (CaCO3). A good level of total alka-
linity (>80mg/L CaCO3) is beneficial in maintaining a stable aquatic environment.
As water flows over land or percolates through soil and underground rock contain-
ing bicarbonates and carbonates, total alkalinity increases. Since Singapore soils
tend to be acidic (Chia et. al., c1991), the total alkalinity ranges from non-existent
to moderate.
40Based on my data accumulated since 2006, an open-country rural stream like Ngee
Ann Stream has a total alkalinity that never exceeds 80mg/L CaCO3, while the forest
streams in BTNR typically have zero total alkalinity. In contrast, PUB’s data in 2010
indicated that reservoirs (open-country stationary) have a total alkalinity ranging
from less than 5 to 54mg/L CaCO3.
How much alkalinity is really needed?
The following numbers were extracted from various sources. Though such studies
are usually done in temperate countries, they can nevertheless provide a handle on
the kind of effects we expect to find in WQM in the local scene.
Table 3: Different levels of total alkalinity
Total alkalinity (mg/L CaCO3) Description
> 20 Water can trap carbon dioxide (CO2)
and increase the level of dissolved CO2
available from photosysnthesis, especially
in submerged plants and algae
20 - 300 Typical range for surface water
75 - 200 Desirable range for fish
413.4.7 Hardness
Let me start by first clarifying that hardness here does not refer to how the water
feels to touch.
Total hardness in water refers to the amount of dissolved calcium and magnesium,
as well as other elements in smaller quantities, e.g. iron. The major source of hard-
ness in surface waters is from contact with soil and rocks, with rainwater constitut-
ing a minor source.
More often, rainwater is incapable of dissolving the vast amounts of solids found in
many natural waters. The ability to dissolve the solids is gained in the soil where car-
bon dioxide is released by bacterial action. The soil water becomes highly charged
with carbon dioxide, some of which can convert to carbonic acid. Under the low pH
conditions that develop, certain minerals e.g. limestone, dissolve to release calcium,
magnesium, bicarbonates and other ions into water.
Hardness is usually measured in terms of mg/L of calcium carbonate (CaCO3), just
like alkalinity.
Table 4: Typical scale for water hardness
Total hardness (mg/L CaCO3) Description
300 Very hard
Based on literature, total hardness of inland surface waters ranges from less than
5 to 200 mg/L CaCO3. Similar to total alkalinity, total hardness in Singapore’s fresh
waters tend to be low, right in the “soft” category which is comparable to local tap
water. Because of the acidic nature of forest streams, the water there has slightly
lower total hardness versus open-country waters.
42Calcium vs. magnesium hardness
Hardness can further be differentiated into calcium hardness and magnesium hard-
ness arising from calcium and magnesium, respectively. Both are also measured in
terms of mg/L CaCO3.
Why is this necessary? In general, freshwater organisms need more calcium rela-
tive to magnesium. Sometimes, literature provides the hardness requirement of a
certain organism in terms of calcium hardness. This is especially applicable in waters
limited by calcium.
Based on my water quality data compiled from 2006 to the present, Singapore
fresh waters appear to have more calcium than magnesium. The reverse seems to
be true for Singapore seawater, again based on my data. For example, during a field
trip to Ngee Ann Stream, calcium hardness was determined to be about 90% of the
total hardness while magnesium hardness only constituted 10%.
Why need hardness?
Calcium and magnesium are required for the growth and maintenance of aquatic
organisms, as well as for the development of eggs and larvae. A calcium hardness
of above 12.5 – 25mg/L CaCO3 is ideal for egg and larval development.
Freshwater fishes survive best under stress when the calcium hardness is above
25–50mg/L CaCO3.
Crustaceans require relatively large amounts of these two elements for their exo-
skeletons. Molting eliminates a high percentage of these elements from a crusta-
cean so an adequate supply is especially critical. A total hardness of at least 50mg/L
CaCO3 is necessary for freshwater crustaceans.
Referring to data from 2006 – 2009, the waters in BTNR were found to be below
the given “ideal” levels for freshwater aquatic life. Again, I have to remind you that
the “ideal” is based on non-tropical studies.
433.4.8 Nitrogen
Here, we are not referring to nitrogen gas dissolved in water as its concentration in
water is rather insignificant. Instead, we are more concerned about nitrogen com-
pounds such as ammonia and nitrate.
Ammonia and nitrate can be found in human/animal waste (both solid and liquid),
food waste and fertilisers.
This is of course why human and animal wastes are applied as fertilisers in devel-
oping countries. In fact, I have heard that a ten times dilution of urine is a superb
substitute for synthetic fertiliser. Talk about recycling our waste! A study in Thailand
estimated that about 8g of nitrogen and 2g of phosphorus could be excreted per
person per day in both the solid and liquid waste of a sample population.
Next to carbon, hydrogen and oxygen, nitrogen is a key element in all life forms.
Animals and humans get nitrogen from our food, especially proteins while plants
get theirs from ammonia and nitrate (fertilisers!) in the soil. Also, let us not forget
that certain bacteria can fix nitrogen gas from the air, converting them into a usable
form (ammonia) for their plant hosts e.g. legumes.
Since nitrogen works in a cycle, decomposition of nitrogenous organic matter (dead
plants and animals) releases ammonia back into the environment. This is known as
ammonification.
In a continuation of the cycle, nitrifying bacteria perform nitrification (mentioned
in the section on dissolved oxygen) to convert ammonia to nitrite and then to ni-
trate.
To complete the cycle, nitrate can be converted back into nitrogen gas by other
bacteria through a process known as denitrification. Unlike nitrification, denitrifica-
tion takes place under anaerobic (lack of oxygen) conditions e.g. deep underground
or underwater.
44Effects of ammonia in water
The ammonia content of surface water is an indicator of the sanitary quality of
water. High ammonia content in water, besides releasing that characteristic “urine”
smell, means that human waste has probably entered the water.
One major problem with ammonia is its toxicity to animals. Fish hobbyists should
be familiar with this phenomenon as they religiously change water to prevent their
fishes from dying off due to the accumulation of ammonia from fishes’ waste prod-
ucts. Note that unlike animals, plants and microorganisms look upon ammonia as
a nutrient rather than a toxin!
Unfortunately, the issue is complicated by the fact that ammonia can exist as am-
monia (NH3) or ammonium (NH4+), depending mainly on the pH. Under acidic con-
ditions, ammonium ion tends to predominate while ammonia is the major compo-
nent in an alkaline environment.
Surprise, surprise, ammonia is toxic while ammonium is not. Before you start pulling
your hair out of frustration, you can google for an online calculator for determining
the amount of ammonia and ammonium in water. You will need to have your water
temperature, salinity and pH handy though so as to make an accurate calculation.
(High pH, high temperature and low salinity increase the proportion of ammonia.)
Ammoniacal nitrogen (nitrogen in the form of ammonia or ammonium) is normally
less than 0.25mg/L in unpolluted waters. Ammonia should not have any lethal or
sub-lethal effects below 0.005-0.01mg/L (as nitrogen) for warm water fish spe-
cies.
Finally, remember that ammonia exerts an oxygen demand through nitrification; 1g
of ammoniacal nitrogen consumes 4.6g of DO in this process.
45Eutrophication
Eutrophication, or over-fertilisation, in water bodies has aroused a great deal of
ecological concern. Nutrient enrichment enhances the growth of algae and even
weeds. This may lead to the green scum (other colours are possible depending on
the type of algae) of an algal bloom or ugly masses of water weeds.
Figure 15: Eutrophic waters in Botanic Gardens. Notice the green tinge due to green algae.
46You can also read