How we heat our homes in 2021 - Developing an Agent Based Model for the energy transition: analysis of real world heating behaviour from the ...
←
→
Page content transcription
If your browser does not render page correctly, please read the page content below

How we heat our
homes in 2021
Developing an Agent Based Model for the energy
transition: analysis of real world heating behaviour
from the world’s largest living lab

How we heat our homes in 2021
Centre for Net Zero is an open research lab, helping to realise faster,
fairer and more affordable paths to net zero. Our association with
Octopus Energy means we can draw upon the experience of serving
more than two million UK households, informing detailed simulations
of the energy transition that are based on real world data.

We’re currently building an agent-based model for the decarbonisation
of heat and transport. Households are critical actors within
those transitions and an important model input is a data-driven
understanding of how different households heat their homes today.
From there, we can start to ask how things may change, for example in
relation to heating technologies, energy efficiency, price signals and
extreme weather.

Below we share some of what we’re learning about real-world heating
behaviour in the process of setting up those household agents.

How we heat our homes 2021

Five things we’ve learned about heating in 2021
1.   Beneath the average household gas demand of 12,000 kWh per
     year, there is an incredible breadth of heating requirements.
     While some of this can be attributed to home size and energy
     efficiency, there is compelling evidence that we need to make
     policy not based on averages but on a broad and data-driven range
     of heating experiences and behaviours.

2. Improving energy efficiency by one EPC band can have an impact
   of 9-10% on overall gas requirements, but this impact is more
   profound at cold times when most gas is being used for space
   heating.

3. At temperatures below 5oC, we estimate that 75-80% of gas is
   used for space heating, but this falls quickly as temperatures
   increase. It falls fastest for flats and slowest for bungalows. We
   similarly observe that flats appear to switch off their heating at
   significantly lower temperatures than bungalows.

4. While the average gas consumption profile across the day has
   clear peaks at 6-7am and 5-6pm, there is considerable variation
   across households. Inferred heat pump pro les linked to dynamic
   time of use tariffs appear to have a pre-6am peak and a flatter
   afternoon and evening pro le. There is need for more research on
   heat pump pro les and their potential flexibility to price signals.

5. In many cases, adopters of electric heat pumps have also
   adopted or are interested in other low carbon technologies.
   While the domestic heat transition deserves focus, it is important
                                                fi
   to consider its links to transport and business activity. Through
   our agent-based model we hope to uncover insights which spans
                              fi
   these important areas.
                   fi
 How we heat our homes 2021
What factors influence the need for heat?
                              In the analyses below, we used smart meter readings from a sample of ~11,500 households over the
                              course of a year (July 2020 to July 20211). We begin by looking at gas usage as a proxy for space heating
                              requirements, and go on to consider what proportion of gas usage is attributable to cooking and hot water.

                              Using gas smart meter data, we found we were able to predict a household’s daily heating requirements
                              with good accuracy based on a number of attributes. Some of these attributes are specific to a household
                              and some to their environment.

                              Average Predicted vs Actual Daily gas usage over time, for a sample of households

                                                                                                                                                                                          Predicted
                                                                                                                                                                                          Actual
                                    80

                                    60
                             kW/h

                                    40

                                    20

                                     Jul              Aug          Sep          Oct          Nov          Dec          Jan           Feb         Mar           Apr          May          Jun

                                                                                                                   Date

                                                                                                                             Figure 1 - Actual vs predicted mean daily gas usage for a sample of households

How we heat our homes 2021           1
                                         Note that while we expect many of the conclusions here to hold post-Covid circumstances, overall gas consumption is likely inflated by Covid-19 lockdown behaviours
The plot below shows some of the most important features in predicting gas usage
(in order, from most important). The colour shows whether the input feature took
high or low value (non-numeric inputs are shown in grey), while the x-axis indicates
whether a higher or lower value of gas consumption is predicted as a result. For
example, floor area is an important feature (ranked towards top), where high values
are linked to predictions of higher gas consumption.

                                                                                                           High

apparenttemp_mean

floor_area

property_value

cloudCover_mean

                                                                                                       Feature value
year_built

current_energy_rating

windSpeed_mean

lifestage

property_type

dayofweek
                                                                                                           Low
                               -40         -20        0          20         40         60
                                     SHAP value (impact on model output)

      Figure 2 - A SHAP summary plot shows us which features were most important in predicting gas usage

How we heat our homes 2021
To understand the relationship between non-numeric features such as the Energy Performance
                              Certificate rating upon gas consumption, we can apply a change and observe the impact on
                              predictions. In the example below, we observe that better EPC bands are associated with lower
                              gas consumption. Over the sample and time period we used, improvement by a single EPC band
                              amounted to a 9-10% reduction in predicted gas consumption over the period of a year. Naturally,
                              these reductions are very seasonal, with a higher drop in consumption over the colder months (a
                              ~12% reduction in a cold week).

                              Average Predicted daily Gas usage over time, if all EPC ratings (except A)
                              are improved by one band

                                                                                                            Predicted
                                                                                                            Predicted - Improved EPC (1 band)

                                    80

                                    60
                             kW/h

                                    40

                                    20

                                     Jul   Aug   Sep    Oct     Nov    Dec      Jan    Feb    Mar     Apr            May         Jun

                                                                             Date

How we heat our homes 2021
How different are different households?

This is an important question. Understanding how households differ from one another
and therefore might perceive options differently is paramount to how we plan for the
energy transition. It is important that we capture these differences within our model,
rather than relying on simple averages.

One commonly used assumption is that the average UK household consumes
12,000kWh of gas per year. As you can see from the data below, there appears to be
substantial variation around this figure and care must be taken to ensure that policies
and plans work for homes across the distribution.

Annual gas consumption of sampled properties, from July 2020 to July 2021
              1e-5

          8

          7

          6
Density

          5

          4

          3

          2

          1

          0
          -5000      0   5000    10000         15000           20000   25000   30000   35000

                                Annual gas consumption (kWh)

   How we heat our homes 2021
As seen earlier, underlying variation in gas consumption will include factors
                                       like floor area and EPC band. The chart below plots annual gas consumption
                                       per square metre by EPC band to highlight the impact of EPC after controlling
                                       for floor area. While there are significant differences in energy consumption
                                       between EPC ratings, it is clear that each rating contains a broad spectrum of
                                       properties with different needs.

                                       Annual gas consumption per square metre of sampled properties,
                                       from July 2020 to July 2021

                                       0.010

                                                                                                   House C
                                                                                                   House D
                                       0.008                                                       House E

                             Density
                                       0.006

                                       0.004

                                       0.002

                                       0.000
                                                      0             100                    200      300          400

                                                                    Annual gas consumption (kWh)

How we heat our homes 2021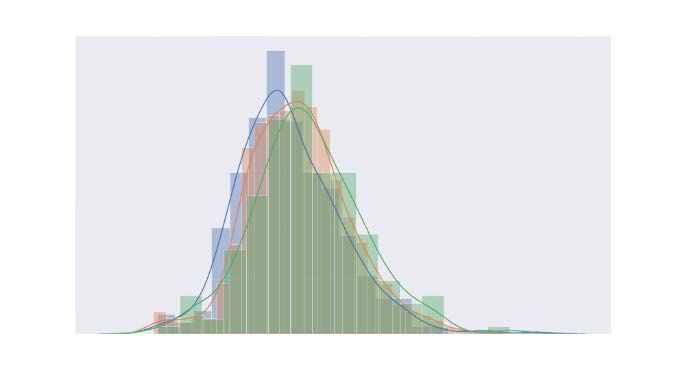
When do we switch the heating off?                                         Flat/Maisonettes
                                                                               Temperature at which household uses the lowest 0-10 % of its typical daily gas consumption
The next question we asked was what determines                            10
                                                                                          Flat/Maisonette A
the temperature at which a house turns the                                                Flat/Maisonette B
heating off. Here we refer to this as a ‘breakpoint’,                     08
                                                                                          Flat/Maisonette C
                                                                                          Flat/Maisonette D
and again, it’s of interest to our agent-based                                            Flat/Maisonette E

model.
                                                                          06

                                                             Proportion
In order to compare consumption behaviours like-
for-like, we drew at least six months of data for                         04

every household in our sample, and scaled their
individual daily consumption so that all values                           02

lay between 0 (min) and 1 (max). For example, a
value of 0.1 for a home on a given day means that                         00
                                                                                           0                   5                   10                   15                  20                   25
the home is using 10% of their own observed
                                                                                                                                     temperature_max
maximum gas usage (which is likely to have                                      This plot is a cumulative distribution and, for example, shows that ~60% of EPC a flats have reached minimal gas consumption by
happened over deep winter).                                                     15oC, while ~40% of EPC F flats have at this temperature

Our data shows that within a given property type,                          Bungalows
we see that more e cient EPC bands are able to                                 Temperature at which household uses the lowest 0-10 % of its typical daily gas consumption
switch off their heating at lower temperatures,                           10
                                                                                          Bungalow/Chalet A
as is intuitive. We also see variation by property                                        Bungalow/Chalet B
type - bungalow property types tend to wait for                                           Bungalow/Chalet C
                                                                          08              Bungalow/Chalet D
higher temperatures before lowering their gas                                             Bungalow/Chalet E

consumption, while flats turn down their heating
                                                                          06
at lower temperatures2.
                                                             Proportion

Plot: Proportion of households using within 0-10% of their                04
individually-observed maximum gas usage, by temperature.
                      f
Here we use the maximum temperature to summarise a day’s
                                                                          02
temperature.

                                                                          00
                                                                                           0                   5                   10                   15                  20                   25
                                                                                                                                     temperature_max

                                                                               This plot is shifted rightwards, versus the previous. This means, for example, on a day with a max. temperature of 150C, ~40% of
                                                                               EPC A Bungalows have reached their minimum gas consumption while ~60% of EPC A Flats have (see plot above).
How we heat our homes 2021
                                                                               2
                                                                                 Note that we do not expect property type to be the sole factor influencing the breakpoints here; factors like floor area and occupant lifes-
                                                                               tage are likely contributing factors in these findings.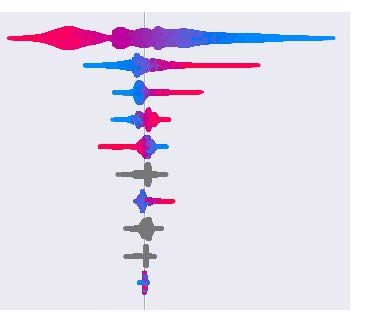
How much gas is being used for space
heating rather than hot water or cooking?

Next we consider gas usage within two coarse
                                                                                                                             Estimated proportion of gas used for space heating, by daily temperature (max)
categories: (a) cooking and hot water and (b) space

                                                        Estimated proportion of household gas used for space heating
heating. This helps us to identify the potential
                                                                                                                                                                                                         Bungalow/Chalet
impact of energy efficiency upgrades or extreme                                                                        0.8                                                                               Flat/Masionette
weather events and to understand periods where                                                                                                                                                           House

heat demand may be more or less flexible to price
changes.                                                                                                               0.6

To this end, we assume a household’s cooking and
hot water gas budget can be represented by their                                                                       0.4
gas usage across a series of recent ‘heat wave’
days in the UK, when we can consider it unlikely
that people will have chosen to heat their home.                                                                       0.2
Each household’s individual gas budget can be
represented as a normal distribution, with 95%of
values from this distribution expected to fall within                                                                  0.0
two standard deviations from its mean. We make
                                                                                                                                      -5        0               5             10             15     20          25
the simplistic assumption that gas consumption >2
std devs away from the mean observed on hot days                                                                                                    Max apparent temperature during day (Celcius)

is gas that has been used for space heating.

The plot below shows the proportion of gas used
for space heating at a given temperature band, by
property type. It suggests, for example, that on days
when the maximum apparent temperature reaches
15°C,
How is heat demand profiled across Gas Consumption Boxplots - by Hour of Day
the day?
Above, we examined heat demand at a daily-level. 8
As a greater proportion of heating is electrified it
is critical to also understand the nature of intraday
heat demand, how it may contribute to peaks 6
in electrical demand and how price signals may
Gas Consumption (kWh)
mitigate this effect. Aggregated views of daily
consumption don’t reflect the variation between 4
households in their half-hourly heating patterns,
which can be substantial even within the same
household. The boxplots below illustrate variation 2
in gas consumption by hour of day across the first
half of 2021.
0
0 1 2 3 4 5 6 7 8 9 10 11 12 13 14 15 16 17 18 19 20 21 22 23
Hour of the Day
Boxplots are used to visualize and compare distributions. The edges of the box show the quartiles of the dataset (1st quartile - 25%
of observations are under this, 3rd quartile - 75%). The line through the box shows the median. The whiskers extend to show the
rest of the distribution (excluding outliers). For example, our sample group had gas consumption of between 0 and ~5.8kWh at
07:00 over the rst half of 2021, though the first quartile is 0kWh, the median is ~0.5kWh, and the 3rd quartile is ~2.2kWh.
fi
How we heat our homes 2021Normalised heat pump profiles, averaged over a cold week in Feb
2021. Sampled from households on dynamic price tariffs, often with
What about heat pumps? complementary LCT ownership (batteries, PV)*
1.5
While 85% of UK homes are heated by gas boilers
today, we expect electric heat pumps to play a
growing role. While heat pump rollout in the UK
Normalised half hourly power
has been limited to date, we know that heat pumps 1
exhibit quite different consumption profiles to gas
boilers, given their lower flow temperatures and
dynamic coefficient of performance.
0.5
One area that is often discussed is how heat
pumps run in cold weather scenarios. We looked
at electricity consumption for properties with and
without heat pumps, over the course of a cold
0
week in February 2021. From these we inferred the 00:00 03:00 06:00 09:00 12:00 15:00 18:00 21:00 00:00
heat pump consumption profile below. We used a
Source: Centre for Net Zero, 2021 *‘EV owners excluded from analysis’
sample of 450 homes with heat pumps, all of whom
were on dynamic time of use tariffs. In contrast
to previous studies, these households show an 0oC External Temperature
earlier morning peak (pre-6am) and a relatively low 1.5
contribution to the traditional tea-time peak (from
Heat Pumps
16:00-19:00). Boilers
You can find more detail on this and an analysis
Normalised half hourly power
1
of heating patterns within London in our London
Climate Action Week webinar. As the number
of installed heat pumps grows, understanding
the range of consumption behaviours and their
flexibility is an area which we believe deserves 0.5
further research.
0
00:00 03:00 06:00 09:00 12:00 15:00 18:00 21:00 00:00
Source: Love et al, 2017
How we heat our homes 2021How might price influence the shape of future heat demand? With the greater electrification of heat, one factor that is increasingly important to model is demand response by households to dynamic electricity time-of-use tariffs -- in other words, how households may adapt their electricity use based on price they pay at different times of day. We might expect that households are more likely to respond to one magnitude of price signal during ‘off-peak’ time periods or during certain types of activity, while a price signal of another magnitude might be needed to change behaviour relating to more important or regular activities. We can also hypothesise that different types of households with different low carbon technologies, from heat pumps to electric vehicles, may respond quite differently. In July 2021 we will be kicking off a study to investigate these different behaviours, across different geographies and under different market conditions. We anticipate this will provide valuable insights to inform our agent-based model and the role of household flexibility within the future energy system. How we heat our homes 2021
What does this mean for the energy
                             transition?

                             In summary, the circumstances and behaviours of
                             UK households within the transition to clean heat
                             cannot be easily approximated by a single profile,
                             nor even by a small number of neatly defined
                             segments. This presents a significant challenge to
                             those trying to plot a fast, fair and affordable path
                             to net zero ahead.

                             Within our agent-based model, our intent is not
                             to simulate individual consumption perfectly
                             accurately, but to surface higher level behaviours
                             and impacts which reflect the breadth of validated
                             behaviours and circumstances of the underlying
                             agents. The approach allows us to consider
                             how costs and benefits are distributed and to
                             quantitatively consider issues of fairness. It also
                             allows us to consider choices explicitly from the
                             perspective of the multitude of people involved in
                             the energy transition.

                             Finally, we know that households do not make
                             heating decisions in a vacuum. Businesses of many
                             sorts are also important actors within the energy
                             transition. Aside from heating, households will
                             need to make a series of decisions about how they
                             move around. As we expand the scope of our agent-
                             based model to consider the interactions between
                             these moving parts, we will continue to share the
                             insights that we glean.

How we heat our homes 2021
You can also read