Communities Department Socio Economic Update No. 43 - March 2021 - Comhairle nan Eilean Siar

Page created by Tyler Gutierrez
 
CONTINUE READING
Communities Department Socio Economic Update No. 43 - March 2021 - Comhairle nan Eilean Siar
Communities Department
                                          Socio Economic Update
                                                  No. 43
                                                        March 2021

                                                                                       Shawbost

IN THIS ISSUE (click on links)

Household Projections              Small Area Population Estimates        Migration

Life Expectancy                    Covid Local Economic Impact            Hate Crime

Sea Fisheries Statistics           Gross Weekly Pay                       ScotlandsPeople

                           Comhairle nan Eilean Siar - Socio Economic Update No. 43
Communities Department Socio Economic Update No. 43 - March 2021 - Comhairle nan Eilean Siar
Socio Economic Update No. 43

Household Projections
2018 based Household Projections were                       As shown in the chart below in 2028, in all age
published by National Records of Scotland in                groups (apart from 16-19 years) up to the age of
September 2020. The projections are produced                69 years old, men are projected to be more likely
every two years and show how many additional                to live alone than women.
households would form based on previous                     From the age of 70 onwards, women are
trends.                                                     projected to be more likely to live alone than
Nationally, the number of households is                     men and this likelihood increases with age.
projected to increase by 5% (120,000) to 2.60               Adult female households in the 90+ age group
million in 2028. The number is projected                    are projected to rise from 141 households in
to decrease by 2.3% from 12,773 to 12,478                   2018 to 203 households in 2028, in contrast to
households in the Outer Hebrides.                           20 male households in 90+ age group in 2028.
Over the period 2018 to 2043 the Outer                      This reflects the continued higher life expectancy
Hebrides is projected to have the highest                   of females than males.
decrease in households at 11%.
Scotland’s population is ageing. One person                                                 Adult Male & Female Households 2018 & 2028

households are the main household type and
                                                             450
                                                             400

this is projected to continue with households
                                                             350
                                                             300

with children declining.
                                                             250
                                                             200
                                                             150

In 2028, 1 adult households are projected to                 100
                                                              50

remain the most common (41.8%) in the Outer                    0

Hebrides and 1 adult plus one or more children
                                                                                               1 adult male 2018                              1 adult male projected 2028
is projected to remain the least common (4.3%).                                                1 adult female 2018                            1 adult female projected 2028

In addition, between 2018 and 2028 the 50-54
year age group will see the largest percentage
decrease (-24.1%) and the 90 & over age group               The chart below shows the projected change
is projected to have the largest increase (+41%)            in household type between 2018 and 2028.
in the Outer Hebrides.                                      As shown the projected increases are in the 1
In 2028, the largest age group is projected to              and 2 adult households while decreases are
be the 75-79 age group, in comparison to the                projected in larger households with the largest
50-54 age group in 2018, highlighting the ageing            decrease (-15%) in the 2+ adults plus child(ren)
population.                                                 households.
           Average household size continues on
           a downward trend. From 2018-2028
                                                                                        Projected number of households in Outer Hebrides by household type, 2018 and 2028

                                                                                    6,000

           it will decrease by 7% in both Scotland                                                          Small increases projected in
                                                                                                                                                                                 2018
                                                                                                                                                                                 2028

           and the Outer Hebrides. However,
                                                                                    5,000
                                                                                                  + 2%     households containing one or
                                                             Number of households

                                                                                                                     two adults

           from 1998 to 2028 it will decrease by
                                                                                    4,000
                                                                                                                    + 1%

           15% in the Outer Hebrides and 10% in
                                                                                    3,000                                                                Numbers of larger households
                                                                                                                                                            are projected to fall

           Scotland. By 2027 it is projected to fall
                                                                                    2,000
                                                                                                                                                             - 15%

           below 2.0 in the Outer Hebrides.                                         1,000

                                                                                                                                           - 8%
                                                                                                                                                                                - 8%

                                                                                       0
                                                                                               1 adult          2 adults      1 adult with children   2+ adults with       3+ adults

  Year          Outer Hebrides         Scotland
                                                                                                                                                         children
                                                                                                                            Type of household

   1998              2.35                2.31
   2008              2.19                2.18               Between 2018 and 2028 increases in households
   2018              2.07                2.15               are projected in all but 4 council areas; Outer
                                                            Hebrides, Argyll & Bute, Inverclyde and North
   2028              1.99                2.08
                                                            Ayrshire.
   2043              1.93                2.00

                                                   Page 2
Socio Economic Update No. 43

Small Area Population Estimates                                                           Total % Change
                                                                                           pop. 2011 to
National Records of Scotland published          Data zone                                 2019       2019
Small Area Population Estimates (SAPES) for
                                                Eriskay to South Boisdale                   466      -12.2
mid-2019 in August 2020.
                                                Newton to Plasterfield                      743      -11.8
Scotland’s 32 Council areas are made up of
                                                Galson to Swainbost                         572      -11.7
6,976 data zones. There are 36 data zones
in the Outer Hebrides. Most data zones          Loch Roag                                   441      -11.1
contain between 500 and 1,000 people.           Habost to Port of Ness                      712       -9.8
                                                Uig and Bernera                             715       -8.3
Over the last decade 2009 to 2019
population decline has mainly occurred in       North Manor Park                            610       -7.9
island and rural council areas, and some in     Goathill                                    804       -7.8
the West of Scotland. However, cities tend      Coulegrain to Stenish                       609       -7.7
to experience increases.                        Loch Eynort to Iochdar                      697       -6.6
The data zone with the highest population       Knock to Bayble                             791       -6.2
in Scotland is Currie West in Edinburgh         Loch Boisdale                               591       -5.4
with 3,784 people, as it contains student
                                                Sheshader to Tiumpan Head                   575       -5.4
accommodation.
                                                North Bayhead (Stornoway)                   618       -5.2
Over the period 2009 to 2019 the Outer          Barvas to Borve                             716       -4.9
Hebrides experienced the largest average
                                                Pairc and Kinloch                           881       -4.8
change in median age in Scotland at 4.1
years while Dundee City had the lowest at       Carloway to Shawbost                        595       -4.8
-0.1 years.                                     Central Stornoway                           836       -4.8
Over this period 94% (34 data zones)            South Harris                                870       -4.7
became older in terms of median age .           West North Uist to Baleshare                690       -4.6
In contrast, 44% in Dundee City became          Bragar to Brue                              701       -3.8
younger.                                        North Benbecula                             787       -3.6
Ruchill in Glasgow has the lowest median        Grimsay, East North Uist to Berneray        872       -3.5
age of 20 years, as it contains student         Coll to Back                                908       -2.7
accommodation for Glasgow University.           North Harris and Scalpay                    957       -2.5
Over the period 2009-2019, 11 data zones        Marybank to Newvalley                     1058        -2.1
(31%) in the Outer Hebrides experienced         Springfield                                 606       -1.8
an increase while 25 data zones (69%)
                                                Garrabost                                   789       -1.6
experienced a decrease in population.
                                                Vatersay to Castlebay                       621       -0.5
Over the last year from 2018 to 2019, the
                                                Tong to Upper Coll                        1088        -0.2
3 data zones with the highest estimated
percentage population increase were:            North Barra                                 660        0.6
                                                South Benbecula                             527        1.9
  •   Melbost to Braighe         +5.2% (51)
                                                Gress to Tolsta                             727        2.0
  •   Eriskay to South Boisdale +3.3% (15)      North Lochs                                 914        3.9
  •   Newmarket                  +2.7% (25)     Newmarket                                   936        4.0
The 3 data zones with the highest estimated     Melbost to Braighe                        1037        18.5
population increase over the year 2018 to       The table above highlights the difference in population
2019 were:                                      change in different data zones. While Melbost to
  •   North Manor Park          -5.7% (-37)     Braighe has increased by 162 (18.5%) mainly due to
                                                increased affordable housing development, Eriskay to
  •   Central Stornoway        -4.5% (-39)      South Boisdale has decreased by 65(12.2%). It also
  •   Springfield               -2.7% (-17)     highlights the difference in size, with Loch Roag (441)
                                                the smallest and Tong to Upper Coll (1088) the largest.
                                                Page 3
Socio Economic Update No. 43

Small Area                Data Zone                              Total pop. % under 16 %16-64 % 65+
Population                Vatersay to Castlebay                     621         19       57    23
                          North Barra                               660         19       53    28
Estimates
                          Eriskay to South Boisdale                 466         12       54    33
The adjacent table        Loch Boisdale                             591         16       59    25
shows the broad age
                          Loch Eynort to Iochdar                    697         19       57    24
groups by data zone
for 2019 for each data    South Benbecula                           527         19       58    24
zone.                     North Benbecula                           787         24       60    16
There are large           West North Uist to Baleshare              690         15       55    30
variations within the     Grimsay, East North Uist to Berneray      872         11       59    30
Outer Hebrides, with      South Harris                              870         13       53    34
some data zones           North Harris and Scalpay                  957         14       57    30
having a much older
                          Pairc and Kinloch                         881         15       58    27
profile than others.
                          North Lochs                               914         15       58    27
Uig and Bernera           Uig and Bernera                           715          7       59    33
has the smallest
                          Loch Roag                                 441         12       55    32
percentage under 16,
at 7%, while Melbost      Carloway to Shawbost                      595         12       62    26
to the Braighe, Tong to   Bragar to Brue                            701         14       62    24
Upper Coll and North      Barvas to Borve                           716         15       59    26
Benbecula all have the    Galson to Swainbost                       572         10       57    33
highest at 24%.
                          Habost to Port of Ness                    712         14       54    32
Goathill has the          Gress to Tolsta                           727         16       56    28
smallest working age      Coll to Back                              908         17       61    22
population at 51%,
while Newmarket has       Tong to Upper Coll                       1088         24       58    18
the highest at 67%.       Newmarket                                 936         19       67    14
                          Marybank to Newvalley                    1058         17       63    20
Newmarket has the
smallest 65+ age          North Manor Park                          610         20       63    18
group at 14% while        North Bayhead (Stornoway)                 618         11       63    26
Goathill has the          Central Stornoway                         836         14       60    26
highest at 36%.           Newton to Plasterfield                    743         12       59    29
As such, with the data    Springfield                               606         16       57    27
zone areas varying        Goathill                                  804         14       51    36
so greatly, the island    Coulegrain to Stenish                     609         14       56    30
areas do too.
                          Melbost to Braighe                       1037         24       58    18
The adjacent table        Garrabost                                 789         18       61    21
shows that Barra and
                          Knock to Bayble                           791         16       58    26
Vatersay have the
highest under 16 age      Sheshader to Tiumpan Head                 575         15       55    30
group at 19% (Scot.           Island Area                 % Under 16     % 16-64         % 65+
avg. 17%) and Harris          Barra & Vatersay                19           55             26
have the greatest             South Uist                      16           57             27
65+ age group at
32% (Scot.avg. 19%).          Benbecula                       22           59             19
Benbecula and Lewis           North Uist                      13           57             30
have 59% aged 16-64           Harris                          13           55             32
(Scot.avg. 64%).              Lewis                           16           59             25
                              Outer Hebrides                  16           59             25
                                                 Page 4
Socio Economic Update No. 43

Migration
National Records of Scotland (NRS) produces data on Migration. NRS updated local area migration
data in August 2020. The publication brings together migration-related indicators from different
sources for council areas and health board areas.
The chart below shows the net migration in 5 year age groups for island areas. It clearly shows that
there is significant loss in the 15-19 age group and also 25-29 and 20-24 year age groups for all island
areas. However, the loss has been less than in previous years in the 15-19 year age group in the
OuterHebrides. In 2015-16 the loss was -90. Usually, the Outer Hebrides always has the greatest loss
in this age group, however, this year it is Shetland. Net gain is mainly in 5-14 and 30-64 age groups.
Over the year net gains were as follows: Outer Hebrides +50, Orkney +145 and Shetland -88.

                                               Net migration by 5 year age group in island areas 2018/19
                                                                              47
                                                                                                                                   38
           40                  30                                                        27                     27                            29
                       27
                         19                                                            20             20
                                                                             16                                                     16
           20                 13 14   1414
                                          10                                                                   12
                                                                                                                     7
                                                                                                                         12 10
                   1                                                               2              3                           2                                         3 1           5    2 3                   5   3 3
                                                           1                                  0            1                                       1                                                    2
            0
  Number

                                                                                                                                                         -1                   -2 -4              -1         -1             -4
                                                                        -6
           -20                                           -17          -18                                                               -15        -16
                                                                                                                                                            -12
                                                                                                                                                          -14
                                                                                                                                                                   -8

                                                               -23 -30
           -40
           -60                                   -47
                                               -57

           -80                                     -77

                                                         Outer Hebrides                   Orkney Islands                          Shetland Islands

The chart below shows the migration flows from the Outer Hebrides for the year 2018-2019. The
chart shows that the largest percentage of people moving within Scotland, left to go to Glasgow City
(128 people) while the smallest percentage, not shown, went to Clackmannanshire (1 person). A
larger number (140) went to the rest of the UK, while 60 went overseas. A large number (120) also
went to the Highland council area.
A total of 800 left the Outer Hebrides in 2018-19 while 850 arrived, leaving net migration of +50.
                                                                     Orkney Aberdeen City   Dundee City Argyll&Bute
                                South Ayrshire                                                                      Perth & Kinross
            East Ayrshire                                              2%         5%      Angus 1%          3%
                                      2%                                                                                  2%
                 1%                                                       Falkirk          1% Aberdeenshire                    Dumfries & Galloway
                              East Renfrewshire
                                                                            1%                                                         1%
                                     1%                                                             3%
                  Scottish Borders
                         1%                                                                                                                                                                  North Ayrshire
                                                                                                                                                                                          Fife    1%
                                Rest of UK                                                                                                                                                3%            North
                                   18%
                                                                                                                                                                                                      Lanarkshire
                                                                                                                                                                                                          1%
                                                                                                                                                                  Edinburgh City
                                                                                                                                                                       6%

                 Highland
                   15%

                                                                                                                                               Overseas                                      Moray
                                                                                                                                                 8%                                           3% West
                                                                             Glasgow City
                                                                                 17%                                                                                                             Dunbartonshire
                                                                                                                                                                                                      1%
                                                                                                                                                                                            Renfrewshire
                                                                                                                                                                                                 2%
                                                                                                                                                                                          South Lanarkshire
                                                                                                                                                                                                 2%

                                                         Migration Flow from Outer Hebrides 2018-2019
                                                           (areas with numbers less than 5 excluded)

                                                                                                  Page 5
Socio Economic Update No. 43

Migration
                                                                                 Net migration in Island areas 2009 to 2019
Over the period 2009 to 2019 net
                                                                                                                                             250
migration has varied greatly in all                                 200
                                                                                                                          220
                                                                                                                                  200

island areas. Orkney has had the                                                 160
                                                                                                 110
                                                                                                                                  160              150
                                                                                         100                        100
highest net migration in all but the
                                                                      90                               80
                                                                      70                 60                   70
                                                                                                                                                   50
                                                                                         20                                                  20
first two years and has had positive                                                             10
                                                                                                       -20    -10   -10
                                                                                                                    -40
                                                                                                                          -20

migration every year over this period.                                                           -70
                                                                                                       -90    -90
                                                                                                                          -70                -80   -90
                                                                                                                                  -130
The Outer Hebrides has had positive
net migration since 2016-17, while
Shetland has mainly had negative                                            Outer Hebrides              Orkney Islands          Shetland Islands
migration.
Over the whole period net migration
has been as follows: Outer Hebrides
+310, Orkney +1,530 and Shetland                                            National Insurance Number (NINo) Allocations in the
                                                                                  Outer Hebrides and Scotland 2009 - 2019
-110.
                                                                            90                                                           60,000

                                                    Number of Allocations
                                                                            80

                                                                                                                                                   Number of Allocations
                                                                                                                                         50,000
                                                                            70
                                                                            60                                                           40,000

                                                        (Hundreds)
The number of National Insurance

                                                                                                                                                      (Thousands)
                                                                            50
                                                                                                                                         30,000
Number (NiNO) allocations has                                               40
                                                                            30                                                           20,000
increased in Scotland by 16% from                                           20
                                                                                                                                         10,000
                                                                            10
41,610 in 2009 to 48,190 in 2019. This                                       0                                                           0

is the highest number over the period.
However, in the Outer Hebrides the                                                             Outer Hebrides         SCOTLAND
trend was down in 2019 and the
number remains the same in 2019 as it
was in 2009 at 50. The highest number
was in 2015 with a total of 70.                                                        Number of Births to non-UK mothers in the
                                                                                        Outer Hebrides and Scotland 2009 - 2019

                                                                            30                                                           9,500

Over the decade the highest number                                          25                                                           9,000
                                                     Number of Births

                                                                                                                                                   Number of Births
of births to non-UK mothers, both in

                                                                                                                                                     (Thousands)
                                                                            20
                                                                                                                                         8,500
                                                         (Tens)

the Outer Hebrides and Scotland, was                                        15
                                                                                                                                         8,000
                                                                            10
in 2016. The number of births remains                                                                                                    7,500
                                                                             5
low in the Outer Hebrides with 10                                            0                                                           7,000
births in 2019. Births in Scotland have
been decreasing since 2016 and are                                                               Outer Hebrides       SCOTLAND
continuing to do so.

The number of pupils from minority
                                                                                 Pupils from minority ethnic groups in the
ethnic groups is showing a steady                                                Outer Hebrides and Scotland 2009 - 2019
increase in both the Outer Hebrides                                         80                                                           70,000
                                                                            70
                                                     Number of pupils

and Scotland. Over the decade the                                                                                                        60,000
                                                                                                                                                   Number of Pupils

                                                                            60                                                           50,000
                                                                                                                                                     (Thousands)

percentage of pupils from minority                                          50
                                                         (Tens)

                                                                                                                                         40,000
                                                                            40
ethnic groups has increased by 37%                                          30
                                                                                                                                         30,000

in the Outer Hebrides and by 73% in                                         20                                                           20,000
                                                                            10                                                           10,000
Scotland.                                                                    0                                                           0

                                                                                               Outer Hebrides         SCOTLAND

                                           Page 6
Socio Economic Update No. 43

Life Expectancy
National Records of Scotland published Life
Expectancy 2017-2019 in September 2020.
Life expectancy in Scotland is the lowest in                                          Life expectancy for women is highest
the UK and Scotland also has the lowest life                                          in East Renfrewshire at 84 years, and
expectancy in the 16 nations that make up                                             lowest in Glasgow City at 78.5 years.
Western Europe.                                                                       Male life expectancy is highest in East
Deprivation continues to have an impact on life                                       Dunbartonshire at 80.5 years and
expectancy. The gap between the most and                                              lowest in Glasgow City at 73.6 years.
least deprived areas continues, with the gap for                                      The publication does not take into
men being 13.3 years and the gap for women 10                                         account the effects of Covid 19 on
years.                                                                                life expectancy as it covers the years
Life expectancy for men at birth is 77.1 and 81.1                                     2017-19.
for females. Life expectancy at age 65 is 17.7 for                                    Covid 19 was first mentioned on a
men and 19.8 for women.                                                               Scottish death certificate in the week
                                                                                      beginning 16 March 2020.

        What is ‘life expectancy at older ages’?                                      The table below shows the gap in life
                                                                                      expectancy at birth between men
                                                                                      and women in all Council Areas in
        Life expectancy at older ages can be                                          Scotland.
        quite a confusing concept - how can a
                                                                                      The Outer Hebrides continues to have
        man aged 65 expect to live 17.7 years
                                                                                      the highest gap in life expectancy
        when life expectancy at birth is 77.1                                         at birth between men and women,
        years? The best explanation for this is                                       along with Dundee City. The Outer
        that life expectancy is an average                                            Hebrides and Dundee City, have the
        which is affected by people dying at                                          highest gap in Scotland at 5.6 years
        younger ages as well as in old age.                                           (after rounding up).
        While the average number of years                                             People living in rural areas tend to
        a baby boy might live is 77, if he                                            have a higher life expectancy than
                                                                                      those living in urban areas. People
        makes it to 65 without dying, then the
                                                                                      generally live longer and spend more
        average number of years left is 17.7.                                         years in good health in rural areas.
        Source: National Records of Scotland

                           Difference in life expectancy at birth between males and females
                                                       2017-2019
        6.0   5.6 5.6
                        4.9 4.8
        5.0                       4.4 4.4 4.3 4.3 4.2 4.2 4.1 4.1 4.1 4.1
                                                                          4.1 3.9 3.9 3.9 3.9
                                                                                              3.8 3.6 3.6
        4.0                                                                                               3.4 3.3 3.2 3.2 3.1 3.1 3.1
Years

                                                                                                                                      3.1 2.8
        3.0                                                                                                                                     2.3
        2.0
        1.0
        0.0

                                                                         Page 7
Socio Economic Update No. 43

Gross Weekly Pay                                        Characteristics of Hate Crime
Information from the Annual Survey of                   The Scottish Government has published
Hours and Earnings shows the levels of gross            A Study into the Characteristics of Police
weekly pay all over the United Kingdom,                 Recorded Hate Crime in Scotland.
some of which are highlighted in the table              For the purposes of this report, a hate crime is
below.                                                  any crime which is perceived by the victim or
                                                        any other person, to be motivated (wholly or
                                                        partly) by malice and ill-will towards a social
                                                        group.
    Earnings by residence 2020
                                                        The police recorded 6,448 hate crimes in 2019-
         Gross weekly pay                               2020. The number of hate crimes recorded by
       All full time workers                            Police Scotland per 10,000 of the population
                              £                         was highest in Glasgow City and the City of
                                                        Edinburgh local authority areas (25 and 23
 Outer Hebrides                      562.00             crimes per 10,000 population respectively).
 Orkney                              572.20             The Shetland Islands and Orkney Islands had
 Great Britain                       587.10             the lowest rates.
 Scotland                            595.00             In over half of crimes (58%), the victim did not
                                                        know the perpetrator, whilst in a further 30% of
 Shetland                            655.00
                                                        cases, the perpetrator was an acquaintance of
                                                        the victim.
                 Source: NOMIS                          Around a third of hate crime in Scotland
                                                        involved a victim who experienced the incident
                                                        at their place of work or whilst undertaking
                                                        duties as part of their occupation. Most
Gross weekly pay in the Outer Hebrides has
                                                        of these victims were working in retail or
increased by 8.5% since last year. Although
                                                        other service industries. Almost two-thirds
pay has increased, the Outer Hebrides
                                                        of hate crime victims and three quarters of
has the 8th lowest pay in Council Areas in
                                                        perpetrators were male. In around half of
Scotland.
                                                        crimes the victim did not know the perpetrator,
East Renfrewshire has the highest pay in                with more than a third involving a perpetrator
Scotland at £815.20, (45% higher than the               who was an acquaintance of the victim.
Outer Hebrides pay), while Dumfries and
Galloway has the lowest at £517.50 (8%
lower than the Outer Hebrides pay).                           2019-20 Hate Crimes Recorded
Pay in Orkney has decreased over the year                 •    Outer Hebrides               14
by 4%, while the Great Britain pay remains
                                                          •    Orkney                        2
the same. Pay in Scotland has increased by
3%, while pay in Shetland has increased by                •    Shetland                      1
almost 10% and is now the 3rd highest in
Scotland.
                                                        There was a large increase in hate crimes
Pay in the Orkney Islands is now 1.8% higher            recorded in the Outer Hebrides over the year
than that of the Outer Hebrides, while pay              from 4 crimes recorded in 2018-19.
in the Shetland Islands is now 16.5% higher
                                                        This has also resulted in the rate per 10,000
than that of the Outer Hebrides. The average
                                                        crimes increasing from 1 to 5 in the Outer
pay in Scotland is now 5.9% higher than pay
                                                        Hebrides. The rate in the Orkney Islands
in the Outer Hebrides.
                                                        remains at 1 and is 0 in the Shetland Islands.

                                               Page 8
Socio Economic Update No. 43

 Covid Local Economic Impact
 The Improvement Service has produced a tool which summarises the data available relating to the
 current economic impact of Covid 19. This information is available at Local Authority level, giving
 details of the current uptake in Council Areas of government support available.
 Information is available on the following:
   •   The Coronovarius Job Retention Scheme - Employments Furloughed
   •   The Self-Employment Income Support Scheme (SEISS) - Third Grant
   •   Unemployment benefit claims
   •   The COVID Strategic Framework Business Fund
 On the whole, Covid appears to have had less of an impact on island areas than the rest of Scotland,
 when using these measures.
 The island areas, along with Aberdeenshire, East Dunbartonshire and East Renfrewshire, have
 suffered less impact while Covid appears to have had the largest impact on Highland Council.

Information below is for all island areas and Scotland, as at January and February 2021.
                                                   Outer
Measure                                            Hebrides      Orkney       Shetland      Scotland

Total Furloughed (Feb)                             1,400         900          1,000         364,100
Rate per 100 aged 16-64                            9.0           6.7          7.1           10.4

Unemployment Benefit Claimant Count (Feb)          775           375          465           213,325
Claimants per pop. aged 16-64                      5             2.8          3.3           6.1

Total Self-Employment Support Scheme -             700           700          400           131,000
Third Grant Claim (SEISS) (Jan)
SEISS Claims per 100 potentially eligible pop.     55            40           47            64

Total Covid Strategic Framework Business           375           36           214           43,218
Fund Grants Awarded (Feb)

Business Grants per 100 Small or Micro             25.4          2.1          11.9          20
Businesses

The measures above show that for most measures the Orkney and Shetland Islands tend to have
the lowest rates in Scotland and the Outer Hebrides tends to have the 4th or 5th lowest. The only
exception to this is in Business Grants per 100 Small or Micro Businesses where the Outer Hebrides
had the 7th highest rate in Scotland.
With reference to Unemployment Benefit Claimant Count the following percentage increases have
occurred between January 2020 and February 2021:
Outer Hebrides: 84.5% increase; Orkney: 97.4% increase; Shetland 102.2% increase. All measures
for all the areas have increased since December 2020.

                                                 Page 9
Socio Economic Update No. 43

Scottish Sea Fisheries Statistics                                                           Quantity and Value of all landings in the Outer
                                                                                                       Hebrides 2015 to 2019
2019                                                                               6000                                                                                    20000

The Scottish Sea Fisheries Statistics 2019                                         5000

                                                               Quantity (tonnes)
                                                                                                                                                                           15000

                                                                                                                                                                                      Value (£'000)
                                                                                   4000
were published in September 2020.
                                                                                   3000                                                                                    10000
Mackerel remained the most valuable species                                        2000
                                                                                                                                                                           5000
landed by the Scottish fleet, representing 27                                      1000

per cent of the value of all Scottish vessels’                                          0                                                                                  0
                                                                                                  2015           2016          2017                2018         2019
landings. Nephrops is the second most
                                                                                                                           Quantity                Value
valuable species, with 15 per cent of the total
value. Haddock became the most valuable
demersal species overtaking cod with
monkfish third.
Together, haddock, cod and monkfish account                                                 Number of vessels in Island areas
for 20 per cent of the value of Scottish                                                            2015 to 2019
                                                                  250                                                                                                    219 221
vessels’ landings.                                                                      210
                                                                                              184
                                                                                                               208
                                                                                                                     188
                                                                                                                                     209 201           214 215
                                                                  200
The quantity of landings in the Outer                             150                               132                    131                 128               128               127
Hebrides W has decreased over the 5 year                          100
period by 4.2%. However, the value of the                               50
landings has increased by 57.1%.                                             0
                                                                                             2015                2016                   2017               2018                2019
The number of vessels in the Outer Hebrides
                                                                                                     O Hebrides                       Shetland              Orkney
has increased by 4.3% over the 5 year
period, while the numbers in Shetland have
increased by 20%. Vessel numbers in Orkney
have decreased by 3.8%.
                                                                                            Number of fishermen employed in the
Fraserburgh is the district with the highest
                                                                                               Outer Hebrides 2015 to 2019
number of vessels with 223 vessels (11 per                                                                                                                               376
                                                                               400          360
cent of the Scottish fleet) . This was closely                                                                  337
                                                                                                                                     318               303
                                                                                              290
followed by Shetland (221) and Stornoway                                       300                                   262                268               256              258
                                                           Number

(219) districts.                                                               200
                                                                                                                                                                                 92
Fraserburgh is the district with the largest                                   100                  53                     58                 48                42
number of fishers (797) accounting for 16 per                                       0
                                                                                                          17                    17                 2                 5                    26

cent of the total in 2019. It is also the district                                                2015                2016              2017               2018                2019
with the largest number of fishers who                                                            Total           Regular                Irregular              Crofters
work regularly, with 788 regularly employed
fishers. Shetland had the most irregular
fishers (254), accounting for 28 per cent of
                                                                  Employment in Fishing as proportion of
the total fishers in this category. Stornoway
                                                                   total employed in Scotland - the three
was the district with the largest number of
                                                               island areas have the highest proportions in
crofters employed (26), accounting for 67 per
                                                                                Scotland.
cent of the total fishers in this category.
The number of fishers in the Outer Hebrides
has increased by 4.4% over the 5 year period,                                                                               Outer                                 Shetland
rising from 360 to 376.                                                            Orkney                                  Hebrides
                                                                                   2.38%                                                                           4.21%
                                                                                                                            2.79%

                                                     Page 10
Socio Economic Update No. 43

ScotlandsPeople
Scotland’s People have recently added
Kirk sessions to their web page. Images
of more than a million pages from the kirk
sessions and other court records of the
Church of Scotland, containing details of key
events in communities across the country
between 1559 and 1900, have been added
to ScotlandsPeople, NRS’s online research
service.
These records offer remarkable insights
into the everyday lives of ordinary Scots,
recording important moments such as births,
marriages and deaths.
                                                           If you have any queries or suggestions
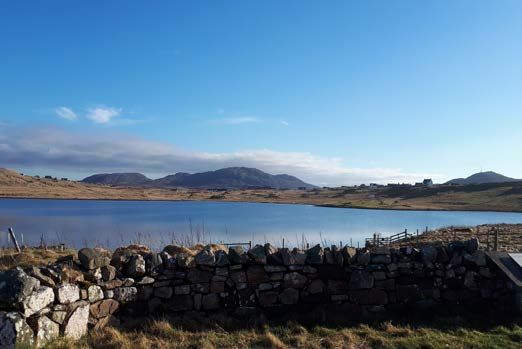
Global Grasshopper – an award winning blog                     regarding this bulletin please contact:
and resource for independent travellers has
recommended the top 10 most beautiful
places to visit in the Outer Hebrides.                           Kathleen Shirkie, Research Officer,
Unsurprisingly, beaches in the Outer Hebrides                Communities Department, Comhairle nan
continue to get recognised as being the most               Eilean Siar, Sandwick Road, Stornoway, Isle of
beautiful, continuing to get listed as some of                             Lewis, HS1 2BW
the best, both UK and European wide.                                  kshirkie@cne-siar.gov.uk
The latest is Lonely Planet, a leading travel
guide. Listed in the top 20 best beaches
                                                           This e-bulletin is also available (along with past
in Europe by Lonely Planet, was the West
                                                           issues) on the Comhairle’s internet/intranet in
Beach in Berneray. West Beach was the only
                                                                      the ‘Fact File’, click below.
Scottish entry.
Lonely Planet also listed the 11 most
beautiful beaches in the UK to visit. Listed
here are Luskentyre and Traigh Mhor, Barra.

                                                                            FACTFILE
 Top Girl’s and Boy’s Names 2020
    Scotland             Outer Hebrides
      Jack             Alexander, Lachlan
       Isla                  Freya

                                                 Page 11
You can also read