HSC COVID-19 WORKFORCE WELLBEING AND COPING STUDY PHASE 2 RESULTS - DR PAULA MCFADDEN AND DR JOHN MORIARTY - NISCC
←
→
Page content transcription
If your browser does not render page correctly, please read the page content below

HSC COVID-19 Workforce Wellbeing
 and Coping Study Phase 2 results

      Dr Paula McFadden and
          Dr John Moriarty
Health and Social Care Workers’
Quality of Working Life and Coping
while Working during the Covid-19
Pandemic:
May-July 2020 Key Findings PLUS
Emerging findings from
November – end of January 2021.
Dr Paula McFadden    Dr Jermaine Ravalier
Dr Patricia Gillen   Professor Jill
Dr John Moriarty     Manthorpe
Dr John Mallett      Dr Jaclyn Harron
Dr Heike Schroder    Dr Denise Currie
Background and Methods

• Aim: To examine the impact of providing health and social
  care in UK during COVID-19 on nurses, midwives, allied
  health professionals (AHPs), social care workers and social
  workers.
• Data collection: Anonymous online questionnaire (May –
  July 2020 and November – end of January 2021)
• Measures:
   • Demographics
   • Short Warwick Edinburgh Mental Wellbeing Scale (SWEMWBS)
   • Work-Related Quality of Life (WRQOL)
   • Brief COPE
   • Items from Clark et al.’s Coping with Work and Family Stressors
     Scale
   • Qualitative open-ended questions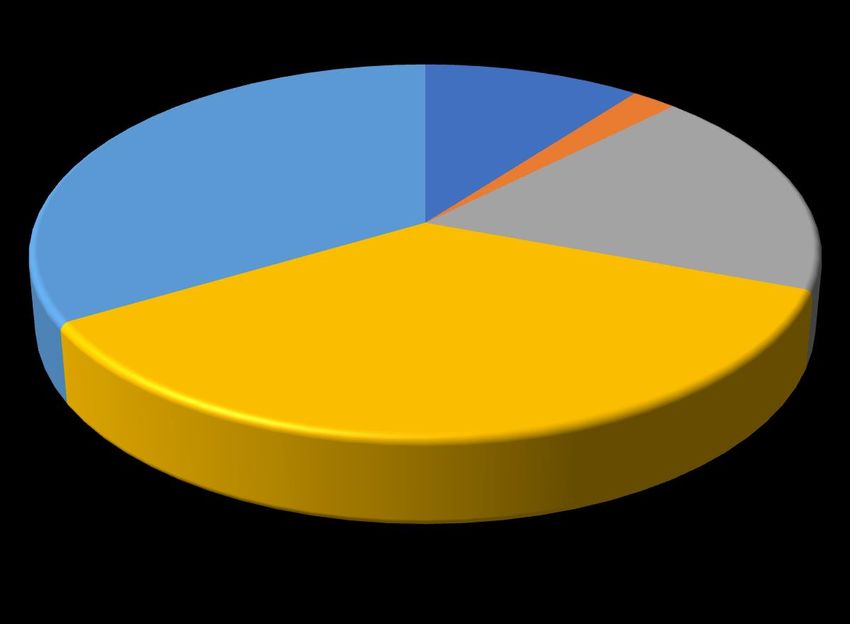
Demographics May – July 2020

                             Occupational Groups
• N = 3,290
• Mostly Female (86.8%)
• Age 30-59 (78.7%)
• Band 6 pay band
  (25.6%)
• Most worked in the
  Community (55.0%)
• Most worked with
  older people/other
  adults (43.1%)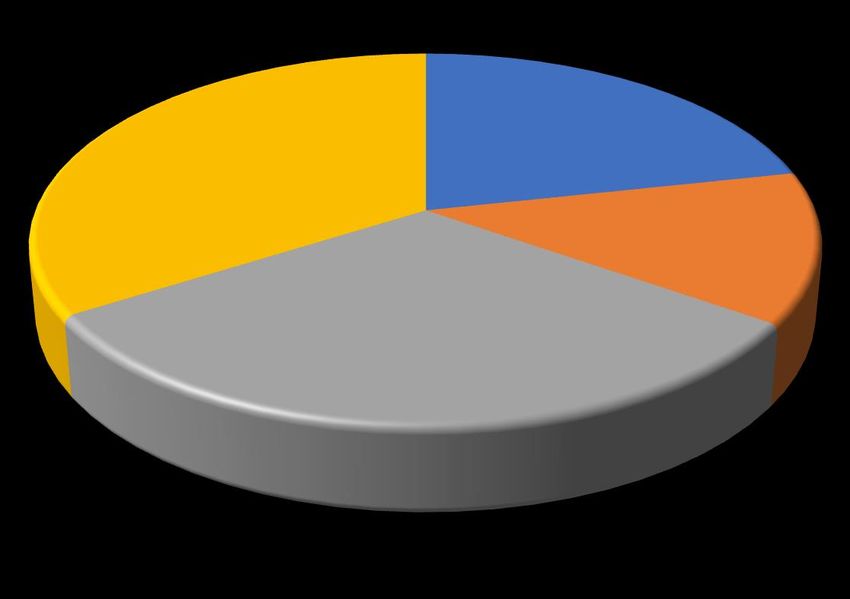
Demographics November – End of January 2021

• N = 3499
• Mostly Female (87.8%)                             Health and social care sector by Country
                                             100%
• Age 30-59 (78.9%)
                                             80%
• Band 6 pay band (32.9% of
  those working in NHS/HSCT)
                                Percentage
                                             60%

• Most worked in the                         40%

  Community (52.1%)                          20%

• Majority were Statutory
                                              0%
  employees at both data                                Statutory          Private     Voluntary and not      Other
  collection points (76.0% in                                                              for profit
                                                                         Health and social care sector
  Phase 2)
                                                    UK-Wide    England      Scotland    Wales     Northern Ireland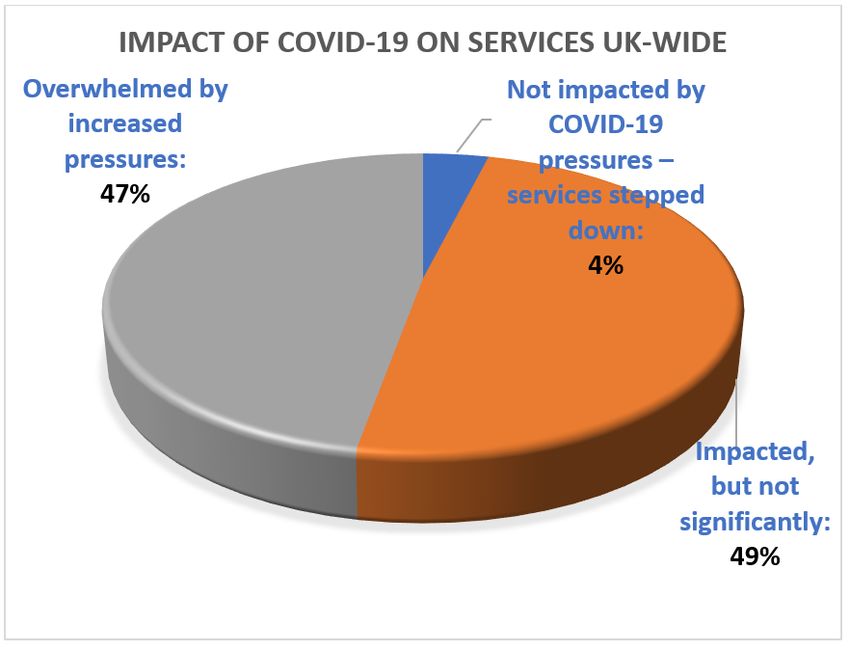
Number of responses per country
     and occupational group: Nov - Jan 2021
                        No. of responses per country and occupational group

Northern Ireland         214       64          311               263                 337

          Wales    501     186                      517                       341

       Scotland 165 27            340          71

        England        81 5 114      133              423

                   0           200           400          600          800          1000     1200   1400
                        Nursing         Midwifery     AHP       Social care    Social work
Number of responses per country /
             region:
              Nov - Jan 2021

        NUMBER OF RESPONSES PER COUNTRY

                            [CATEGOR
                            Y NAME]:
          [CATEGOR           [VALUE]
          Y NAME]:                 [CATEGOR
           [VALUE]                 Y NAME]:
                                    [VALUE]
                 [CATEGOR
                 Y NAME]:
                  [VALUE]
Number of responses per
  occupational group:
           Nov - Jan 2021
 NUMBER OF RESPONSES PER OCCUPATIONAL GROUP

                      [CATEGOR
                      Y NAME]:
                             [CATEGOR
   [CATEGOR            [VALUE]Y NAME]:
   Y NAME]:                        [CATEGOR
                               [VALUE]
                                   Y NAME]:
    [VALUE]
                                   [VALUE]

                  [CATEGOR
                  Y NAME]:
                   [VALUE]
Explain the impact – three groups

 Groups
 identified from
 May-July data

 Asked people to
 self identify
 across the three
 groups

Although it has been a very                It has been
stressful work environment                 emotionally
situation it has been rewarding to         demanding being
be needed and to finally be                on the frontline of
recognised and appreciated for             the emotional
the hard word being put in that's          impact of
usually unnoticed every day.               lockdown. Social
SOCIAL CARE WORKER Ni
                                           worker –
                                           Community and
                                           Voluntary Sector -
                  “My job has also         Family Support
                  improved my mental       Scottish
                  health. I wouldn't
                  cope well with the
                  worry of Covid 19 if I
                  didn't have my job.”
                  Social Care worker -
                  Community Wales
Ways of Coping: May-July 2020 vs. Dec- Jan 2021 At both time points: • Active coping, planning, positive reframing and acceptance were the most frequently used coping strategies
Further analyses: Dec-Jan 2021

       Positive coping strategies (e.g., active coping, positive reframing,
       acceptance, exercise) were associated with higher mental
       wellbeing, better quality of working life and lower burnout scores

       Negative coping strategies (e.g., venting, substance use, self-
       blame) were associated with lower mental wellbeing, worse
       quality of working life and higher burnout scores
Mental Wellbeing: May-July 2020 vs. Dec-
Jan 2021
Short Warwick
Edinburgh Mental
Wellbeing Scale
1 = None of the time
2 = Rarely
3 = Some of the time
4 = Often
5 = All of the time
Total score range: 7 – 35
Higher scores indicate
better wellbeing
Mean overall wellbeing score in the full sample:
May - July 2020: M = 21.34 (SD = 3.59)
Dec - Jan 2021: M = 20.44 (SD = 3.42)Mental wellbeing scores by the Impact of the pandemic on services: Nov – Jan 2021
Mental wellbeing scores by Line manager status:
Nov – Jan 2021
Quality of Working Life: May-July 2020
vs. Dec-Jan 2021
                                                            Work-Related
                                                            Quality of Life
                                                               Scale

                                                           1 = Strongly disagree
                                                                2 = Disagree
                                                                3 = Neutral
                                                                 4 = Agree
                                                            5 = Strongly agree

                                                          Total score range: 23 –
                                                                    115

                                                          Higher scores indicate
                                                         better quality of working
                                                                    life

Mean overall Work-Related Quality of Life score in the
full sample:
          May-July 2020:   M = 77.98 (SD = 15.38)
          Dec-Jan 2021:    M = 75.59 (SD = 15.57)
Burnout by Occupational group:
Nov – Jan 2021
Burnout scores by occupation
70
62.11 60.98
59.09 60.76 59.18 58.93 58.38
60 57.02
52.06 53.55
50
40
Mean
30.19
30 25.85 25.73 24.51 25.19
20
10
0
Personal burnout Work-related burnout Client-related burnout
Area of burnout
Nursing Midwifery Allied Health Professional Social Care Worker Social WorkerBurnout by the Effects of the
pandemic on services:
Nov – Jan 2021
Burnout scores by Effect of pandemic on services
70 66.61 64.72
60 53.73
48.51 47.82
50 42.64
40
Mean
30.01
30 23.98 24.03
20
10
0
Personal burnout Work-related burnout Client-related burnout
Area of burnout
Not impacted by COVID-19 pressures – services stepped down
Impacted, but not significantly
Overwhelmed by increased pressuresSome Good Practice Recommendations • Employers are recommended to offer flexibility around working hours and location - including working from home • Clear and relevant communication needed • Some staff keen for more involvement in decision- making and autonomy • Connection with colleagues and managers • Visibility of management, either in person or virtually • Staff altruistic concerns for patient wellbeing • Staff wellbeing focus, now and planned into the coming months, years
Some Good Practice Recommendations

• Skills training and preparation for redeployment
• Working from home – connectivity, fairness, rules
• General health and safety at work – social
  distancing, handwashing, sanitisers
• Statutory Sick Pay – deploying agency staff or
  temporary staff Terms and Conditions
• Wellbeing and taking leave – supporting breaks and
  work life balance
Acknowledgements & Disclaimer

     The research team would like to thank all
   participants who contributed to this research.
 This research is funded by the National Institute for Health
 Research (NIHR) Policy Research Programme, through the
Policy Research Unit in Health and Social Care Workforce, PR-
   PRU-1217-21202. The views expressed are those of the
     authors and not necessarily those of the NIHR or the
            Department of Health and Social Care
Thank you for this opportunity to share our research
findings
www.hscworkforcestudy.co.uk
p.mcfadden@ulster.ac.uk@NISocialCareCouncil @NI_SCC @ni_scc
You can also read