Human and mouse non-targeted metabolomics identify 1,5-anhydroglucitol as SGLT2-dependent glycemic marker
←
→
Page content transcription
If your browser does not render page correctly, please read the page content below
Received: 22 March 2021     Revised: 2 June 2021     Accepted: 7 June 2021     Published online: 25 June 2021

DOI: 10.1002/ctm2.470

LETTER TO EDITOR

Human and mouse non-targeted metabolomics identify
1,5-anhydroglucitol as SGLT2-dependent glycemic marker

Dear Editor,                                                                           nitine metabolism, and 3-hydroxy fatty acid metabolism
Metabolomics provide a powerful tool in the search                                     were altered in diabetes versus non-diabetes (Tables S3 and
for biomarkers and pathways related to a disease or in                                 S4). In both data sets, our non-targeted approach found
response to a drug therapy. Metabolites are appealing                                  monosaccharide 1,5-AG to be reduced by the diabetic phe-
biomarkers in metabolic diseases, because a defective,                                 notype (Figure 1C,D).
disease-related pathway may lead to accumulation or defi-                                 Consistent with 1,5-AG being reduced in the diabetic
ciency of certain metabolites. In this study, we combined                              stratum in mice and men (Figure 2A), we found a
three different non-targeted serum metabolomics datasets                               strong negative correlation between 1,5-AG and serum glu-
in human and mice to explore pathways and biomarkers                                   cose (Figure 2B). ROC analysis and multivariate regres-
related to diabetes. In a comparative analysis between mice                            sion analysis identified 1.5-AG as strong, independent
and men, we discovered metabolites related to a diabetic                               biomarker for diabetes (Figure 2C; Table S5).
phenotype. We next assessed those biomarkers in another                                   To confirm these results, we investigated another
cohort of patients with type 2 diabetes (T2D). In mice and                             metabolomics dataset of the empagliflozin registry.
humans including a placebo-controlled trial, we report the                             Patients were grouped in tertiles on basis of their base-
impact of sodium glucose cotransporter (SGLT) 2 inhibitor                              line glycemic control in respect to glycated hemoglobin
empagliflozin on previously identified glycemic marker                                 (HbA1c) (Figure 3A; Table S2). According to our previous
1,5-anhydroglucitol (1,5-AG).                                                          findings, we identified 3-hydroxy fatty acids as well as
   Full methods are described in detail in the Support-                                acylcarnitines to be positively correlated with glycemic
ing Information. Db/Db mice and Db/+ control mice                                      markers (Figure 3B). 1,5-AG was identified as the only
were fed a high-fat diet ± empagliflozin.1 Two prospective                             metabolite among the top 25 metabolites with negative
cohorts for non-targeted metabolomics were recruited: (1)                              correlation to HbA1c and glucose (Figure 3B; Figure S3,
37 patients with and without T2D hospitalized for myocar-                              Tables S6 and S7). Using multivariate regression analysis
dial infarction (MI) (Table S1, Figure S1) and (2) 25 patients                         the correlation between HbA1c and 1,5-AG remained
with T2D included in an empagliflozin registry (Table S2,                              significant (Table S8). We have previously reported
Figure S2).2 A targeted analysis of 1,5-AG was performed                               the impact of empagliflozin treatment on the serum
in a placebo‑controlled, randomized, double blind human                                metabolomics profile.2 Unexpectedly, although patients
trial with empagliflozin (n = 42).3                                                    showed better glycemic control under empagliflozin
   We first explored serum metabolomics data of the                                    treatment, levels of 1,5-AG were largely diminished (Fig-
MI cohort and Db/Db versus Db/+ mice (Figure 1A,B;                                     ure 3C,D). At baseline, before empagliflozin treatment,
Table S3 and Table S4). Considering the top 10 most sig-                               1,5-AG did well differentiate between good glycemic con-
nificant metabolites by P-value, both data sets showed                                 trol (HbA1c < 60 mmol/mol) and poor glycemic control
a clear separation of diabetes versus non-diabetes (Fig-                               (> 60 mmol/mol; Figure 3E). However, this differentia-
ure 1C,D; Tables S3 and S4). Metabolites associated to                                 tion by 1,5-AG was lost during empagliflozin treatment
branched-chain amino acid (BCAA), glutathione, acylcar-                                attributable to very low levels of 1,5-AG observed in all
                                                                                       three groups – which proved independency of HbA1c
                                                                                       (Figure 3E). Consequently 1,5-AG only correlated with
Abbreviations: 1,5-AG, 1,5-anhydroglucitol; AUC, area under the
curve; BCAA, branched-chain amino acid; EMPA, empagliflozin
                                                                                       HbA1c and serum glucose at baseline but not under
treatment; HbA1c, glycated hemoglobin; MI, myocardial infarction;                      conditions of empagliflozin (Figure 3F,G). We next asked
ROC, receiver operating characteristic; SGLT, sodium-glucose                           whether a similar decline of 1,5-AG levels does also
cotransporter                                                                          occur in response to SGLT2 inhibition in diabetic mice
This is an open access article under the terms of the Creative Commons Attribution License, which permits use, distribution and reproduction in any medium, provided the
original work is properly cited.
© 2021 The Authors. Clinical and Translational Medicine published by John Wiley & Sons Australia, Ltd on behalf of Shanghai Institute of Clinical Bioinformatics

Clin. Transl. Med. 2021;11:e470.                                                                                        wileyonlinelibrary.com/journal/ctm2       1 of 8
https://doi.org/10.1002/ctm2.470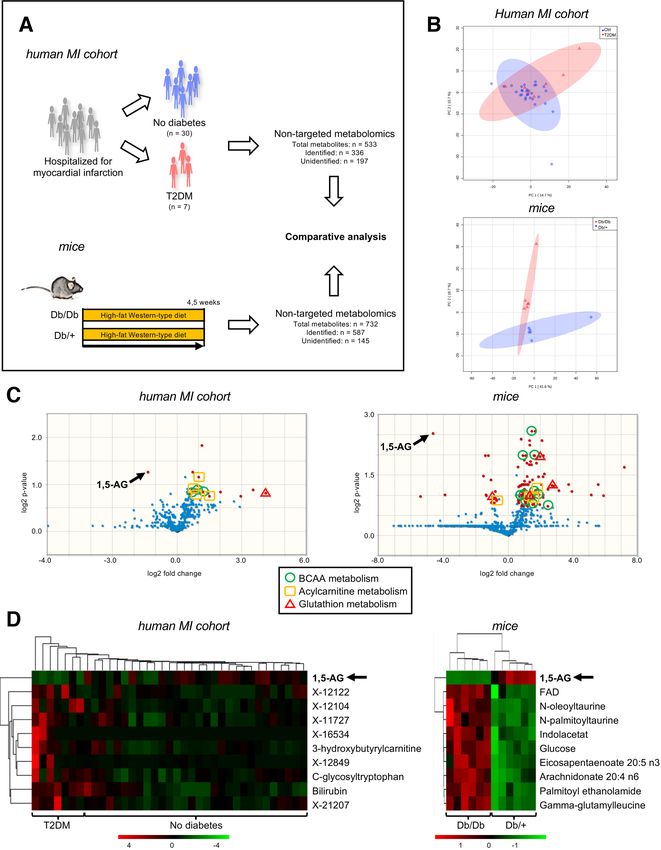
2 of 8                                                                                                             LETTER TO EDITOR

F I G U R E 1 Serum metabolomics reveal biomarkers for diabetes in human and mice. (A) Comparative analysis of non-targeted serum
metabolomics from human and mice ± diabetes. Human myocardial infarction (MI) cohort: Patients hospitalized for MI (n = 37). Mice:
LETTER TO EDITOR 3 of 8
treatment (Figure 4C,D). These results confirm SGLT2
inhibition to reduce 1,5-AG levels, possibly by increasing
its urinary excretion in mice and men.
In this manuscript, we used three different metabolomic
data sets to study biomarkers and substrate utilization
in relation to diabetes and glycemic control. Compar-
ing human and mouse metabolomics, we found BCAA,
glutathione and acylcarnitine metabolism as well as 3-
hydroxy fatty acids to be increased in humans and mice
with diabetes (discussed in the Supporting Information).
In addition, 1,5-AG, a metabolite that has earlier been rec-
ognized as glycemic marker,4,5 was found to be downregu-
lated in an diabetic environment while further reduced by
SGLT2 inhibition.
1,5-AG is structurally similar to glucose and has been
recognized as short- to mid-term marker of glycemic
control in several studies.4,5 In this comprehensive,
unbiased metabolomics approach, 1,5-AG proved as
the most reliable predictor for poor glycemic control.
Circulating 1,5-AG is mainly derived from food, little
metabolized and excreted unaltered to the urine. Under
normoglycemic conditions, 1,5-AG is subjected to renal
filtration and complete re-absorption in the proximal
tubules. Under hyperglycemic conditions with glucosuria,
glucose competitively inhibits the re-absorption of 1,5-AG
with concomitant urinary excretion resulting in decreased
1,5-AG serum levels.6 Yamanouchi et al. found that 1,5-AG
competitively inhibited re-absorption of fructose and
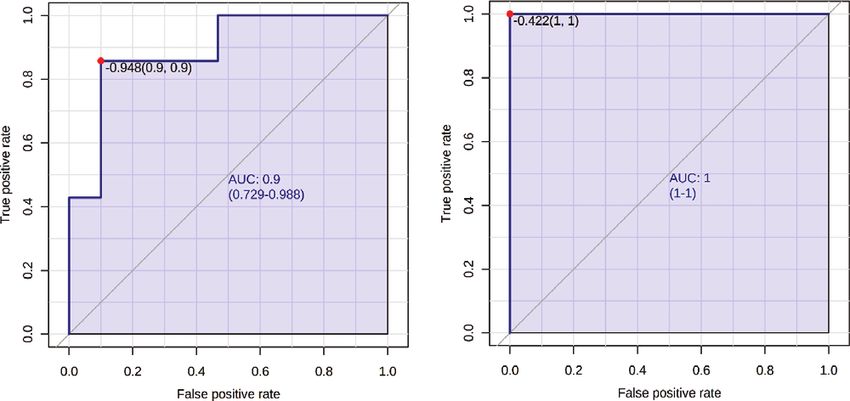
F I G U R E 2 1,5-Anhydroglucitol is a biomarker for diabetes in mannose.7 Therefore, re-absorption of 1,5-AG in the
human and mice. (A) 1,5-Anhydroglucitol (1,5-AG) is reduced in kidney must be facilitated by a transporter specific for
patients and mice with diabetes. ***P < 0.001 by two-sided t-test. these sugars and glucose. Tazawa et al. suggested SGLT4
(B) 1,5-AG correlates with serum glucose in human (right) and mice to be the main transporter for 1,5-AG.8 We discovered
(left). Pearson correlation: r2 . **P < 0.01. (C) ROC curves to evaluate SGLT2 inhibition to reduce 1,5-AG levels possibly by
1,5-AG as biomarker for diabetes (human (right) and mice (left)). increasing urinary glucose excretion. Our data suggest
AUC with 95% confidence interval that the highly selective SGLT2 inhibitor empagliflozin
(>3500-fold selectivity for SGLT2 over SGLT4) strongly
(Figure 3H). We found already low 1,5-AG levels in the diminishes serum levels of 1,5-AG, likewise in humans
diabetic environment to be further reduced in response to and mice. Therefore, our data indicate strong relevance of
SGLT2 inhibition (Figure 3I,J). SGLT2 for 1,5-AG reabsorption. A decrease of 1,5-AG has
In a placebo‑controlled, randomized, double blind also been observed after treatment with SGLT2 inhibitor
human trial (Figure 4A),3 1,5-AG was significantly reduced canagliflozin.9 Wortman et al treated nondiabetic patients
by empagliflozin treatment , but not by placebo (Fig- suffering from glycogen storage disease type Ib with
ure 4B). While at baseline (before empagliflozin), 1,5-AG empagliflozin. Empagliflozin reduced levels of 1,5-AG and
showed a strong correlation to HbA1c and serum glucose, prevented formation of 1,5-AG-6-phosphate, which has
these correlations lost under conditions of empagliflozin been suspected to cause neutropenia in these patients.10
diabetic (Db/Db) versus non-diabetic mice (+/Db)(n = 6 per group). T2D: Type 2 diabetes mellitus. (B) Principal component analyses of
metabolomics from human (upper) and mice (lower). (C) Volcano plots of human MI cohort serum metabolomics (left) and mice serum
metabolomics (right). Red dots indicate metabolites with fold-changes over 1.5 and significant P-values by two-sided t-test corrected for
multiple testing by false discovery rate (FDR < 0.3). 1,5-AG: 1,5-anhydroglucitol. BCAA: branched-chain amino acid. (D) Top 10 metabolites
by two-sided t-test corrected for multiple testing by false discovery rate (FDR < 0.3) of human MI cohort serum metabolomics (left) and mice
serum metabolomics (right). X-“ are unidentified metabolites4 of 8 LETTER TO EDITOR
A C D
B E
F
G
I J
HLETTER TO EDITOR 5 of 8
In conclusion, our translational approach gives novel Boehringer Ingelheim, Merck, Novo Nordisk, and served
insights into the metabolic profile associated with T2D. as a speaker for Boehringer Ingelheim, Merck, Novo
Particularly, our unbiased metabolomics identified 1,5- Nordisk, Lilly, BMS, and Astra Zeneca. N.M. declines all
AG as an excellent biomarker for glycemic control in personal compensation from pharma or device companies.
humans and mice. We further demonstrate SGLT2 inhi- K.S. served as a consultant to Amgen, Boehringer Ingel-
bition to lower 1,5-AG serum levels, most likely mediated heim, AstraZeneca, Lilly, received grant support from
by reduced renal reabsorption. 1,5-AG should consequently Boehringer Ingelheim, and served as a speaker for Amgen,
not be used as an indicator of glycemic control in patients AstraZeneca, Boehringer Ingelheim, Lilly, MSD, Novo
with SGLT2 inhibitor treatment. Nordisk, Novartis, OmniaMed.
M.F. served as a consultant for Boehringer Ingel-
E T H I C S A P P R O VA L A N D C O N S E N T heim, Merck Sharpe&Dohme, Lilly & Co, Janssen, Sanofi,
T O PA R T I C I PA T E Amgen.
All subjects gave written informed consent. Ethics of M.L. received grants and personal fees from Boehringer
myocardial infarction cohort were approved by the ethical Ingelheim, MSD and Novo Nordisk, personal fees from
committee of Policlinico Tor Vergata University of Rome. Amgen, Sanofi, Astra Zeneca, Bayer and Lilly.
Ethics of Empagliflozin registry cohort were approved by
the ethics committee of the Medical Faculty of RWTH F U N D I N G I N F O R M AT I O N
Aachen University. Ethics of the placebo‑controlled, ran- B.A.K. was supported by a grants from the Deutsche
domized, double blind human trial with empagliflozin Stiftung für Herzforschung (DSHF)[F-43-16] and RWTH
were approved by the ethics committee of the Medical Fac- Aachen University (START); N.M. and M.L. were sup-
ulty of RWTH Aachen University and the German Federal ported by the Deutsche Forschungsgemeinschaft (German
Institute for Drugs and Medical Devices (Bundesinstitut Research Foundation; SFB/TRR 219; Project-ID 322900939
für Arzneimittel und Medizinprodukte, BfArM). [M03, M05]. M.L. was supported by the Interreg V-A
Animal experiments were approved by the government grant EURlipids. K.S. was supported by the Deutsche
of North Rhine-Westphalia, Germany. Forschungsgemeinschaft (German Research Foundation;
SFB/TRR219 C-07). K.S., N.M. and M.L. were further sup-
AVA I L A B I L I T Y O F D A T A ported by a CORONA Foundation grant. M.F. laboratory
A N D M AT E R I A L S was in part funded by EU-FP7 FLORINASH [grant agree-
The datasets used and analyzed during the current study ment ID: 241913], Ministry of University (MIUR) Progetti
are available from the corresponding author on reasonable di Ricerca di Interesse Nazionale (PRIN) [protocol number
request. 2015MPESJS_004 and 2017FM74HK], Fondazione Roma
call for Non-Communicable Diseases NCD 2014, EU-FP7
CONFLICT OF INTEREST EURHYTHDIA [grant agreement ID: 278397]. The funders
N.M. has received support for clinical trial leadership were not involved in the design of the study; the collection,
from Boehringer Ingelheim, Novo Nordisk, served as analysis, and interpretation of data; writing the report; and
a consultant to Boehringer Ingelheim, Merck, Novo did not impose any restrictions regarding the publication
Nordisk, AstraZeneca, BMS, received grant support from of the report.
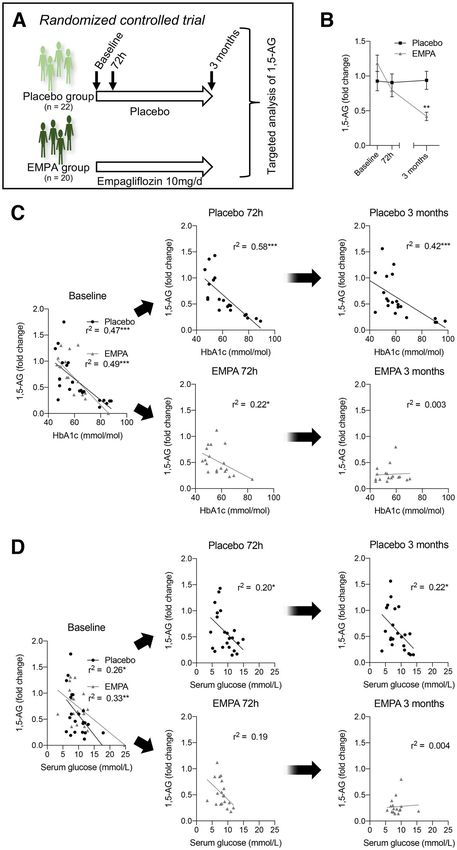
F I G U R E 3 SGLT2 inhibitor empagliflozin confounds glycemic marker 1,5-anhydroglucitol in diabetic patients and mice. (A) Serum
metabolomics performed in the Empagliflozin Registry. Patients with type 2 diabetes mellitus (T2D) at baseline before empagliflozin
treatment (n = 25) and at follow-up (FU) 1 month (n = 25) and 6 months (n = 14) after initiation of empagliflozin 10 mg/day. (B) Changes in
HbA1c after treatment with empagliflozin. **P < 0.01, ***P < 0.001 versus baseline by mixed-effects analysis with Tukey’s post hoc test.
EMPA: empagliflozin treatment. (C) Changes in 1,5-anhydroglucitol (1,5-AG) after treatment with empagliflozin. *P < 0.05, ***P < 0.001
versus baseline by mixed-effects analysis with Tukey’s post hoc test. (D) Top 25 metabolites correlating with glycemic markers in the
Empagliflozin Registry (Pearson correlation with P < 0.05 and FDR < 0.3). Upper graph: HbA1c. Lower graph: Serum glucose. “X-“ are
unidentified metabolites. (E) Levels of 1,5-AG as fold changes among different tertiles of HbA1c (in mmol/mol) at baseline (left), 1 month
(middle) and 6 months (right) of empagliflozin treatment (EMPA). **P < 0.01, ***P < 0.001 versus baseline by 1-way ANOVA with Tukey’s
post hoc test. n/a: no data available. (F) Pearson correlation analysis of 1,5-AG and HbA1c before (left) and after empagliflozin treatment
(middle and right). ***P < 0.001. (G) Pearson correlation analysis of 1,5-AG and serum glucose before (left) and after empagliflozin treatment
(middle and right). **P < 0.01. (H) Diabetic mice (Db/Db) fed a high-fat Western diet ± empagliflozin 150 mg/kg (n = 6 per group). (I) Levels
of 1,5-anhydroglucitol (1,5-AG) as fold changes between Db/Db mice ± EMPA. *P < 0.05 by two-sided t-test. (J) Pearson correlation analysis of
1,5-AG and serum glucose in Db/Db mice ± EMPA6 of 8 LETTER TO EDITOR
F I G U R E 4 Dependency of
1,5-anhydroglucitol on SGTL2 is confirmed in
a placebo‑controlled, randomized, double
blind human trial with empagliflozin. (A)
Targeted serum analysis of 1,5-anhydroglucitol
(1,5-AG) was performed in a in a
placebo‑controlled, randomized, double blind
human trial with empagliflozin at baseline,
72 h, and 3 months after treatment. Placebo
group: n = 22; empagliflozin (10 mg once
daily)(EMPA): n = 20. (B) Serum levels of
1,5-AG over time in placebo- and
empagliflozin-treated patients. **P < 0.01 by
mixed-effects analysis with Sidak’s multiple
comparison test. (C) Pearson correlation
analysis of 1,5-AG and HbA1c at baseline, 72 h,
and 3 months after placebo/empagliflozin
treatment. *P < 0.05, ***P < 0.001. (D) Pearson
correlation analysis of 1,5-AG and serum
glucose at baseline, 72 h, and 3 months after
placebo/empagliflozin treatment. *P < 0.05,
**P < 0.01, ***P < 0.001
AU T H O R CO N T R I B U T I O N S B.A.K., J.M., K.T., M.R. A.A., J.A., B.G., K.S., F.R., R.S.;
Conceptualization, B.A.K., M.F., N.M., and M.L.; Method- Untargeted metabolomics analysis, A.A., J.A.; Resources,
ology, B.A.K., M.F., and M.L.; Development or design of B.A.K., M.F., and M.L.; Data Curation, B.A.K.; Writing –
methodology, B.A.K., M.F., and M.L.; Software, B.A.K.; Original Draft, B.A.K.; Writing – Review & Editing, B.A.K.,
Formal Analysis, B.A.K., M.F., and M.L.; Investigation, M.F., K.S., N.M., and M.L.; Visualization, B.A.K.; Supervi-LETTER TO EDITOR 7 of 8
sion, M.F., N.M., and M.L.; Project Administration, B.A.K., ORCID
M.F., N.M., and M.L.; Funding Acquisition, B.A.K, K.S., Ben A. Kappel https://orcid.org/0000-0001-9065-9412
N.M., M.F., and M.L. Jerzy Adamski https://orcid.org/0000-0001-9259-0199
Massimo Federici https://orcid.org/0000-0003-4989-
Ben A. Kappel1 5194
Julia Moellmann1
Kirsten Thiele1 REFERENCES
Matthias Rau1 1. Moellmann J, Klinkhammer BM, Droste P, et al. Empagliflozin
Anna Artati2 improves left ventricular diastolic function of db/db mice.
Jerzy Adamski3,4,5 Biochim Biophys Acta - Mol Basis Dis. 2020;1866:165807.
Bart Ghesquiere6,7 2. Kappel BA, Lehrke M, Schütt K, et al. Effect of empagliflozin
on the metabolic signature of patients with type 2 diabetes
Katharina Schuett1
mellitus and cardiovascular disease. Circulation. 2017;136:969-
Francesco Romeo8 972.
Robert Stoehr1 3. Rau M, Thiele K, Hartmann NUK, et al. Empagliflozin does
Nikolaus Marx1 not change cardiac index nor systemic vascular resistance but
Massimo Federici8,9,# rapidly improves left ventricular filling pressure in patients with
Michael Lehrke1,# type 2 diabetes: a randomized controlled study. Cardiovasc Dia-
betol. 2021;20:1-12.
1 Department 4. McGill JB, Cole TG, Nowatzke W, et al. Circulating 1,5-
of Internal Medicine 1, University Hospital
anhydroglucitol levels in adult patients with diabetes reflect lon-
Aachen, RWTH Aachen University, Aachen, Germany
2 Metabolomics and Proteomics Core, Helmholtz Zentrum
gitudinal changes of glycemia: a U.S. trial of the GlycoMark
assay. Diabetes Care. 2004;27:1859-1865.
München, German Research Center for Environmental 5. Yamanouchi T, Akanuma Y. Serum 1,5-anhydroglucitol (1,5
Health (GmbH), Neuherberg, Germany AG): new clinical marker for glycemic control. Diabetes Res Clin
3 Institute of Experimental Genetics, Helmholtz Zentrum Pract. 1994;24:S261-S268.
München, German Research Center for Environmental 6. Koga M, Murai J, Saito H, et al. Close relationship between
Health, Neuherberg, Germany serum concentrations of 1,5-anhydroglucitol and uric acid in
4 Institute of Biochemistry, Faculty of Medicine, University non-diabetic male subjects implies common renal transport sys-
tem. Clin Chim Acta. 2009;410:70-73.
of Ljubljana, Ljubljana, Slovenia
7. Yamanouchi T, Shinohara T, Ogata N, et al. Common reabsorp-
5 Department of Biochemistry, Yong Loo Lin School of
tion system of 1,5-anhydro-D-glucitol, fructose, and mannose in
Medicine, National University of Singapore, Singapore rat renal tubule. Biochim Biophys Acta - Gen Subj. 1996;1291:89-
6 VIB Metabolomics Expertise Center, VIB Center for
95.
Cancer Biology, Leuven, Belgium 8. Tazawa S, Yamato T, Fujikura H, et al. SLC5A9/SGLT4, a
7 KU Leuven Metabolomics Expertise Center, Department of new Na +-dependent glucose transporter, is an essential trans-
Oncology, Katholieke Universiteit Leuven, Leuven, Belgium porter for mannose, 1,5-anhydro-D-glucitol, and fructose. Life
8 Department of Systems Medicine, University of Rome Tor Sci. 2005;76:1039-1050.
9. Fortuna D, McCloskey LJ, Stickle DF. Model analysis of effect
Vergata, Rome, Italy of canagliflozin (Invokana), a sodium-glucose cotransporter 2
9 Center for Atherosclerosis, Policlinico Tor Vergata, Rome,
inhibitor, to alter plasma 1,5-anhydroglucitol. Clin Chim Acta.
Italy 2016;452:138-141.
10. Wortmann SB, van Hove JLK, Derks TGJ, et al. Treating neu-
Correspondence tropenia and neutrophil dysfunction in glycogen storage dis-
Ben A. Kappel, M.D. Ph.D., Pauwelsstr. 30, 52074 Aachen, ease type Ib with an SGLT2 inhibitor. Blood. 2020;136:1033-
1043.
Germany.
Email: bkappel@ukaachen.de
# equally contributing senior authors. S U P P O RT I N G I N F O R M AT I O N
Additional supporting information may be found online
KEYWORDS in the Supporting Information section at the end of the
biomarker, metabolomics, SGLT2, type 2 diabetes article.You can also read