Hutt Valley District Health Board 2019/20-2022/23 Statement of Intent incorporating the 2019/20 Statement of Performance Expectations
←
→
Page content transcription
If your browser does not render page correctly, please read the page content below

E84

    Hutt Valley District Health Board
   2019/20-2022/23 Statement of Intent
  incorporating the 2019/20 Statement
      of Performance Expectations

                                       November 2019

Presented to the House of Representatives pursuant to sections 149 and 149(L) of the Crown Entities Act 2004.

                                                                                                                0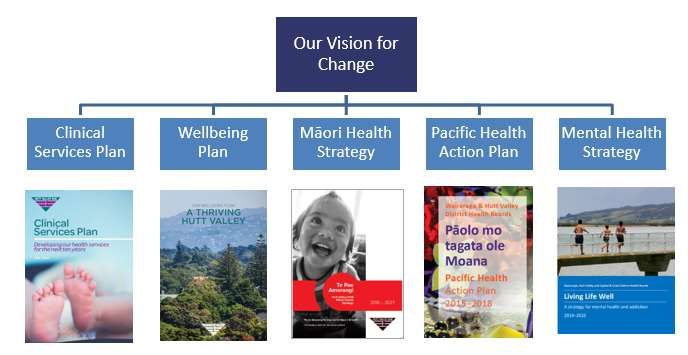
The photo on the front cover was kindly provided by Healthy Families, Lower Hutt – with the
permission of the students from Saint Bernadette’s School, Naenae, who were celebrating at
Poly Odyssey 2018.

Crown copyright ©. This copyright work is licensed under the Creative Commons Attribution 4.0
International licence. In essence, you are free to copy, distribute and adapt the work, as long
as you attribute the work to the New Zealand Government and abide by the other licence terms.

To view a copy of this licence, visit http://creativecommons.org/licenses/by/4.0/. Please note
that neither the New Zealand Government emblem nor the New Zealand Government logo may
be used in any way which infringes any provision of the Flags, Emblems, and Names Protection
Act 1981 or would infringe such provision if the relevant use occurred within New Zealand.
Attribution to the New Zealand Government should be in written form and not by reproduction
of any emblem or the New Zealand Government logo.

                                                                                                  1
Table of Contents
Statement of Intent 2019 – 2023 .................................................................................................. 3
About Hutt Valley District Health Board ....................................................................................................3
          What we do ......................................................................................................................................................3
          The Treaty of Waitangi .....................................................................................................................................3
          Our population .................................................................................................................................................4
          An average day in Hutt Valley health ...............................................................................................................4
          Our regional role ..............................................................................................................................................4
          The needs of an ageing population .................................................................................................................5
Our Vision for Change ..............................................................................................................................6
Strategic objectives ..................................................................................................................................7
          Strategic Framework .......................................................................................................................................9
Managing our Business ..........................................................................................................................10
          Regional Public Health ...................................................................................................................................10
          Organisational performance management ....................................................................................................10
          Funding and financial management ...............................................................................................................10
          Investment and asset management ...............................................................................................................10
          Shared service arrangements and ownership interests ................................................................................10
          Risk management ..........................................................................................................................................10
          Quality assurance and improvement .............................................................................................................11
Building Capability ..................................................................................................................................11
          Capital and infrastructure development .........................................................................................................11
          Workforce .......................................................................................................................................................11
          Co-operative developments ...........................................................................................................................12
2019/20 Statement of Performance Expectations including Financial Performance .................. 13
Output class 1: Prevention Services .......................................................................................................15
Output class 2: Early detection and management...................................................................................16
Output class 3: Intensive assessment and treatment ..............................................................................17
Output class 4: Rehabilitation and Support .............................................................................................18
Output Class Financials ..........................................................................................................................19

                                                                                                                                                                           2
Statement of Intent 2019 – 2023
About Hutt Valley District Health Board
What we do
The Hutt Valley District Health Board (DHB) is one of twenty DHBs in New Zealand charged by
the Crown with improving, promoting and protecting the health and independence of their
resident populations. Like all DHBs, we receive funding from the Government to purchase and
provide the services required to meet the health needs of our population and we are expected to
operate within allocated funding.
In accordance with legislation and government objectives, we use that funding to:
Plan the strategic direction of our health system and, in collaboration with clinical leaders
and alliance partners, determine the services required to meet the needs of our population.
Fund the health services required to meet the needs of our population and, through
collaborative partnerships and performance monitoring, ensure these services are safe,
equitable, integrated and effective.
Provide a significant share of the specialist health and disability services delivered to our
population, and to the population of other DHBs, where more specialised or higher-level
services are not available.
Promote and protect our population’s health and wellbeing through investment in health
protection, promotion and education services and delivery of evidence-based public health
initiatives.
While Hutt Valley DHB is the lead provider of health services for the people of the Hutt Valley, it
shares this responsibility with Primary Healthcare Organisations (PHOs), the Accident
Compensation Corporation (ACC), and Non-Government Organisations (NGOs). This means
there are health services provided in the Hutt Valley that are not commissioned by the DHB and
this creates a requirement to build local partnerships and an integrated health system response
by working with all of these partners, including local Māori, social sector agencies, and councils.
The Treaty of Waitangi
In planning and providing health services, we pay particular attention to the health needs and
aspirations of our Māori population. There are well-documented and preventable inequities in
the determinants of health between Māori and non-Māori, and these flow through to inequities
in health outcomes. Our intention is that we will target, plan and drive our health services to
create equity of health care for Māori to attain good health and well-being, while developing
partnerships with the wider social sector to support whole of system change.
Māori are the indigenous peoples of Aotearoa. We have particular responsibilities and
accountabilities through the founding document of Aoetaroa, The Treaty of Waitangi. Hutt Valley
DHB values the Treaty and the principles of:
Partnership – working together with iwi, hapū, whānau and Māori communities to develop
strategies and services to improve Māori health and wellbeing
Participation – involving Māori at all levels of decision-making, planning, development and
service delivery
Protection – working to ensure Māori have at least the same level of health as non-Māori,
and safeguarding Māori cultural concepts, values and practices.
Māori representation has been provided on Hutt Valley DHB’s advisory committees and its
Alliance Leadership Team. Hutt Valley DHB has also established an Iwi Relationship Board to
formalise the relationship between local Iwi and the DHB, build on relationships, and share
aspirations and strategic directions.
3Our population
Hutt Valley DHB covers the Te Awakairangi area – the Hutt Valley and serves approximately
150,000 people. Our District Health Board covers both Upper Hutt City and Hutt City. People
under 25 years of age account for 32 percent of the Hutt Valley population and those aged 65
years of age account for approximately 15 percent. The Hutt Valley’s population is ethnically
diverse; 17 percent of our population identify as Māori, 8 percent as Pacific peoples and 75
percent as New Zealand European, Asian and Other. Overall, the Hutt Valley area has similar
proportions of those living in the highest and lowest deprivation areas. However, these overall
figures mask the extremes in deprivation seen in the Lower Hutt area, where there is a greater
proportion of the population living in the most deprived areas.
An average day in Hutt Valley health
On average five babies are born in the Hutt Valley each day, 18 breast cancer screenings are
carried out, 32 children are immunised, 1,870 laboratory tests are done and 284 children visit
the school dental service.
In addition to this, 2,030 people are seen by a GP or primary care nurse, and 126 by a
community nurse. 286 people attend outpatient clinics, 705 hours of home support are carried
out, 13 people receive their annual diabetes review and 54 people get the flu vaccination.
At the hospital 131 people visit the Emergency Department and 75 patients are discharged.
Each day thirteen new people access mental health support and 775 people reside in aged
residential care.
Our regional role
Hutt Valley DHB is one of six Central Region DHBs – together with Capital & Coast, Hawkes’
Bay, MidCentral, Wairarapa, and Whanganui. We work closely our Central Region DHB partners
to plan and coordinate the delivery of health services regionally as well as locally. Technical
Advisory Services (TAS) is funded by the Central Region DHBs to assist us with developing and
planning services across the region.
Hutt Valley DHB also forms part of a ‘3DHB’ sub-region with Capital & Coast and Wairarapa
DHBs. We work closely with our sub-regional partners to plan and coordinate our services
locally. Under the 3DHB umbrella almost all tertiary level services are provided at Capital &
Coast DHB. These services include cardio thoracic, oncology, renal, vascular, urology, tertiary
maternity, and neurosurgery services.
A number of other DHB-funded services are provided across the sub-region, including:
The Mental Health, Addictions and Intellectual Disability Service (MHAIDS) (3DHB)
The Disability Responsiveness Programme (3DHB)
Regional Public Health (3DHB)
Regional Screening services (3DHB)
Regional Child Oral Health Services (2DHB – Hutt and Capital & Coast).
Within the Central Region, Hutt Valley DHB provides and specialises in Plastics, Maxillo-facial
and Burns services, and Rheumatology services.
4The needs of an ageing population
As our population ages, we are seeing more people with long-term health conditions and multi-
morbidities. People are living longer than previous generations, but are living longer in poorer
health.1 This is particularly so for Māori, Pacific people, refugees, disabled people and those
living with a mental illness:
Māori males aged 65 can expect the shortest remaining time of living without disability or
long-term illness (5.5. years on average) and the highest proportion of remaining time
lived with disability requiring support.2
Ageing leads to a gradual decrease in physical and mental capacity and an increasing risk of
age-related health conditions (often several at the same time). Old age can also be
characterised by the emergence of syndromes such as frailty, delirium and urinary
incontinence.3 Older people are not a homogeneous group and many people over the age of 65
years will continue to be active and independent members of their communities. However, as a
result of increasing health and social care needs, older people generally require a far greater
share of health care resources than younger people.
Our total population is not expected to grow substantially over the next 20 years (just under 5%
or around 7,000 people), although there are both short- and long-term plans for housing
development in Lower Hutt and Upper Hutt cities. However, there will be a significant increase in
the number of older people, with current projections suggesting that in 2038 almost one in four
people will be aged over 65 years. The population aged over 80 will double. The overall number
of children and working-age adults is expected to decline.
Figure 1 Hutt Valley growth by age group
140%
120%
100% 0-4 yrs
80% 5-14 yrs
15-24 yrs
60%
25-44 yrs
40% 45-64 yrs
65-84 yrs
20%
85+ yrs
0%
-20%
2017 2022 2027 2032 2037
Source: Statistics New Zealand population projections prepared for the Ministry of Health.
As a consequence of our changing population, increased demand will occur across our health
system in community care, primary care, aged residential care and in the hospital at the same
time as our working-age population decreases.
1
http://www.who.int/news-room/fact-sheets/detail/ageing-and-health Ministry of Health. 2018. Health and
Independence Report 2017. The Director-General’s Annual Report on the State of Public Health. Wellington: Ministry of
Health.
2
Associate Minister of Health 2016. Health Ageing Strategy. Wellington: Ministry of Health.
3
http://www.who.int/news-room/fact-sheets/detail/ageing-and-health.
5Our Vision for Change
In 2017, we introduced Our Vision for Change – How We Will Transform the Health System
2017-2027. This strategy articulates Hutt Valley DHB’s high-level strategic objectives and our
vision for:
Healthy People, Healthy Families, Healthy Communities - Whānau Ora ki te Awakairangi
Our people, whānau and communities have told us what is needed from the Hutt Valley health
system in order to achieve Our Vision for Change. These strategic objectives include services
being organised and delivered equitably, whānau being owners of their care, a focus on
prevention and early intervention, care delivered closer to people’s homes, coordinated health
and social services, and a health system that is clinically and financially sustainable.
Key strategic directions and enablers have been identified to guide and support us towards
creating the future health system we want. Our key strategic directions are: support living well,
shift care closer to home, and deliver shorter, safer, smoother care. Our key strategic enablers
are: adaptable workforce, smart infrastructure and effective commissioning.
6Strategic objectives
To achieve Our Vision for Change, our people, whānau and communities have told us the Hutt
Valley health system needs to achieve the following strategic objectives.
Care and services are organised and delivered equitably so everyone has the opportunity to
achieve the same level of good health.
Individuals and whānau are owners of their care and we involve them fully in decision-
making about their care.
Most health services focus on prevention, and health care is provided earlier and closer to
people’s homes.
Urgent and complex care is readily available for episodes of ill health but most health care
will be planned.
Individuals and whānau experiences of health care is optimal, throughout their life span.
Services are planned and delivered in partnership with local government, the wider health,
social and education sectors.
There is a clinically and financially sustainable future for our health system.
Key strategic directions and enablers have been identified to guide and support us towards
creating the future health system we want. Our key strategic directions are: support living well,
shift care closer to home, and deliver shorter, safer, smoother care. Our key strategic enablers
are: adaptable workforce, smart infrastructure and effective commissioning.
Figure 2 on the following page shows the relationship between the Government’s priorities for
the health system, our vision for change and strategic objectives, how we will measure our
progress and performance, and how we work to achieve our vision (our core values).
7Figure 2: Hutt Valley District Health Board – Achieving Our Vision for Change
Whole of
Government
Improving the wellbeing of New Zealanders and their families
Health
Live longer in good health Improved quality of life Equity for Māori and other groups
contribution
Government Strong fiscal Child Primary Public health & Mental health Equitable
Priorities management wellbeing health care environment and addictions system
Our Vision Healthy People (Mauri ora) Healthy Families (Whānau ora) Healthy Communities (Wai ora)
Services are organised to ensure everyone has the opportunity to achieve the same level of good health
Individuals and whānau are owners of their care and we involve them fully in decision-making about their care
Most health services focus on prevention, and health care is provided earlier and closer to people’s homes
Strategic
Urgent and complex care is readily available for episodes of ill health but most health care will be planned
Objectives
Individuals and whānau experiences of health care is optimal, throughout their life span
Services are planned and delivered in partnership with local government and the wider social and education sectors
There is a clinically and financially sustainable future for our health system
- Equity of service access and outcomes for Māori, Pacific, and low income people (across all areas)
- Financial performance - Amenable mortality rates (deaths of people under 75 years old that could be avoided)
Key - Babies breastfed at 3 months - Ambulatory Sensitive Hospital (ASH) - Length of inpatient stay in hospital
Progress - Children fully immunized admissions - Time patient spend in ED
- Oral health at age five - Diabetes management - Waiting time to access mental
measures4
- Screening for breast and cervical - ED presentation rates per capita health and addiction services
cancer (& eventually bowel cancer) - Acute hospital bed days per capita - Falls in hospital
- Adults offered help to quit smoking - Acute readmission to hospital - Access to electives
- Patient experience in hospital
Support people living well Shift care closer to home Deliver shorter, safer,
We will work We will shift services so smoother care
collaboratively with they are delivered closer We will coordinate and
partners to create healthy to the people using them, so people streamline patient care, so that
environments, eliminate health can receive most of their (non- individuals and whānau experience a
inequities, and support people to complex) care within their shorter, safer and smoother journey
adopt healthy lifestyles and keep well. community or homes. through our services.
Adaptable Workforce
What
We will create a work environment for staff that values what they do, nurtures skill development and
we’re
provides the culture for them to be their best and provide quality care. We will have a well-trained and
doing to engaged workforce that is adaptable with a diverse skill mix.
achieve
our vision Effective Commissioning
We will ensure our commissioning is informed by evidence to achieve the best health
outcomes for individuals and the population, support the elimination of health inequities, and improve
people’s experience of care.
Smart infrastructure
We will create a digitally-enabled health system that supports people to stay well, and shares information
and care plans for better tracking of care. We will use data to understand people’s needs and drive people-
focused services. Our hospital facilities will be designed for complex care, and networked with other hospitals.
How we Always Caring Can Do Our Values In Partnership Being Our Best
work
4
We have chosen some key progress measures to closely monitor the progress we are making towards Our Vision for
Change. However, it should be noted that we use a number of additional measures to monitor the quality of our service,
which cover service access, safety, equity, efficiency, timeliness, outcomes, and patient experience.
8Strategic Framework
We have developed a number of plans to support us to meet the challenges ahead and achieve
Our Vision for Change. Together these plans reflect our Hutt Valley DHB’s strategic framework.
Figure 1 Hutt Valley DHB’s Strategic Framework
Our Clinical Services Plan 2018-2028 provides an outline of how we will need to reconfigure our
clinical services over the next 5-10 years to address growing health demands.
Our Wellbeing Plan: A Thriving Hutt Valley focusses on prevention, strengthening whānau and
communities, and addressing the wider determinants and environmental factors that impact
our physical and mental wellbeing.
Te Pae Amorangi, Hutt Valley DHB’s Māori Health Strategy to 2027, details our commitment
to improving the health of Māori in our district through five priority areas: workforce,
organisational development and cultural safety, commissioning, mental health and addictions,
and the first 1,000 days of life.
Our Pacific Health Action Plan aims to improve Pacific health and reduce health inequities
through four priorities focus areas: child health, health literacy, access to care, and workforce
capacity.
Living Life Well, our 3DHB5 Mental Health and Addictions Strategy 2019-2015, sets the
direction for mental health and addiction care to improve outcomes for our people, their
whānau, and our wider communities.
The work of implementing our strategic plans has begun. We are developing and progressing
work programmes to drive the changes we need to make. Hutt Valley DHB has established a
Project Management Office, which is supporting a number of projects to improve hospital
integration with community services, and enhance patient flow and efficiency within hospital.
As well as changes to our own services, we are also working closely with Central Region DHBs 6
to plan and coordinate our services together. We are working closely with Capital & Coast DHB,
in particular, to plan, coordinate, and integrate our hospital services and care pathways as much
as possible, so that together both DHBs provide high-quality and timely services to our
populations. This joint planning work across our network of hospitals (at Wellington, Kenepuru,
and Hutt Hospital) will improve the clinical and financial sustainability of our health system. We
are also working towards the development of a combined Long Term Investment Plan for Capital
& Coast DHB and Hutt Valley DHB.
5
Hutt Valley, Capital & Coast, and Wairarapa DHBs.
6
The Central Region comprises six DHBs (Capital & Coast Health, Hawkes’ Bay, Hutt Valley, MidCentral, Wairarapa and
Whanganui).
9Managing our Business
Regional Public Health
Regional Public Health (RPH) is the public health unit for the sub-region (Wairarapa, Hutt Valley,
and Capital & Coast DHBs). Organisationally, RPH is part of Hutt Valley DHB. The three DHBs
work in partnership with RPH in their work on health promotion/improvement, enhancing the
effectiveness of prevention activities in other parts of the health system, and regulatory
services. The details about the activities of RPH are contained in the Regional Public Health
2019/20 Annual Plan.
A key focus for 2019/20 is collaboration with RPH, Healthy Families, PHOs and other community
providers to leverage the investment and coordinate our health promotion activities to deliver
collective impact on national and local priorities. Improving equity of outcomes for Māori, Pacific,
and people on low incomes is a key focus of this work.
Organisational performance management
Hutt Valley DHB’s performance is assessed on both financial and non-financial measures, which
are measured and reported at all levels of the organisation. These are reported daily, weekly,
fortnightly or monthly as appropriate.
Funding and financial management
Hutt Valley DHB’s key financial indicators include performance against the DHB operating
budget, FTE management within the FTE budget, and DHB cash position. These are assessed
and reported through Hutt Valley DHB’s performance management process to the Executive
Leadership Team, the Finance Risk and Audit Committee and the Board on a monthly basis. The
DHB’s cash position is also monitored on a daily basis by the DHB finance team. Further
information about Hutt Valley DHB’s planned financial position for 2019/20 and out years is
contained in the Financial Performance Summary section of Hutt Valley DHB’s 2019/20
Statement of Performance Expectations.
Investment and asset management
In 2019/20 Hutt Valley DHB will progress work on its integrated strategic investment planning
programme. This work will be guided by our strategic framework, particularly our Clinical
Services Plan, which examines strategic options for service changes to achieve health
improvements for our population in a clinically and financially sustainable manner.
As well as changes to our own services, we are also working closely with Central Region DHBs 7 –
and Capital & Coast DHB in particular - to plan and coordinate our services across Wellington,
Kenepuru and Hutt Hospital. This work is contributing to a bigger programme of work – a Long
Term Investment Plan – to identify the investments needed to ensure these hospitals have the
assets needed in the future to manage growing demand and achieve our strategic objectives.
Shared service arrangements and ownership interests
Hutt Valley DHB has a part ownership interest in Allied Laundry and NZ Health Partnerships.
The DHB does not intend to acquire shares or interests in other companies, trusts or
partnerships at this time.
Risk management
Hutt Valley DHB has a formal risk management and reporting system, with monthly reporting to
the Hutt Valley DHB Finance, Risk and Audit Committee via the Executive Leadership Team. The
Hutt Valley DHB is committed to managing risk in accordance with the process set out in the
Australian/New Zealand Joint Standard on Risk Management (AS/NZS ISO 31000:2009).
7
The Central Region comprises six DHBs (Capital & Coast Health, Hawkes’ Bay, Hutt Valley, MidCentral, Wairarapa and
Whanganui).
10Quality assurance and improvement
Hutt Valley DHB’s approach to quality assurance and improvement is in line with Triple Aim plus
One:
For our patients – improved quality, safety and experience of care and a better patient
journey
For our populations – improved health and equity for all populations
For the public – best value for health system resources and sustainable management of
resources
For our organisation – a thriving, socially responsible, organisation as a result of our
culture, clinical leadership, engagement and workforce development.
Hutt Valley DHB’s clinical and corporate governance structure ensures that systems are in place
to optimise patient care and minimise risks, whilst continuously monitoring and improving the
quality of clinical care. The framework for reporting on quality assurance activity occurs at every
level across the hospital, with our primary care partners, and across the sub-region. Contracted
services are aligned with national quality standards and auditing of contracted providers includes
quality audits.
Hutt Valley DHB also has a strong culture of continuous improvement. Our quality goals are
underpinned by a culture of working together at all levels across the Hutt Valley health system
and with our neighbouring DHBs. Our culture encourages openness and transparency, learning
from error or harm, and ensuring that the contribution of staff from all levels of the DHB for
quality improvement and innovation are truly valued. We are working to strengthen multi-
disciplinary team-based structures within the DHB to ensure that care and treatment options are
well considered and patient centred. Quality improvement training and ‘improvement clinics’ are
also provided to build understanding of quality improvement throughout the organisation.
Building Capability
Capital and infrastructure development
Key strategic capital investments continue to be IT related, including the programme of work on
the Regional Informatics Programme.8 Investment will be required on the DHB infrastructure,
and this will be informed by the Clinical Services Plan and the joint sub-regional service planning
with Capital & Coast DHB. Hutt Valley DHB is also improving the effectiveness and efficiency of
human resources, and work is underway to upgrade and streamline our recruitment, induction,
and performance management processes and systems across the DHB.
Te Whare Ahuru (TWA), the adult mental health acute inpatient service, requires
reconfiguration. TWA is the based on the Hutt Hospital campus and is the primary provider of
inpatient mental health care to residents of Hutt Valley and Wairarapa DHBs. TWA operates in
partnership with Te Whare O Matairangi, the Capital & Coast DHB inpatient unit based in
Wellington on the regional hospital site.
A recent review of the acute model of care (including TWA) found the design of TWA is dated,
not fit‐for‐purpose and creates clinical care and safety issues. The facility does not enable good
therapeutic outcomes, and is culturally inappropriate in its ability respond to the cultural needs
of Māori clients. The demand for TWA also frequently outstretches its capacity. Hutt Valley DHB
has embarked on a strategic assessment and single stage business case to consider facility
options.
Workforce
Hutt Valley DHB is building a workforce that is responsive to, and reflects, the populations we
serve. In June 2019 all 20 DHB Chief Executives committed to introducing targets for DHBs to
increase Māori participation in the workforce. To meet this commitment Hutt Valley DHB will be
reviewing our current recruitment policies and procedures to enhance the ability to attract,
8
The Regional Informatics Programme is a significant programme that will centralise the acquisition, storage, retrieval,
and use of patient information across the Central Region's six DHBs.
11appoint and retain Māori staff. We are also developing a diversity recruitment policy to help us
attract and recruit a diverse mix of staff reflective of our community.9
We value cultural intelligence and are working to enhance and grow the cultural safety of our
workforce. This work includes developing and delivering Māori health equity and cultural safety
training to DHB staff. Our Pacific Health Unit continues to deliver cultural support through
training for health practitioners within the hospital and out in primary care. These activities
support our collaboration with primary care partners to improve and achieve health equity and
outcomes for Māori and Pacific people.
Enhancing employee wellbeing and engagement remains a key focus. Our aim is to make Hutt
Valley DHB a place where our people love to work and where our patients receive the best
possible care ‘every person, every time’. Together we have created a vision for people’s
experience working and being cared for here, and we continue to embed our core values into
how we work together to deliver a great service to our community.10 We have been consulting
with staff on the development of a staff wellbeing programme, Mauri Ora, which will include
tools and resources for staff to support a healthier and happier workplace.
In 2018 we launched Nursing at its Best, Hutt Valley DHB’s five-year nursing workforce
strategy. The strategy aims to ensure that all people and their families/whanau accessing health
care in the Hutt Valley, will receive excellent nursing care from a competent, culturally
responsive, evidence-based and person-centred workforce. We are now progressing
implementation of the strategy. Key pieces of work being progressed under the four nursing
strategic priorities include:
Nursing workforce - implementing the Care Capacity Demand Management project. 11
Clinical leadership - increasing senior nurse participation in the Professional Development
and Recognition Programme.12
Education and professional practice - implementing the Nurse Entry to Practice (NETP)
Programme.13
Quality, patient safety and innovation - implementing Lippincott's Nursing Procedures
and Skills across the sector.14
To ensure a consistent approach to leadership and workforce planning, Hutt Valley DHB works
collaboratively with the national and regional DHB General Managers Human Resources group,
Central Technical Advisory Services (through the Regional Director – Workforce), Health
Workforce New Zealand and the State Services Commission. Further detail about the Central
regional approach to workforce is contained in the 2019/20 Central Regional Service Plan.
Co-operative developments
Hutt Valley DHB works and collaborates with a number of external organisations and entities on
delivery of programmes and initiatives contributing to the Hutt Valley health system. These
organisations and entities have a role in delivering the priority action areas noted in Hutt Valley
DHB’s Annual Plan.
9
‘Diversity’ can relate to culture, ethnicity gender, disabilities, and age.
10
Our core values are: Always caring, Can do, In partnership, and Being our best.
11
Care Capacity Demand Management is a programme for matching care capacity with care demand, and
aims to enable staff to provide high quality and safe care to our patients, improve the work environment
and improve organisational efficiency.
12
The PDRP provides a framework that helps nurses develop their professional practice and assist them on
a career pathway.
13
The NETP programme provides graduate Registered Nurses support and professional development to
facilitate their transition during their first year of practice.
14
Lippincott's Nursing Procedures and Skills provides real-time access to step-by-step guides for evidence-
based procedures and skills in a variety of specialty settings.
122019/20 Statement of Performance Expectations
including Financial Performance
Andrew Blair Wayne Guppy
Chair Deputy Chair
Hutt Valley DHB Hutt Valley DHB
Date: 7 November 2019 Date: 7 November 2019
13This Statement of Performance Expectations (SPE) is a requirement of the Crown Entities Act
2013 and includes a key set of outcomes and output measures, with baseline figures and targets
for the 2019/20 year.
The SPE serves three purposes:
1. It allows the responsible Minister to participate in setting the annual performance
expectations of Hutt Valley DHB.
2. It provides Parliament with information on these expectations.
3. It provides a base against which actual performance can be assessed. The actual results of
service performance (against what is forecast in the SPE) will be published in our 2019
Annual Report.
Output class measures
Four Output Classes are used by (all) DHBs to reflect the nature of services provided. The aim of
selecting output measures within each class for inclusion in the SPE is to ensure that the SPE
meaningfully supports the key strategic priorities of Hutt Valley DHB’s planned activities
(outlined in section two of the Annual Plan), and to provide a representation of the vast scope of
business as usual services we provide in support of our strategic goals.
In identifying appropriate output measures 15 within each output class we have included, in
addition to volume measures, a mix of measures that help us evaluate different aspects of our
performance. These measures indicate performance against service coverage (encompassing
health equity) quality, volume (quantity) and timeliness.
Some performance measures are demand-based and are included to provide a picture of the
services funded and/or provided by the Hutt Valley DHB. For such measures, there are no
assumptions about whether an increase or decrease is desirable. As such the “target” represents
an estimation of the service delivery for 2019/20 based on historical and population trends.
The following tables provide baselines, forecasts and targets for each output area.
Reference key
CW Child Wellbeing
MH Mental health and addiction care
SS Strong and equitable public health and disability system
PH Primary care and prevention
HVPI Hutt Valley DHB performance indicator
15
Some performance measures show health indicators by locality, ie the people who live in the Hutt Valley DHB’s
catchment, while other measures show performance of the services provided by Hutt Valley DHB regardless of the
service user’s home district. Some measures show combined data for all 3 DHBs; Wairarapa, Hutt Valley and Capital &
Coast, most often where services are provided on a sub-regional basis and data is not disaggregated by DHB. These
measures are indicated in the tables as (3DHB).
14Output class 1: Prevention Services
Preventative services are publicly funded services that protect and promote health in the
whole population or identifiable sub-populations comprising services designed to enhance the
health status of the population as distinct from treatment services.
Preventative services address individual behaviours by targeting population wide physical and
social environments to influence health and wellbeing.
Preventative services include health promotion to ensure that illness is prevented and
unequal outcomes are reduced; statutorily mandated health protection services to protect the
public from toxic environmental risk and communicable diseases; and, population health
protection services such as immunisation and screening services.
On a continuum of care these services are public wide preventative services.
Reference Target/Est. Baseline data
Outputs measured by Baseline
Previous New 2019/20 date
Immunisation
Total: 90%
Percentage of 8 month olds fully Q2 - 2018/19
HT CW05 ≥95% Māori: 82%
immunised (Oct-Dec 2018)
Pacific: 87%
Total: 93%
Percentage of 2-year olds fully Q2 - 2018/19
PP21 CW08 ≥95% Māori: 88%
immunised (Oct-Dec 2018)
Pacific: 92%
Total: 88%
Percentage of 5-year olds fully Q2 - 2018/19
PP21 CW05 ≥95% Māori:87%
immunised (Oct-Dec 2018)
Pacific: 82%
Percentage of population aged 65 years Total: 55%
1 Mar 2018 to
and over immunised against influenza PP21 CW05 ≥75% Māori: 48%
30 Sept 2018
annually Pacific: 57%
Smoking cessation
Percentage of PHO enrolled patients
Total: 93%
who smoke and have been offered help PH04 Q2 - 2018/19
HT5 ≥90% Māori: 92%
to quit by a health practitioner in last CW09 (Oct-Dec 2018)
Pacific: 91%
15 months
Total: 92%
Percentage of hospitalized smokers Q2 - 2018/19
PP31 SS06 ≥95% Māori: 91%
offered advice and help to quit (Oct-Dec 2018)
Pacific: 89%
Breastfeeding
Total: 56%
Percentage of infants fully or Six months:
PP37 CW06 ≥70% Māori: 40%
exclusively breastfed at 3-months Jan-Jun 2018
Pacific: 51%
Population based screening services
Ensuring service coverage - percentage Total: 86%
SS03 Six months:
of children who receive a B4 School - ≥90% Māori: 79%
16 Jan-Jun 2018
Check before they are 4½ years old Pacific: 77%
Healthy weight
Maori: 77% Q3 2018/19
(age 4): Number of B4 school check
HT7 CW10 95% Pacific: 65% (6 months to
participants identified with BMI range
Other: 85% Feb 2019)
between 5th and 84th percentile
Percentage of eligible women (45-69 Total: 75%
Q2 - 2018/19
years) having breast screening in the SI11 PV01 >70% Māori: 70%
(Oct-Dec 2018)
last 2 years Pacific: 67%
Percentage of eligible women (25-69 Total: 75%
Q2 - 2018/19
years) having cervical screening in last SI10 PV02 >80% Māori: 67%
(Oct-Dec 2018)
3 years Pacific: 68%
16
Also a Well Child/Tamariki Ora Quality Improvement Framework Indicator (number 14).
15Output class 2: Early detection and management
Early detection and management services are delivered by a range of health and allied health
professionals in various private, not-for-profit and government service settings. Include
general practice, community and Māori health services, Pharmacist services, Community
Pharmaceuticals (the Schedule) and child and adolescent oral health and dental services.
These services are by their nature more generalist, usually accessible from multiple health
providers and from a number of different locations within the DHB.
On a continuum of care these services are preventative and treatment services focused on
individuals and smaller groups of individuals.
Reference Target/Est Baseline data
Outputs measured by Baseline
Previous New 2019/20 date
Primary Care services / Long term conditions management
Total: 66% Q2 - 2018/19
Newborn enrolment with General
SI18 CW0717 ≥85% Māori: 63% (Oct-Dec
Practice by three months of age
Pacific: 67% 2018)
Improving Māori enrolment in PHOs to Six months
PP33 PH03 ≥90% Māori: 89%
meet the national average of 90% Jul-Dec 2018
Total: 8,236
Total: ≤ 7,886
ASH Rates (avoidable hospitalisations) Māori: 10,069 12 months to
PP22 PH0118 Māori: ≤ 9,722
for 0-4 years (rate per 100,000) Pacific: 11,619 Dec 2018
Pacific:≤ 11,272
Other: 6,766
Total: ≤ 4,764 Total: 4,520
ASH Rates (avoidable hospitalisations) Māori: ≤ 7,800 Māori: 7,520 12 months to
SI1 SS05
for 45-64 years (rate per 100,000) Pacific: ≤ 7,528 Pacific: 7,375 Dec 2018
Other: ≤ 4,023 Other: 3,838
Rate of hospitalisations potentially Total: 13
related to housing conditions per No increase from Maori: 20
- SS 2017/1819
1,000 population for children under baseline Pacific: 23
15 years age Other: 8
Total: 85% Q2 - 2018/19
Percentage of eligible population SS13
PP20 ≥90% Māori men age (Oct-Dec
assessed for CVD risk in last 5 years FA3
35-44: 59% 2018)
Percentage of DHB-domiciled
Total:54% Q2 - 2018/19
population (15-74 yrs) enrolled in a SS13
PP20 ≥70% Māori: 45% (Oct-Dec
PHO with well managed diabetes FA2
Pacific: 45% 2018)
(HbA1c ≤ 64 mmol/mol)20
Oral health (annual reporting)
Total: 63%
Percentage of children caries free (no Māori: 47% 2018 calendar
PP11 CW01 66%
cavities) at five years of age Pacific: 47% year
Other: 72%
Total: 0.65
Māori: 1.01 2018 calendar
Mean DMFT score at school year 8 21 PP10 CW02 0.61
Pacific: 1.02 year
Other: 0.50
Percentage of adolescents accessing 2018 calendar
PP12 CW04 ≥85% 66.8%
DHB-funded dental services year
17
Also a Well Child/Tamariki Ora Quality Improvement Framework Indicator (number 11) - with a national target of
≥90%.
18
Also a HQSC Health System Quality Indicator (EFCT-15)
19
HSH internal report is not subset of ASH (SI 1 Data) provided by MoH. HSH includes different nephritis diagnosis codes
and meningitis which is not an ASH condition.
20
Well managed diabetes is HbA1c < 64mmol/mol.
21
This indicator looks at the average number of decayed, missing, and filled teeth in year 8 children with caries (11-13
year old children).
16Output class 3: Intensive assessment and treatment
Intensive assessment and treatment services are delivered by a range of secondary, tertiary
and quaternary providers using public funds. These services are usually integrated into
facilities that enable co-location of clinical expertise and specialized equipment such as a
‘hospital’. These services are generally complex and provided by health care professionals
that work together.
They include: (1) Ambulatory services (including outpatient, district nursing and day
services) across the range of secondary preventive, diagnostic, therapeutic, and rehabilitative
services. (2) Inpatient services (acute and elective streams) including diagnostic, therapeutic
and rehabilitative. (3) Emergency Department services including triage, diagnostic,
therapeutic and disposition services.
On a continuum of care these services are at the complex end of treatment services.
Reference Target/Est. Baseline data
Outputs measured by Baseline
Previous New 2019/20 date
Mental Health and Addiction services
Age 0-19 Age 0-19
Māori: 4.90% Māori: 4.50%
Other: 4.00% Other: 3.6%
Total: 4.25% Total: 3.90%
Age 20-64 Age 20-64
Access to mental health services: Māori: 8.89% Māori: 9.80% Q4 – 2018/19
PP6 MH01
No. of mental health clients seen Other: 4.06% Other: 9.8%
Total: 4.82% Total: 5.20%
Age 65+ Age 65+
Māori: 2.03% Māori: 2.50%
Other: 2.00% Other: 1.8%
Total: 2.03% Total: 1.90%
Q2 - 2018/19
Percentage of clients with transition
PP7 MH02 ≥95% 44% (Oct-Dec
(discharge) plan
2018)*
Q2 - 2018/19*
Percentage of clients with a wellness
PP7 MH02 ≥95% 17% (Oct-Dec
plan
2018)
Percentage of patients 0-19 years
referred to non-urgent child & Q3 - 2018/19*
PP8 MH03 ≥80% 57.5%
adolescent mental health services (Jan-Dec 2018)
and seen within 3 weeks
Percentage of patients 0-19 years
referred to non-urgent child & Q3 - 2018/19*
PP8 MH03 ≥80% 84.5%
adolescent mental health services (Jan-Dec 2018)
and seen within 8 weeks
Percentage of patients 0-19 years
referred to non-urgent child & Q3 - 2018/19*
PP8 MH03 ≥95% 81.0%
adolescent addiction services and (Jan-Dec 2018)
seen within 3 weeks
Percentage of patients 0-19 years
referred to non-urgent child & Q3 - 2018/19*
PP8 MH03 ≥95% 91.4%
adolescent addiction services and (Jan-Dec 2018)
seen within 8 weeks
Planned and Acute (Emergency Department) inpatient/outpatient
Planned care interventions –
PP45 SS07 5,795 100% 2018/19
Inpatient Surgical Discharges
Planned care interventions – Minor
PP45 SS07 2,525 100% 2017/18
Procedures
* 3DHB (Wairarapa, Capital & Coast, and Hutt Valley) performance data.
17Reference Target/Est. Baseline data
Outputs measured by Baseline
Previous New 2019/20 date
Planned care timeliness: Number of
Patients waiting longer than four
- ESPI 2 0 133 April 2019
months for their first specialist
assessment (FSA). “ESPI 2”
Planned care timeliness: Number of
Patients given a commitment to
- ESPI 5 0 187 April 2019
treatment but not treated within four
months. “ESPI 5”
Percentage of patients admitted,
12 months to
discharged or transferred from ED HT1 SS10 95% 90.01%
Q3 1819
within 6 hours
Total: 12.0%
Standardised acute readmission to YE Sep 18
OS8 SS 12% Māori: 14.1%
hospital
Pacific: 11.5%
Weighted average score in the
SI8 PH01 8.8 8.5 Nov 2018
Inpatient Experience Survey
Cancer services
Percentage of patients receiving
their first cancer treatment (or other Q3 - 2018/19
PP30 SS01 ≥85% 89.23%
management) within 31 days from (Jan-Mar 2019)
date of decision-to-treat
Percentage of patients with a high
suspicion of cancer and a need to be
Q2 - 2018/19
seen within 2 weeks that received
HT SS11 ≥90% 92.3% (Oct-Dec
their 1st cancer treatment (or other
2018)
management) within 62 days of
being referred
Quality and Patient Safety
Rate of inpatient falls resulting in a
- HVPI ≤ 0.07 0.07 2018/19
fracture per 1,000 bed days
Rate of hospital acquired pressure
- HVPI ≤0.59 0.5922 2018/19
injuries per 1,000 bed days
Output class 4: Rehabilitation and Support
22
The total bed days across all Hutt Hospital wards in 2018/19 was 8,4534.
18 Rehabilitation and support services are delivered following a ‘needs assessment’ process and
co-ordination input by NASC Services for a range of services including palliative care, home-
based support and residential care services.
On a continuum of care these services will provide support for individuals.
Note Target/Estimate Baseline data
Outputs measured by Baseline
Previous New 2019/20 date
Disability care services
% of hospital staff that have
20% Jul-18 to
completed the Disability - HVPI 100%
(Hutt Valley) Jun-19
Responsiveness eLearning Module
Number of HVDHB Disability 1
- HVPI 3 2018/19
Forums Forecast
Number of sub-regional Disability 1
- HVPI 1 2018/19
Forums Forecast
% of the HVDHB domiciled Maori: 13%
Maori: 17%
population with a Disability Alert - HVPI Pacific: 6% 2018/19
Pacific: 8%
who are Māori or Pacific Forecast
Total number of Disability alert
- HVPI ≥ 4900 7,752 2018/19 Q2*
registrations
Health of Older People (HOP) services
Number of older people (65 and
over, or younger if identified as a Q1 - 2019/19
falls risk) that have received in- PP23 SS04 70 35 (Jul-Sep
home strength and balance 2018)
programmes (new starters)
Number of older people (65 and
over, or younger if identified as a Q1 - 2019/19
falls risk) that have received PP23 SS04 600 450 (Jul-Sep
community/group strength and 2018)
balance programmes
* 3DHB (Wairarapa, Capital & Coast, and Hutt Valley) performance data.
Output Class Financials
19Prevention
Forecast Statement of Financial Performance
For the Year Ended 30 June
$000s 2017\18 2018\19 2019\20 2020\21 2021\22 2022\23
Audited Forecast Plan Plan Plan Plan
Income
Operating Income 20,307 25,023 25,059 25,523 25,998 26,485
Interest Income 26 28 28 28 28 28
Total Income 20,334 25,050 25,087 25,551 26,026 26,513
Expenditure
Personnel Costs 12,797 12,660 13,510 13,915 14,332 14,762
Depreciation 463 257 339 339 339 339
Outsourced Services 1,346 1,363 1,684 1,698 1,713 1,728
Clinical Supplies 504 563 585 585 588 591
Infrastructure and Non Clinical Expenses 530 758 535 538 540 543
Other District Health Boards - 1,012 237 244 252 260
Non Health Board Providers - 3,398 4,407 4,544 4,685 4,831
Capital Charge 471 467 525 525 525 525
Interest Expense - - - - - -
Other 881 293 554 556 558 561
Internal Allocations 4,501 4,016 4,017 4,017 4,017 4,017
Total Expenditure 21,493 24,786 26,391 26,959 27,549 28,155
Net Surplus / (Deficit) (1,159) 265 (1,304) (1,409) (1,523) (1,643)
Early Detection & Management
Forecast Statement of Financial Performance
For the Year Ended 30 June
$000s 2017\18 2018\19 2019\20 2020\21 2021\22 2022\23
Audited Forecast Plan Plan Plan Plan
Income
Operating Income 251,917 91,594 161,906 166,456 171,143 175,970
Interest Income 17 18 18 18 18 18
Total Income 251,934 91,612 161,924 166,474 171,161 175,988
Expenditure
Personnel Costs 10,369 11,594 12,969 13,358 13,759 14,172
Depreciation 930 806 824 824 824 824
Outsourced Services 1,272 1,568 1,088 1,116 1,144 1,174
Clinical Supplies 446 533 597 597 600 603
Infrastructure and Non Clinical Expenses 1,091 802 1,033 1,038 1,043 1,049
Other District Health Boards 88,442 20,508 36,293 37,422 38,586 39,786
Non Health Board Providers 143,337 49,750 105,214 108,486 111,860 115,339
Capital Charge 1,031 1,029 1,067 1,067 1,067 1,067
Interest Expense - - - - - -
Other 515 554 576 579 582 585
Internal Allocations 3,973 4,263 4,263 4,263 4,263 4,263
Total Expenditure 251,407 91,405 163,925 168,750 173,728 178,860
Net Surplus / (Deficit) 527 206 (2,001) (2,277) (2,568) (2,872)
20Intensive Assessment & Treatment
Forecast Statement of Financial Performance
For the Year Ended 30 June
$000s 2017\18 2018\19 2019\20 2020\21 2021\22 2022\23
Audited Forecast Plan Plan Plan Plan
Income
Operating Income 205,156 400,215 330,482 338,740 347,234 355,971
Interest Income 553 421 503 509 514 520
Total Income 205,709 400,636 330,986 339,248 347,749 356,492
Expenditure
Personnel Costs 147,842 161,958 164,428 169,361 174,441 179,675
Depreciation 12,262 13,095 14,490 14,490 14,490 14,490
Outsourced Services 14,220 13,466 9,159 9,301 9,446 9,595
Clinical Supplies 23,765 21,458 20,344 20,344 20,446 20,548
Infrastructure and Non Clinical Expenses 11,834 12,234 12,922 12,981 13,040 13,099
Other District Health Boards - 68,771 49,490 51,029 52,616 54,252
Non Health Board Providers - 112,062 58,651 60,475 62,356 64,295
Capital Charge 8,573 10,558 10,460 10,460 10,460 10,460
Interest Expense 51 28 71 71 71 71
Other 4,518 5,648 4,632 4,649 4,672 4,695
Internal Allocations (9,420) (9,103) (9,089) (9,089) (9,089) (9,089)
Total Expenditure 213,645 410,174 335,558 344,071 352,949 362,092
Net Surplus / (Deficit) (7,937) (9,538) (4,573) (4,823) (5,201) (5,600)
Rehabilitation & Support
Forecast Statement of Financial Performance
For the Year Ended 30 June
$000s 2017\18 2018\19 2019\20 2020\21 2021\22 2022\23
Audited Forecast Plan Plan Plan Plan
Income
Operating Income 72,468 55,409 75,515 77,596 79,739 81,946
Interest Income 1 1 1 1 1 1
Total Income 72,468 55,410 75,516 77,597 79,740 81,947
Expenditure
Personnel Costs 4,317 4,478 4,856 5,002 5,152 5,307
Depreciation 18 19 16 16 16 16
Outsourced Services 164 249 268 275 283 291
Clinical Supplies 1,439 1,506 1,325 1,325 1,331 1,338
Infrastructure and Non Clinical Expenses 170 102 107 108 108 109
Other District Health Boards 4,599 3,511 14,631 15,086 15,555 16,039
Non Health Board Providers 59,044 43,728 53,549 55,214 56,931 58,702
Capital Charge 16 16 18 18 18 18
Interest Expense - - - - - -
Other 79 60 58 58 58 58
Internal Allocations 946 824 810 810 810 810
Total Expenditure 70,791 54,493 75,638 77,913 80,264 82,689
Net Surplus / (Deficit) 1,677 917 (122) (315) (524) (742)
21Forecast Financial Statements
Hutt Valley District Health Board
Forecast Statement of Financial Performance
For the Year Ended 30 June
$000s 2017\18 2018\19 2019\20 2020\21 2021\22 2022\23
Audited Forecast Plan Plan Plan Plan
Income
Operating Income 549,848 572,240 595,574 611,011 626,897 643,246
Interest Income 597 468 550 556 561 567
Total Income 550,445 572,708 596,124 611,566 627,458 643,812
Expenditure
Personnel Costs 175,325 190,689 198,820 204,685 210,825 217,150
Depreciation 13,673 14,177 15,561 15,639 15,717 15,796
Outsourced Services 17,002 16,645 12,462 12,820 13,059 13,303
Clinical Supplies 26,153 24,060 24,402 24,455 24,577 24,700
Infrastructure and Non Clinical Expenses 13,625 13,896 14,111 14,176 14,243 14,310
Other District Health Boards 93,040 93,802 101,203 104,351 107,596 110,942
Non Health Board Providers 202,382 208,937 219,007 225,818 232,841 240,082
Capital Charge 10,092 12,070 12,720 12,783 12,847 12,912
Interest Expense 51 28 71 72 72 72
Other 5,992 6,554 5,907 5,979 6,009 6,039
Internal Allocations (0) 0 0 0 0 0
Total Expenditure 557,336 580,858 604,265 620,778 637,787 655,307
Net Surplus / (Deficit) (6,891) (8,150) (8,141) (9,212) (10,329) (11,495)
* Please note that the 2018/19 forecast figures exclude adjustments for year-end provisions i.e. Holidays Act, Impairments.
** Please note that these financials have not been reconciled with the details in the Statement of Service Performance.
22* Please note that the 2018/19 forecast figures exclude adjustments for year-end provisions i.e. Holidays Act, Impairments.
** Please note that these financials have not been reconciled with the details in the Statement of Service Performance.
23Financial Assumptions
The assumptions are the best estimates of future factors that affect the predicted financial results. As such
there is necessarily a degree of uncertainty about the accuracy of the predicted result, which is unable to be
quantified.
Factors which may cause a material difference between these forecast financial statements and the actual
financial results would be a change in the type and volume of services provided, significant movement in
staff levels and remuneration, plus unexpected changes in the cost of goods and services required to provide
the planned services.
Revenue
PBFF Increase of 3.32% from Funding Envelope guidance (national average 4.25%) for 2019/20
IDF levels based on Funding Envelope or agreed changes within the sub-region.
Expenditure
Supplies and expenses based on current contract prices where applicable
Depreciation to include base, plus work in progress, plus new purchases
Capital Charge at 6% payable half yearly
Total Capital Expenditure of up to $13.4 million p.a. is planned for 2019/20
Capital Plan: The operational capital funding requirements for the Provider Arm will be met from cash flow
from depreciation expense and prioritised with the clinical leaders both within the Directorates and across the
Provider Arm. Only items of a legal & safety nature, or essential to support the District Annual and Strategic
Plans have been included in the CAPEX budget. The baseline CAPEX for 2019/20 of $7.72 million and $5.71
million for strategic capex is required to be funded internally.
Equity Drawing: No additional deficit support has been requested for the 2019/20 financial year.
Core Debt: The Core CHFA debt of $79 million was converted from debt to equity on 15 February 2017. No
further interest payments are due with the Ministry of Health funding the difference between interest
expense and the increase in capital charge expense for 2 years.
Working capital: The Board has a working capital facility with the BNZ, which is part of the national DHB
collective banking arrangement negotiated by NZHP. This facility is limited to one month’s provider’s
revenue, to manage fluctuating cash flow needs for the DHB.
Gearing and Financial Covenants: No gearing or financial covenants are in place.
Asset Revaluation: Current policy is for land and buildings to be revalued every 3 – 5 years. A full revaluation
was completed as at 30 June 2018. The impact of the revaluation was to increase the value of Land and
Buildings by a combined total of $38.25 million. The increase in the value of the assets was matched by an
increase to the revaluation reserve. There is also a consequent increase to both depreciation and capital
charge from 2018/19 on.
Strategy for disposing of assets: The DHB regularly reviews its fixed asset register, and undertakes fixed
asset audits in order to dispose of assets which are surplus to requirements. This ensures that the DHB
reduces its level of capital to the minimum consistent with the supply of contracted outputs.
Disposal of Land: All land that has legally been declared to be surplus to requirements will be disposed of
following the statutory disposal process defined in the Public Works Act 1991, the Health Sectors Act 1993,
the New Zealand Public Health and Disabilities Act 2000, the Reserves Act 1977 and the Maori Protection
Mechanism Regulations set up to fulfil the Crown’s obligations under the Treaty of Waitangi. No land has
been identified as surplus to requirements within this plan.
24You can also read