IAB-DISCUSSION PAPER 7|2021 Industry interconnectedness and regional economic growth in Germany
←
→
Page content transcription
If your browser does not render page correctly, please read the page content below

v

IAB-DISCUSSION PAPER
Articles on labour market issues

7|2021 Industry interconnectedness and regional economic
growth in Germany
Shade T. Shutters, Holger Seibert, Bastian Alm, Keith Waters

  ISSN 2195-2663

Industry interconnectedness and regional
economic growth in Germany

Shade T. Shutters (Arizona State University & Global Climate Forum, Berlin),
Holger Seibert (Institute for Employment Research, Berlin),
Bastian Alm (Embassy of the Federal Republic of Germany, Washington, D.C.),
Keith Waters (George Mason University)

Mit der Reihe „IAB-Discussion Paper“ will das Forschungsinstitut der Bundesagentur für Arbeit den
Dialog mit der externen Wissenschaft intensivieren. Durch die rasche Verbreitung von Forschungs-
ergebnissen über das Internet soll noch vor Drucklegung Kritik angeregt und Qualität gesichert
werden.

The “IAB Discussion Paper” is published by the research institute of the German Federal Employ-
ment Agency in order to intensify the dialogue with the scientific community. The prompt publi-
cation of the latest research results via the internet intends to stimulate criticism and to ensure
research quality at an early stage before printing.
Contents
1 Introduction .......................................................................................................................6
2 Materials and Methods........................................................................................................7
2.1 Data and sources.................................................................................................................. 7
2.2 Quantifying interdependence, a pairwise measure of industry interdependence ........... 8
2.3 Quantifying tightness, a regional aggregate measure of industry interdependence........ 8
2.4 Empirical treatments ........................................................................................................... 9
3 Results and discussion ........................................................................................................9
3.1 Industry interdependence ................................................................................................... 9
3.2 The German industry network........................................................................................... 10
3.3 LMRs and tightness ............................................................................................................ 11
3.4 Spatial distribution and autocorrelation of tightness ...................................................... 12
3.5 Tightness, productivity, and economic shocks ................................................................ 13
3.6 A first comparison of tightness effects and COVID-19 implications ................................. 14
4 Conclusion........................................................................................................................ 16
Figures
Figure 1: Constructing the 2007 German industry interdependence network .................... 10
Figure 2: Comparison of two German labor market regions (LMRs) .................................... 11
Figure 3: Spatial distribution and autocorrelation of LMR tightness values, 2007 .............. 13
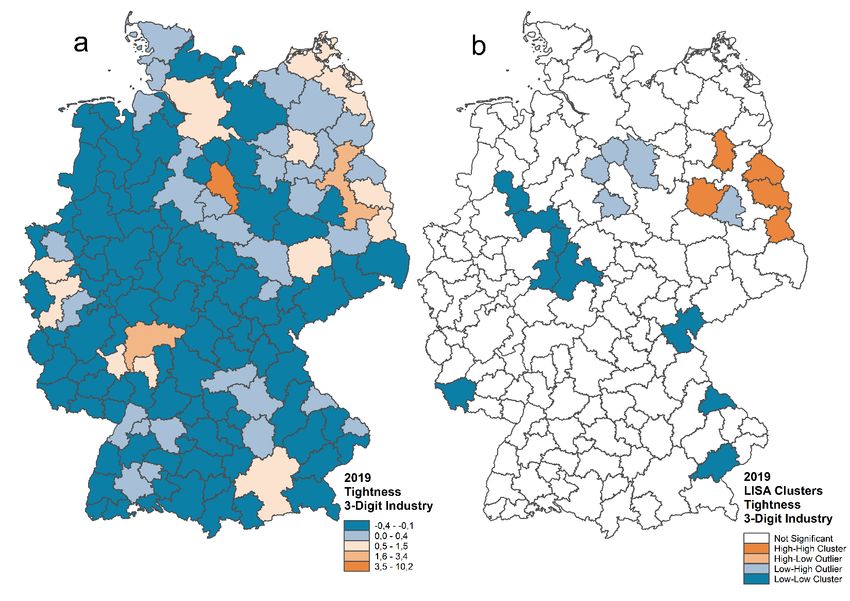
Figure 4: Current spatial distribution and autocorrelation of LMR tightness values, 2019
and 2020 .................................................................................................................. 15
Tables
Table 1: Highest and lowest ranked Labor Market Regions based on 2007 tightness
values T .................................................................................................................... 12
Table 2: Correlation between tightness T and change in GDP per worker over the
subsequent two years ............................................................................................. 14
Abstract
Urban systems, and regions more generally, are the epicenters of many of today’s social issues. Yet
they are also the global drivers of technological innovation and thus it is critical that we under-
stand their vulnerabilities and what makes them resilient to different types of shocks. We take re-
gions to be systems composed of internal networks of interdependent components. As the con-
nectedness of those networks increases, it allows information and resources to move more rapidly
within a region. Yet, it also increases the speed and efficiency at which the effects of shocks cas-
cade through the system. Here we analyze regional networks of interdependent industries and
how their structures relate to a region’s vulnerability to shocks. Methodologically, we utilize a met-
ric of economic connectedness, known as tightness, which attempts to quantify the ambiguous
notion of a region’s internal connectedness relative to other regions. Using industry employment,
we calculate the economic tightness of German regions during the Great Recession, comparing it
to each region’s economic performance during the shock (2007–2009) and during recovery (2009–
2011). We find that tightness is negatively correlated with changes in economic performance dur-
ing the shock but positively correlated with performance during recovery. This suggests that re-
gional economic planners face a tradeoff between being more productive or being more vulnera-
ble to the next economic shock. Finally, we speculate on how these findings from the Great Reces-
sion may highlight potential implications of the ongoing COVID-19 pandemic and suggest future
research that would compare outcomes of these two global shocks.

Zusammenfassung
Urbane Systeme und Regionen im Allgemeinen sind die Epizentren vieler heutiger sozialer Heraus-
forderungen. Sie sind aber auch die globalen Treiber für technologische Innovationen. Daher ist es
entscheidend, dass wir ihre Schwachstellen verstehen und wissen, was sie widerstandsfähig ge-
genüber verschiedenen Arten von Schocks macht. Wir betrachten Regionen als Systeme, die aus
internen Netzwerken von voneinander abhängigen Komponenten bestehen. Wenn die Stärke die-
ser Netzwerke zunimmt, können Informationen und Ressourcen schneller innerhalb einer Region
fließen. Dies kann jedoch auch die Geschwindigkeit und Stärke erhöhen, mit der sich die Auswir-
kungen von Schocks kaskadenartig durch das System ausbreiten können. Im vorliegenden Beitrag
analysieren wir regionale Netzwerke von voneinander abhängigen Industrien und wie ihre Struk-
turen mit der Anfälligkeit einer Region für Schocks zusammenhängen. Methodisch verwenden wir
eine Metrik der wirtschaftlichen Verflechtung (“tightness“), welche versucht, den vielschichtigen
Begriff der internen Verflechtung einer Region relativ zu anderen Regionen zu quantifizieren. An-
hand von Beschäftigungsdaten auf Branchenebene berechnen wir die wirtschaftliche Verflechtung
der deutschen Regionen während der globalen Wirtschafts- und Finanzkrise und vergleichen sie
mit der Entwicklung der Wirtschaftsleistung der einzelnen Regionen während des Schocks (2007–
2009) und während der Erholung (2009–2011). Wir stellen fest, dass ein hohes Maß an tightness
negativ mit der Wirtschaftsentwicklung während des Schocks, aber positiv mit der während der

IAB-Discussion Paper 7|2021                                                                          4

Erholung korreliert ist. Dies deutet darauf hin, dass im Rahmen der kommunalen und regionalen
Wirtschaftspolitik ein ausgewogener Mittelweg zwischen Produktivität und Resilienz gefunden
werden sollte. Abschließend stellen wir erste Überlegungen dazu an, ob diese Erkenntnisse aus
der Weltwirtschafts- und Finanzkrise auch auf die Implikationen der COVID-19-Pandemie übertra-
gen werden können.

JEL classification
J40, R00, R11, R12, R58

Keywords
co-occurrence, COVID-19 pandemic, Great Recession, labor dynamics, industry structure, Panar-
chy, regional science, resilience, workforce, regional policy

Acknowledgements

We would like to thank Jeanette Carstensen sincerely for her effort and care in reformatting the
original manuscript into this IAB Discussion Paper.

IAB-Discussion Paper 7|2021                                                                        5
1         Introduction
Many of today’s pressing social, economic, and ecological issues are focused in urban systems
(Buhaug/Urdal 2013, President’s Council of Advisors on Science and Technology 2016). They are
epicenters of pollution, crime, inequality, and health problems. Yet urban systems, and the regions
in which they are embedded, are also epicenters of creativity. They are the global drivers of inno-
vation and productivity that fuel the global economy and the emergence of new technologies
(Batty 2018, Vandecasteele et al. 2019). Being the focal point of so many social, ecological, and
economic forces makes the management of regional development extremely difficult.
This complexity of regions has often been an obstacle to understanding and guiding regions and
has resulted in policy interventions that have unintended and sometimes negative consequences.
Fortunately, complexity science has begun to mature to the point that it is enabling researchers to
move beyond lingering obstacles to a fundamental understanding of regional systems. Here we
adopt the framework that regions are complex adaptive systems (Batty 2013, Lobo et al. 2020,
McPhearson et al. 2016) and they exhibit a key attribute of such systems, namely internal networks
of interdependent components (Barthelemy 2016, Shutters et al. 2018). As the internal connected-
ness of those networks increases, it can impact the ability for information and resources to move
more rapidly and efficiently within a region. Yet, it also increases the speed and efficiency at which
the effects of shocks cascade through the system.
In this study we focus on regional networks of interdependent economic components and how
their structures relate to a region’s vulnerability to shocks. To do so, we utilize a metric of eco-
nomic connectedness, known as tightness, which attempts to quantify the rather ambiguous no-
tion of a region’s aggregate degree of internal interdependencies relative to other regions. Previ-
ously, this measure has only been analyzed in United States (U.S.) metropolitan areas (Shut-
ters/Waters 2020, Shutters/Muneepeerakul/Lobo 2015, Waters/Shutters 2020) and has shown that
regional tightness is positively correlated with more severe declines in economic performance fol-
lowing a shock (Shutters/Muneepeerakul/Lobo 2015). Thus, economic tightness is intimately
linked to resilience and its importance lay in its potential ability to help anticipate impacts of sys-
tem shocks, particularly economic shocks.
In our empirical analysis, we focus on Europe’s biggest economy, Germany, for various reasons.
Firstly, the country has emerged as one of the most resilient economies following thorough labor
market and structural reforms at the beginning of the 21st century. Its gains in competitiveness
vis-à-vis countries like France, Italy and Spain suggest that it was not the depreciation of the euro
that served as the key driver of the German economy, but that it was Germany’s high relative
productivity gains (Dustmann et al. 2014). Our study focuses on another potential factor behind
the economic success of Germany, the sectoral connectedness as a proxy for the strengths of re-
gional supply chains as well as networks and thus important parameters for resilience. Secondly,
regional disparities in Germany, even if decreasing between West and East Germany after the reu-
nification of both parts in 1990, still persist (Heise/Porzio 2019) and were used as a justification for
allocating more than 45 billion Euro for investment subsidies by the main instrument of German
regional policy over the last 30 years (Bade/Alm/Weins 2020). Our analytical approach allows dis-
cussing if an increase in regional economic connectedness could lead to a decrease in regional

IAB-Discussion Paper 7|2021                                                                            6
disparities. Finally, because German labor market regions (LMRs) cover all of Germany, they pro-
vide a valuable contrast to studies of U.S. metropolitan statistical areas, which cover only larger,
urbanized areas of the U.S.
While others have used skills data to analyze resilience of a single German state
(Otto/Nedelkoska/Neffke 2014), here we use industry employment data to calculate the economic
tightness of all 141 German LMRs. We then compare that metric to each region’s economic perfor-
mance during the shock (2007–2009) and during the subsequent recovery (2009–2011). Using per
worker GDP as a measure of economic performance, we find that tightness is negatively correlated
with changes in economic performance during the shock but positively correlated with the same
indicator during recovery. In other words, regions with tighter economies suffered more severely
during a shock but had larger growth rates in the absence of a shock.
Based on the latest available employment statistics of the Federal Employment Agency (Bun-
desagentur für Arbeit), we also analyze the potential relationship between the economic tightness
and the employment development of the German labor market regions in the first months of the
COVID-19 pandemic. We observe that tightness seemed to play a significant role in regional eco-
nomic development, even if the supply and demand triggered by the COVID-19 pandemic hit the
German economy significantly more symmetrical than the 2007–2009 Great Recession as it im-
pacted public life and therefore wide parts of the service and retail trade sector.
These overall results support the notion that economic interdependence can make regions more
economically productive but also more precarious. This result concurs with the so-called Panarchy
theory of complex adaptive systems (Holling 2001, Simmie/Martin 2010), which asserts that sys-
tems with higher internal connectedness are more efficient, but also more brittle and vulnerable
to disruption. Thus, regional economic planners must navigate a tradeoff between being more
productive or being more vulnerable to the next economic shock (Lobo et al. 2020, National Sci-
ence Foundation Sustainable Urban Systems Subcommittee 2018).

2         Materials and Methods
2.1       Data and sources
Our geographical units of analysis are the 141 labor market regions (LMRs) of Germany as defined
by Kosfeld and Werner (Kosfeld/Werner 2012). LMRs are composed of one or more of the 401 Ger-
man coiunties (‘Landkreise’ and ‘kreisfreie Städte’) having close commuter links with each other
and are considered to be essentially independent economic units. ‘Landkeise’ and ‘kreisfreie
Städte’ comprise the NUTS3 units (Nomenclature des unités territoriales statistiques) of Germany
and are roughly analogous to U.S. counties. Thus, we refer to these 401 smaller units as counties
hereafter.
Industry employment data were supplied by Germany’s Institute for Employment Research (IAB or
Institut für Arbeitsmarkt- und Berufsforschung). Employment is analyzed at both 3-digit and 4-digit
industry code aggregation levels.

IAB-Discussion Paper 7|2021                                                                        7
To assess regional economic performance, we use regional gross domestic product (GDP) per cap-
ita. These estimates are taken from Federal Statistical Office (Destatis) data at the county level,
aggregated to LMRs.

2.2 Quantifying interdependence, a pairwise measure of industry
interdependence
To quantify an aggregate measure of interdependence characterizing each LMR’s economy we first
determine which industries are present or absent in each LMR. While a region may have employ-
ment in many industries, we use a threshold of relative abundance to determine presence or ab-
sence for our analysis. We apply the traditional metric of location quotient (LQ):
               ( ei,m⁄∑i ei,m )
LQi,m =                             .          (1)
           (∑m ei,m ⁄∑m ∑i ei,m )

where e is the employment in industry i in LMA m . Thus, LQ – also known as Revealed Compara-
tive Advantage or RCA – is a region’s proportion of employment in i compared to the national pro-
portion. Following (Muneepeerakul et al. 2013) we take an industry i to be present in LMR m if
LQi,m ≥ 1 and absent if LQi,m < 1. This results in an LMR × industry matrix of presence-absence
data.
This matrix is then used to calculate the probability that two industries i and j will co-occur in a
random LMR. Using a variant of mutual information defined in (Muneepeerakul et al. 2013) we then
quantify the interdependence x between any two industries i and j as
           P[LQi,m >1,LQj,m >1]
xi,j =                                  − 1,   (2)
         P[LQi,m′ >1]P[LQj,m′′ >1]

where m, m′, and m′′ denote randomly selected LMRs. The result is an industry × industry matrix
of interdependence values. Two industries that co-occur in LMRs more frequently than expected
by chance will have a positive interdependence value, while two industries that co-occur less fre-
quently than expected will have negative interdependence. We take this matrix of interdepend-
ence values to be the adjacency matrix of a complete weighted network describing how industries
interact across Germany. Note that xi,j = xj,i so that the adjacency matrix is symmetric and thus
the network is undirected.

2.3 Quantifying tightness, a regional aggregate measure of industry
interdependence
Using the methodology outlined in (Shutters/Muneepeerakul/Lobo 2015) we then calculate an ag-
gregate measure of LMR interdependence, or tightness. This method dictates that we first assign
an LMR-specific weight L to each pair of industries present in an LMR using the national-level pair-
wise interdependence x and weighting by the local proportions of employment in each industry:
           (ei,m +ej,m )xi,j
Li,j,m =                                       (3)
              2 ∑i ei,m

where i and j are industries that are both present in LMR m. We then average L across the total
number of links in an LMR’s industry subnetwork to produce an industry-based tightness metric:

IAB-Discussion Paper 7|2021                                                                        8
2 Nm Tm = ∑i
3.2        The German industry network
Calculating interdependence between all industry pairs results in an industry × industry matrix of
interdependence values. This matrix is taken to be the adjacency matrix of a complete and
weighted national-level industry network, in which nodes are industries and weights are pair-wise
interdependence values. The resulting network, shown in Figure 1, was created using MatLab’s
nonclassical multidimensional scaling function mdscale. Industry pairs that are highly interde-
pendent tend to be near to each other in this network, while pairs with a low or negative interde-
pendence tend to be farther apart.
In any LMR there exists only a subset of all possible industries. This industry portfolio represents
an economic signature of the LMR and can be shown as a subnetwork of the national-level inter-
dependence network. We take this subnetwork to be the “location” of a an LMR within a national
map. Examples of two LMR subnetworks are shown in Figure 2. These examples demonstrate vis-
ually the concept of tightness as nodes are clustered more closely together in the LMR with higher
tightness (Hamburg) and more dispersed in the region with lower tightness (Weißenburg-Gunzen-
hausen).

Figure 1: Constructing the 2007 German industry interdependence network

                                j

                        xi,j > 0
                 i

  i
                           xi,j < 0

                                                      j
Industries that tend to co-occur together in regions have x > 0 and will tend to be closer to each other in the final network. In-
dustries that rarely occur together will have x ~ 0 or x < 0 and will be pushed apart in the final network. Combining all network
pairs results in the final German industry network (left). Each node represents a 3-digit industry and, while the placement of
nodes is generally arbitrary, the distance between any two nodes is a function of an industry’s interdependence x with all other
industries. Links between nodes have been removed for visual clarity.
Source: Employment statistics of the Federal Employment Agency, Germany. Own calculations.

IAB-Discussion Paper 7|2021                                                                                                     10
Figure 2: Comparison of two German labor market regions (LMRs)
Hamburg Weißenburg-Gunzenhausen
T = 0.95 T = -0.28
The subnetworks locations of Hamburg and Weißenburg-Gunzenhausen are shown within the 2007 German industry network of
Figure 1. Qualitatively, the density of Hamburg nodes is higher than those of Weißenburg-Gunzenhausen. We quantify this visu-
ally intuitive difference in a regional tightness metric T. Links have been removed for clarity.
Source: Employment statistics of the Federal Employment Agency, Germany. Own calculations.
The network shown in Figure 1 and Figure 2 was constructed with 2007 employment data at the 3-
digit industry level for 141 LMRs. Though not shown, we also constructed networks for each of the
other combinations of year, industry aggregation level, and spatial unit, as described in the empir-
ical treatments of the methods section. Thus, we ultimately created eight national industry inter-
dependence networks (2007/2009, 3-/4-digit industry code, 141 LMRs/401 counties).
3.3 LMRs and tightness
Applying industry interdependence values to the eight networks described in the previous section,
we then located the subnetwork of every German spatial unit within the corresponding network
and calculated its tightness T. A list of LMRs having highest and lowest 2007 tightness values using
3-digit industry data are presented in Table 1.
The distribution of tightness values across regions is highly skewed with only four regions being
more than two standard deviations from the mean T value. The highest level of interconnected-
ness in the LMR Wolfsburg is due to the high importance of the automotive industry there, which
is much more pronounced in this region than in any other German LMR. About one third of all em-
ployees in and around Wolfsburg work in the automotive and automotive supplier industry in 2008.
Employee leasing, accounting for 6 percent of all employees, may also play a role here.
As the capital region, Berlin is strongly characterized by employees in political interest groups, but
also in information technology services, universities and research institutes, as well as credit insti-
tutes. The Frankfurt am Main region is Germany's central banking district. In addition, many em-
ployees in aviation, management consultancies are concentrated here. The regions of Frankfurt
an der Oder and Cottbus are characterized by larger shares of employees in steel production and
lignite mining, respectively, and power generation (coal-fired power generation). Both sectors are
IAB-Discussion Paper 7|2021 11characterized by significant direct and indirect employment effects on other economic sectors in the region but also beyond. LMRs at the lower end of the tightness table, on the other hand, are predominantly characterized by public-sector industries such as hospitals, geriatric care, social services, public administration, and retail. In addition, the five regions feature singular concentrated manufacturing industries that appear to have fewer links to other industries, such as furniture manufacturing or plastic goods manufacturing. Table 1: Highest and lowest ranked Labor Market Regions based on 2007 tightness values T Rank Labor Market Region (LMR) T 1) 1 Wolfsburg (007) 8.27 2 Berlin (109) 5.10 3 Frankfurt am Main (043) 2.68 4 Frankfurt an der Oder (110) 2.05 5 Cottbus (118) 1.68 137 Trier (054) -0.61 138 Koblenz (049) -0.61 139 Kleve (027) -0.62 140 Minden (036) -0.64 141 Passau (086) -0.64 1) T presented as the normalized z-score of raw tightness values. Source: Employment statistics of the Federal Employment Agency, Germany. Own calculations. 3.4 Spatial distribution and autocorrelation of tightness Examining the spatial distribution of 2007 tightness we find that LMRs with high tightness are more prevalent in the former East (Figure 3a), while LMRs with low tightness are prevalent in the west and south of Germany. To identify statistically significant clusters of LMRs with high and low tight- ness, we applied Anselin’s Local Moran’s I (Anselin 1995), a metric of spatial association. Spatial clusters are neighboring regions with tightness values more similar to one another than would be anticipated under spatial randomness. The areas of interest are “high-high” and “low-low”, which are statistically significant spatial clusters of high and low tightness respectively. Results pre- sented in Figure 3b confirm that a cluster of labor markets with high tightness existed in 2007 in eastern Germany. IAB-Discussion Paper 7|2021 12
Figure 3: Spatial distribution and autocorrelation of LMR tightness values, 2007

(a) Tightness and (b) Anselin’s Local Moran’s I (LISA) shown here were calculated at the 3-digit industry code level. Clusters
shown in (b) are significant at a confidence level of 0.05 using k-nearest neighbors = 4.
Source: Employment statistics of the Federal Employment Agency, Germany. Own calculations.

3.5        Tightness, productivity, and economic shocks
Having calculated each area’s tightness under each of the eight empirical treatments, we then cor-
related those values with the area’s economic performance. We take 2-year change in per capita
GDP as our measure of economic performance, calculating it for the periods 2007–2009 and 2009–
2011. Correlations for the eight empirical case are presented in Table 2. In all cases, tightness is
negatively correlated with changes in GDP during the shock and positively correlated with changes
in GDP during recovery. Furthermore, we find that correlations are stronger when using 3-digit in-
dustry aggregations versus 4-digit industry aggregations, and they are stronger when using labor
market regions versus counties.
This suggests that LMRs are more functional regarding regional economic attributes than counties.
It also suggests that 4-digit industry aggregations may be too sparse to meaningfully inform our
metric of connectedness. Thus, we focus our discussion of this work primarily on metrics calcu-
lated using LMRs and 3-digit industry data.
Overall, our finding that regions with higher tightness had larger percentage drops in productivity
following a shock is consistent with the Panarchy theory of resilience, which asserts that as sys-
tems increase in connectedness, they become more brittle and fragile (Gunderson/Holling 2002).
This finding also concurs with an analogous study of the effects of the 2007–2009 recession on U.S.
metropolitan statistical areas (Shutters/Muneepeerakul/Lobo 2015).

IAB-Discussion Paper 7|2021                                                                                                      13
Table 2: Correlation between tightness T and change in GDP per worker over the subsequent two years
                                                       Labor Market Regions                                     Counties

 Industry Level                                    3-digit                  4-digit                  3-digit                4-digit
 T (2007) v. GDP change, 2007-2009                -0.22 ***                 -0.19 **                -0.20 ***              -0.09 n/s
 T (2009) v. GDP change, 2009-2011                 0.34 ***                 0.25 **                  0.27 ***              0.14 **v

* significant at p < 0.05; ** significant at p < 0.01; *** significant at p < 0.001; n/s = not significant.
Source: Employment statistics of the Federal Employment Agency, Germany. Own calculations.

However, the fact that regions with high tightness performed better during the recovery phase
should be interpreted with caution. The recovery period following a shock may not be comparable
to periods without shocks and so we cannot conclude that tighter economies are, in general, more
productive.

3.6 A first comparison of tightness effects and COVID-19
implications
At first glance, the impact of the COVID-19 pandemic on the German economy was quite compara-
ble with the Great Recession: the GDP in 2020 declined by 5.0 per cent, which was very similar to
2009 (-5.6 %). But does this correspond with a similar association between tightness and regional
economic performance during these two shocks?
Having demonstrated that tightness in 2007 was correlated with worse performance during the
subsequent shock, we calculate tightness during the first months of the COVID-19 pandemic using
the latest years of available employment data. The spatial distribution of tightness for 2019 and
2020 is presented in Figure 4.
Our analysis suggests that the effect of the COVID-19 pandemic on regional employment (regional
GDP data were not yet available at the time of this study) was very different from the Great Reces-
sion. Comparing September to December 2008 employment development with March to June
2020 regional employment declines are distributed more evenly across counties in the COVID-19
crisis than in the Great Recession. Also short-time work – an instrument of German labor market
policy that subsidizes wages for staff that had otherwise to be laid-off due to the economic condi-
tions – varies much more evenly across regions in the pandemic than in the Great Recession.
Figure 4 also clearly indicates that tightness during the COVID-19 pandemic was not as negatively
correlated with changes in economic performance as during the Great Recession. The crucial fac-
tor for this is that the COVID-19 pandemic was more symmetric in terms of sectors being affected
significantly negative by the supply shock and contraction of demand whereas the Great Recession
primarily hit export-oriented manufacturing industries and only parts of the services sector (espe-
cially financial services). Once more data becomes available on the regional economic perfor-
mance during and after the Covid-19 pandemic, our results should be set into a broader perspec-
tive to cover the impact of tightness on GDP and employment both during a shock and the recov-
ery.

IAB-Discussion Paper 7|2021                                                                                                            14
Figure 4: Current spatial distribution and autocorrelation of LMR tightness values, 2019 and 2020 Tightness (a and c) and Anselin’s Local Moran’s I (LISA) (b and d) were calculated at the 3-digit industry code level. Clusters shown in (b) are significant at a confidence level of 0.05 using k-nearest neighbors = 4. Between 2007 and 2019 the cluster of high-high tightness areas in eastern Germany grew in size while the clusters of low-low tightness in central Germany also grew. Thus, the most recent employment data indicates a growing spatial segregation within Germany in terms of economic tight- ness. Source: Employment statistics of the Federal Employment Agency, Germany. Own calculations. IAB-Discussion Paper 7|2021 15
4         Conclusion
In this study, we have used a novel metric to assess the level of internal connectedness of German
regions and to assess how that measure relates to economic performance during and after the
shock of the Great Recession. Ours is the first study to apply this metric to a country other than the
U.S.
Like U.S. results, we found that regions with more tightly connected industry structures had larger
drops in per capita GDP during the initial shock and larger growth during the recovery. This sug-
gests a tradeoff faced by regional economic policy makers between higher productivity and higher
resilience.
However, our study examined a very specific shock in terms of type and scope and we are careful
not to generalize our results to all shocks a region might face. As shown in section 3.6, pandemics
and other biological threats seem to yield – given a specific industry interconnectedness – differ-
ent economic outcomes, this caution seems to be justified. For other types of shock, such as trade
wars, natural disasters like climate shocks/extreme weather events, or cyber-attacks, our metric
of tightness may also suggest different implications for economic performance.
Further research is needed to clarify the role of industry interconnectedness under different types
of shock. On a national level, our metric could be used to assess if a certain degree of tightness
might increase the resilience or precariousness of supply chains during disruptions, and thus pro-
mote economic and national security as well as the capacity to respond to external shocks.

IAB-Discussion Paper 7|2021                                                                        16
References
Anselin, Luc (1995): Local Indicators of Spatial Association–LISA. In: Geographical Analysis, 27 (2),
    pp. 93–115.
Bade, Franz-Josef; Alm, Bastian; Weins, Sebastian (2020): Employment effects of investment sub-
    sidies by German Regional Policy. In: EconStor Preprints 218843, ZBW – Leibniz Information
    Centre for Economics.
Barthelemy, Marc (2016): The Structure and Dynamics of Cities: Urban Data Analysis and Theoret-
    ical Modeling. Cambridge: Cambridge University Press.
Batty, Michael (2013): The New Science of Cities. Cambridge, Massachusetts: MIT Press.
Batty, Michael (2018): Inventing Future Cities. Cambridge, Massachusetts: MIT Press.
Buhaug, Halvard; Urdal, Henrik (2013): An urbanization bomb? Population growth and social dis-
    order in cities. In: Global Environmental Change, 23 (1), pp. 1–10.
Dustmann, Christian; Fitzenberger, Bernd; Schönberg, Uta; Spitz-Oener, Alexandra (2014): From
    Sick Man of Europe to Economic Superstar: Germany's Resurgent Economy. In: Journal of Eco-
    nomic Perspectives, 28 (1), pp. 167–188.
Essletzbichler, Jürgen (2015): Relatedness, Industrial Branching and Technological Cohesion in US
    Metropolitan Areas. In: Regional Studies, 49 (5), pp. 752–766.
Frenken, Koen; Van Oort, Frank; Verburg, Thijs (2007): Related Variety, Unrelated Variety and Re-
    gional Economic Growth. In: Regional Studies, 41 (5), pp. 685–697.
Gunderson, Lance H.; Holling, C. S. (eds.) (2002): Panarchy: understanding transformations in hu-
    man and natural systems. Washington, DC: Island Press.
Heise, Sebastian; Porzio, Tommaso (2019): Spatial Wage Gaps in Frictional Labor Markets. In: Op-
    portunity and Inclusive Growth Institute, Working Papers No. 29, Federal Reserve Bank of Min-
    neapolis.
Holling, C. S. (2001): Understanding the Complexity of Economic, Ecological, and Social Systems.
    In: Ecosystems, 4 (5), pp. 390–405.
Kosfeld, Reinhold; Werner, Alexander (2012): German Labour Markets—New Delineation after the
    Reforms of German District Boundaries 2007–2011. In: Raumforschung und Raumordnung
    (RuR), 70 (1), pp. 49–65.
Lobo, Jose; Alberti, Marina; Allen-Dumas, Melissa; Arcaute, Elsa; Barthelemy, Marc; Bojorquez
    Tapia, Luis A.; Brail, Shauna; Bettencourt, Luis; Beukes, Anni; Chen, Wei‐Qiang; Florida, Rich-
    ard; Gonzalez, Marta; Grimm, Nancy; Hamilton, Marcus; Kempes, Chris; Kontokosta, Constan-
    tine E.; Mellander, Charlotta; Neal, Zachary P.; Ortman, Scott; Pfeiffer, Deirdre; Price, Michael;
    Revi, Aromar; Rozenblat, Céline; Rybski, Diego; Siemiatycki, Matthew; Shutters, Shade T.;
    Smith, Michael E.; Stokes, Eleanor C.; Strumsky, Deborah; West, Geoffrey; White, Devin; Wu,
    Jingle; Chuqiao Yang, Vicky; York, Abigail; Youn, Hyejin (2020): Urban Science: Integrated The-
    ory from the First Cities to Sustainable Metropolises. In: SSRN Electronic Journal.

IAB-Discussion Paper 7|2021                                                                        17
McPhearson, Timon; Haase, Dagmar; Kabisch, Nadja; Gren, Åsa (2016): Advancing understanding
of the complex nature of urban systems. In: Ecological Indicators, 70 (November 2016),
pp. 566–573.
Muneepeerakul, Rachata; Lobo, José; Shutters, Shade T.; Goméz-Liévano, Andrés; Qubbaj, Murad
R. (2013): Urban Economies and Occupation Space: Can They Get "There" from "Here"? In: Plos
One, 8 (9), e73676.
National Science Foundation Sustainable Urban Systems Subcommittee (2018): Sustainable Ur-
ban Systems: Articulating a Long-Term Convergence Research Agenda. A Report from the NSF
Advisory Committee for Environmental Research and Education. Washington, DC: U.S. Natio-
nal Science Foundation.
O'Clery, Neave; Heroy, Samuel; Hulot, Francois; Beguerisse-Diaz, Mariano (2019): Unravelling the
forces underlying urban industrial agglomeration. In: arXiv, 1903.09279v2.
Otto, Anne; Nedelkoska, Ljubica; Neffke, Frank (2014): Skill-relatedness und Resilienz: Fallbeispiel
Saarland. In: Raumforschung und Raumordnung, 72 (2), pp. 133–151.
President’s Council of Advisors on Science and Technology (2016): Technology and the Future of
Cities: Report to the President. Washington, DC: Executive Office of the President of the United
States, President's Council of Advisors on Science and Technology.
Shutters, Shade T.; Lobo, Jose; Strumsky, Deborah; Muneepeerakul, Rachata; Mellander, Char-
lotta; Brachert, Mathias; Farinha Fernandes, Teresa; Bettencourt, L. M. A. (2018): The relation-
ship between density and scale in information networks: The case of urban occupational net-
works. In: Plos One, 15 (5), e0196915.
Shutters, Shade T., Rachata Muneepeerakul, and José Lobo (2015): Quantifying urban economic
resilience through labour force interdependence. In: Palgrave Communications, 1 (201510),
pp. 1–7.
Shutters, Shade T.; Waters, Keith (2020). Inferring Networks of Interdependent Labor Skills to Illu-
minate Urban Economic Structure. In: Entropy, 22 (10), p. 1078.
Simmie, James; Martin, Ron (2010): The economic resilience of regions: towards an evolutionary
approach. Cambridge Journal of Regions, Economy and Society, 3(1):27-43.
Vandecasteele, Ine; Baranzelli, Claudia; Siragusa, Alice; Aurambout, Jean Philippe (eds.) (2019):
The Future of Cities–Opportunities, challenges and the way forward. Luxembourg: Publica-
tions Office of the European Union.
Waters, Keith; Shutters, Shade T. (2020): Industrial structure and a tradeoff between productivity
and resilience. In: SSRN Electronic Journal. URL: https://doi.org/10.2139/ssrn.3702545.
IAB-Discussion Paper 7|2021 18Imprint IAB-Discussion Paper 7|2021 Date of publication 28 April 2021 Publisher Institute for Employment Research of the Federal Employment Agency Regensburger Str. 104 90478 Nürnberg Germany All rights reserved Reproduction and distribution in any form, also in parts, requires the permission of IAB. Download of this IAB-Discussion Paper http://doku.iab.de/discussionpapers/2021/dp0721.pdf All publications in the series “IAB-Discussion Paper” can be downloaded from https://www.iab.de/en/publikationen/discussionpaper.aspx Website www.iab.de ISSN 2195-2663 Corresponding author Holger Seibert Phone: +49 30 555599-5914 Email: holger.seibert@iab.de
You can also read