ICSE 2018 PC Chairs Report Marsha Chechik, Mark Harman, Tom Zimmerman, Ivica Crnkovic
←
→
Page content transcription
If your browser does not render page correctly, please read the page content below
ICSE 2018 PC Chairs Report
   Marsha Chechik, Mark Harman, Tom Zimmerman, Ivica
                        Crnkovic
        Note: Marsha and Mark take full responsibility for the ICSE’18 process.

    1. Introduction

The submission rate, author, programme committee, and program board surveys all point to a
successful conference overall. In this report, we will focus on those aspects of the process for which we
have data to investigate the behavior of authors and reviewers, and the overall performance
characteristics of the processes adopted.

We will also use this report to highlight those aspects of process which, for this year, differed in
nontrivial ways from previous iterations of the conference, in order to document these the future
reference. We will not consume extra space with discussion of aspects of the conference which remain
relatively invariant from year-to-year, apart from reporting quantitative summary statistics to capture
conference-specific information, in order to facilitate comparison with previous and future years.

Our process used a PB / PC model, with PC members doing the reviewing and PB members eliciting
questions for the rebuttal, facilitating the discussion, helping to converge the decisions to accept or
reject, writing meta-reviews and then meeting in person to discuss all papers for which the PC was
unable to reach consensus. We also used a “heavy” double-blind review model where names of authors
were not revealed until the final decisions (for accepted papers) or never (for rejected papers). We
experimented with an idea of an informal local social cluster (LSC), to facilitate an additional layer of
communication with the PC, in order to help understand the process, improve reviews, or any other
reason where PC members needed to get their voice “heard”.

When the authors submitted their papers, we collected various bibliometric information, such as their
participation in earlier ICSEs and whether some of the authors were students. When PC members
submitted reviews, we also asked them to rank papers using structured criteria: soundness,
significance, reproducibility, novelty, presentation, etc. We then did a survey of authors (relatively late
in the game, in March) w.r.t. their satisfaction with the reviews and their views on the double-blind
process. We also did a survey of PC and PB members w.r.t. their views on the process. In what follows,
we present details about our process, submission and acceptance statistics, details about the expertise
and the PB meeting. We finish the report with our comments on the overall ICSE Technical track paper
review process.

    2. Some historical data
Year Submitted Accepted %
2009 405 50 12
2010 380 52 14
2011 441 62 14
2012 408 87 21
2013 461 85 18
2014 495 99 20
2015 452 82 18
2016 530 101 19
2017 415 67 16
2018 502 105 21
As can be seen from the table, the trend in the number of submissions for ICSE appears to have
stabilized. While the drop in the number of submissions for ICSE 2017 might have been explained by the
3-paper maximum submission policy, ICSE 2018 did not have such restrictions; yet, the number of
submissions was lower than in 2016. The quality of the papers seems to be roughly stable.
3. Basic Process data
In this section, we describe the process flow of the papers entering the reviewing process until they exit,
either as rejected or as accepted. The process followed the following schedule with online discussion
primarily focused on the time when the rebuttals were in and continuing until either the PC was able to
reach an Accept or a Reject decision or until the PB meeting.
Timeline:
• Submission deadline: August 25, 2017
• Bidding on papers + COI (PB): August 27-August 31, 2017
• Bidding on papers + COI (PC): August 27–September 1, 2017
• Assignments for PB out: September 2, 2017
• Checking papers for scope/formatting/anonymity violations (PB): September 3-6, 2017
• Assignments for PC out: September 8, 2017
• First half of reviews due (done by the PC): October 6, 2017
• Review improvement (PB + PC): October 6-20, 2017
• Second half of reviews due (PC): November 3, 2017
• Review improvement (PB + PC): November 4-10, 2017
• Author responses: November 12-15, 2017
• On-line discussion (PB + PC): November 16-December 1, 2017
• Program board meeting: December 6-7, 2017, London UK
• Author notification: December 15, 2017
As stated, 502 papers have been submitted through Easychair. Of them, 106 included an optional zip
file with data, code or any other additional information. In fact, several papers originally had optional
zip files but we had to delete them when double-blind violations in the data were discovered.Conflicts. We began by asking members of the PC and the PB to declare their conflicts with a list of authors. The list consisted of all authors of ICSE’18 submitted papers plus a few extra. The authors, when they submitted their papers, also declared conflict with PC and PB. Double-blind violations and desk rejection. After the bidding, we have allocated papers for each PB member (about 14-16 each), asking them to check the paper for being out of scope and for double-blind violations. Another significant task given to the PB was to check additional data that ICSE authors were allowed to submit (with code, data, etc). for double-blind violations. We used a multi-stage process to detect double-blind violations. First of all, we were indebted to Robert Felt, who provided us with an automated checking process, which consisted of scripts, executed on the PDF files, searching for tell-tale signs such as email addresses, use of pronouns such as ”my” or “we”. Not only did Robert run the script for us, he also looked at the reported violations and helped identify which ones were “true” violations. We also asked the programme board members to check the pile of papers initially assigned to them for obvious violations. One of the PC chairs also spent two days going to every paper looking for such violations. Handling violations required to make a distinction between those we deemed to be flagrant disregard of DBR (as if authors had not even read the submission guide), and those which could, with the most charitable interpretation, be regarded as inadvertent slips. We felt it was important to the algorithmic in the distinction, and also that it was important to err on the side of caution, this being the first year in which double-blind reviewing was applied to ICSE. Therefore, we took the approach that we would desk reject only flagrant violations, where flagrant was defined as including the author names with the title (as in the traditional non-blinded style of papers). For all other situations, where the violation was discovered at some point during the process, authors were given 48-hours to correct this. In all such cases the authors did respond within 48 hours. There were a handful of such cases. At the end of this process, 13 papers have been desk-rejected (either due to double-blind violation, or due to violation of formatting requirements, such as paper being over long or formatted in a single column), and all others entered the review process. PC Reviewing. On September 8, we sent review assignments to PC members. Each received between 14 and 16 papers to review. We followed the strict ½ review deadline, followed by the full review deadline. After each review deadline, the reviews were looked over by PB members, with the goal of improving them, clarifying points, summarizing questions for the authors that they can address in the rebuttal, etc. Overall, 1487 reviews were collected. In cases when the PC member was late with his/her reviews, or when the PB member monitoring the paper felt that the quality of the reviewers was low, we solicited an additional review from a special group of RRRR (Rapid Response Reliable Reviews) – group of 11 PC members who received a lower initial review load, but were asked “to stand by” to do additional reviews if needed. Some of the double-blind violations escaped the original script and looking over by PB members, including, interestingly, author names in headers of even papers (!!!) and related work written in a way that makes is very clear who the authors are. Whenever this occurred, we asked any members of the committee who would become aware of the author names to recuse themselves, reallocating referee assignments, wherever possible, if the problem was spotted sufficiently early in the process. Irrespective of the timing in the process, we gave authors 48 hours to correct the problem. Fortunately, no violations were encountered for the first time within 48 hours of the program board meeting, which would have otherwise challenged the consistency of the process for handling violations .
Rebuttals. All papers have received at least 3 reviews (20 papers received 4), and all were sent for
rebuttal on November 11, with rebuttals due on November 15. All papers had an opportunity to rebut
the reviews in order to improve our confidence in the relevance of the reviews and to reduce the chance
that important aspects were missed or incorrectly reviewed. In order to maximize the value of the
rebuttal phase to authors, we ensured that all reviews on the paper were presented to the authors
before the rebuttal phase commenced, and that no additional reviews were solicited on any paper after
the conclusion of the rebuttal phase. Overall, authors of 402 papers submitted their rebuttals. During
this phase, 17 papers were withdrawn.

Online discussion and the first round of decision making. One of our goals was to “empower the PC”,
i.e., to make sure that if PC members reach consensus about a paper, their decisions are not being
overruled by the PB. The very lively on-line discussion of papers, reviews and rebuttals, (over 5000
comments/emails had been exchanged) over a two-week period, led to the PC accepting 71 papers and
rejecting 327. The PB members overseeing the discussions also wrote a summary of decisions (a meta-
review). The remaining 74 papers were those where the PC members were unable to reach consensus.
They were moved up for discussion at the in-person PB meeting which took place in London on
December 6-7, 2017.

PB meeting. The two-day in-person meeting yielded 34 additional acceptances. For each paper
discussed at the PB meeting, the PB member handling the paper was asked to present the paper and
points for and against. In addition, we assigned another PB member, ahead of time, to play a
“challenger” role, to help elicit points for and against the paper and help weigh them. All papers
discussed at the PB meeting received a meta-review summarizing not only the online discussion but also
the discussion that took place at the PB meeting.

We note that the PB accepted a bit under half of the papers it discussed.

Poster invitations. Following the practice which started at ICSE’17, we invited the authors of
submissions that did not make the final selection for their track, but received positive reviews, to
present their work in the form of a poster during the conference. We invited the authors of 297
Technical track submissions to present posters about their work. Overall, authors of 105 submissions
took this opportunity. All of their posters got accepted, and all but 10 chose to have the 2-page poster
abstract published as part of the Proceedings.

        3.1 Scoring
The table below summarizes the range of the scores for the N papers and compares with ICSE 2017. For
example, the second row [-1; 2] represents the category of submissions that received an overall
recommendation of least a -1 (weak reject) and a 2 (strong accept); of the 33 submissions in this
category, 23 were accepted and 10 were rejected.

In both years, 47.2% of submissions received only negative scores ([-2; -1]). The percentages of papers
with only positive scores ([1; 2] and [1; 1]) is slightly higher in 2018 with 13.3% than it was in 2017 with
6.9%. In 2018, there were fewer conflicts between strong reject and strong accept ([-2; 2]) than in 2017,
3.4% vs. 8.5%.
ICSE 2018 (489 submissions) ICSE 2017 (388 submissions)
Range Count Accept Reject Withdrawn Count Accept Reject
[1; 2] 50 (9.9%) 49 1 0 25 (6.4%) 25 0
[-1; 2] 33 (6.5%) 23 10 0 29 (7.5%) 15 14
[-2; 2] 17 (3.4%) 8 9 0 33 (8.5%) 13 20
[1; 1] 17 (3.4%) 16 1 0 2 (0.5%) 2 0
[-1; 1] 83 (17.0%) 22 61 3 61 (15.7%) 12 49
[-2; 1] 60 (12.6%) 3 57 4 55 (14.2%) 1 54
[-2;-1] 229 (47.2%) 0 229 10 183 (47.2%) 0 183
3.2 Confidence / Expertise
Previous ICSEs asked reviewers to report their expertise (X: I am an expert in the subject area of this
paper; Y: I am knowledgeable in the area, though not an expert; Z: I am not an expert. My evaluation is
that of an informed outsider). In 2018, reviewers instead were asked to report their confidence in the
review (3 high; 2 medium; 1 low). The table below compares the confidence values reported in 2018
with the expertise levels reported in previous years. For the comparison, confidence of 3 (high) was
mapped to expertise X (expert), 2 (medium) to Y (knowledgeable), and 1 (low) to Z (outsider).
Overall, the numbers are comparable to previous years (2015, 2016): 87.3% of papers had at least one
high confidence review; 98.0% of papers had a minimum of two reviews with medium or high
confidence by the reviewer.
2013 2014 2015 2016 2018
At least 1 high/expert 72.0% 77.0% 84.0% 83.0% 87.3%
Minimum of 2 reviews with medium/knowledgeable
(or higher confidence/expertise) 95.5% 96.0% 97.7% 99.2% 98.0%
Papers with at least 1 low/outsider review 23.0% 18.0% 7.2% 20.6% 17.0%
For ICSE 2017, no data was reported for confidence/expertise in the “Report on the Technical Track of ICSE 2017”.
3.3 Topics
We begin by listing the number of papers submitted and accepted for each category. The last column
also includes the number of PC and PB members who declared this area as their expertise.
acceptance PC
Topic submissions accepted
rate members
Ubiquitous/pervasive software systems 2 0 0 9
Embedded software 3 0 0 10
Software services 5 0 0 16
Green and sustainable technologies 5 0 0 11
Crowd sourced software engineering 6 2 0.33 21
Software visualization 6 1 0.17 16
Traceability 6 1 0.17 24
End-user software engineering 7 1 0.14 18Cyber physical systems 8 1 0.12 25 Component-based software engineering 9 1 0.11 30 Cloud computing 10 0 0 14 Configuration management and deployment 11 2 0.18 13 Software economics and metrics 11 0 0 16 Autonomic and (self-)adaptive systems 11 1 0.09 29 Parallel, distributed, and concurrent systems 13 3 0.23 10 Program synthesis 15 6 0.4 16 Reverse engineering 15 2 0.13 24 Human-computer interaction 16 2 0.12 17 Software product lines 18 4 0.22 26 Middleware, frameworks, and APIs 18 4 0.22 12 Distributed and collaborative software 18 4 0.22 28 engineering Performance 18 2 0.11 7 Specification and modeling languages 19 2 0.11 31 Agile software development 20 1 0.05 21 Model-driven engineering 20 1 0.05 36 Software architecture 21 2 0.1 28 Software process 22 3 0.14 17 Programming languages 22 4 0.18 15 Refactoring 22 3 0.14 19 Dependability, safety, and reliability 23 3 0.13 29 Requirements engineering 23 4 0.17 32 Recommendation systems 24 3 0.12 30 Software reuse 26 5 0.19 19 Software modeling and design 28 4 0.14 36 Search-based software engineering 30 8 0.27 34 Software performance 30 5 0.17 10 Formal methods 32 7 0.22 25 Apps and app store analysis 33 8 0.24 26 Program comprehension 42 8 0.19 31 Mobile applications 47 11 0.23 25 Human and social aspects of software 48 10 0.21 33 engineering Validation and verification 55 12 0.22 39 Security, privacy and trust 58 6 0.1 25 Tools and environments 59 13 0.22 30 Debugging, fault localization, and repair 74 13 0.18 41 Mining software engineering repositories 82 16 0.2 41 Software evolution and maintenance 91 16 0.18 46 Program analysis 97 21 0.22 32 Software testing 102 29 0.28 50 Empirical software engineering 146 29 0.2 56
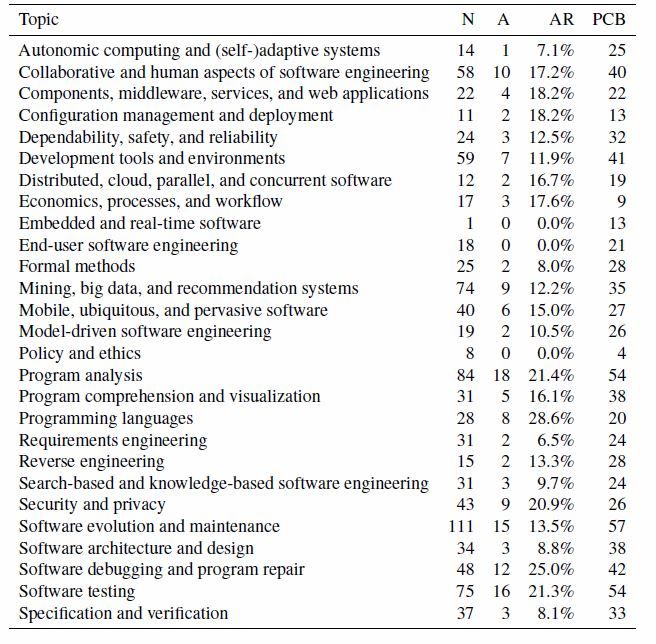
We note that overall, we had expertise that covered all topics for submitted papers. Assuming that each
PC member reviews 15 papers and each paper gets 3 reviews, areas where number of papers submitted
X 3 < number of experts X 15, would be those where we were low on expertise.

The data clearly shows that some topics were strongly favored for acceptance, e.g., 40% of papers on
program synthesis go accepted. Papers on crowd-sourcing techniques were accepted in 33% of the
cases. Yet no papers covering some areas, such as ubiquitous and embedded computing, software
services, green and sustainable computing, cloud computing and software economics, got accepted.
Furthermore, modeling and agile each got 20 papers submitted and only one accepted. Papers on
security also had a somewhat lower acceptance rate (10%), as were on the topics of software
architecture, performance, specification and modeling languages.

Let’s compare this date with 2017 categories (the following table is from the 2017 ICSE PC chair’s
report), where N is the number of submitted papers, A is the number of accepted papers, PCB is
coverage by program committee and board members (PCB) and AR is acceptance rate. Many of the
topics are somewhat different from the ones used in 2018, making direct comparison complex.
Specifically, there was no explicit program synthesis category which was so strongly favored in 2018 nor
was there a crowd-sourcing category. Yet a significantly larger number of papers on economics,
processes and workflows got submitted and accepted.
3.4 Analyzing other information in structured reviews
The structured reviews asked the reviewers to score the significance, soundness, novelty, replicability,
and presentation quality (1: very poor, 2: poor, 3: fair, 4: good, 5: excellent) and to identify candidates
for the best paper awards. The structured scores were not used during the discussion phase and
decision making and thus allows us to model the relationship between the individual quality aspects and
the total score.
The table below shows the distribution of the scores for the 1487 reviews. For example, for significance,
4.7% of the scores were very poor, 18.9% poor, and so on. On average the scores for presentation and
novelty were higher than the scores for soundness and replicability.

                          very poor (1)   poor (2)      fair (3)   good (4)   excellent (5)   average
         Significance         4.7%         18.9%        35.1%       35.2%        6.1%           3.19
         Soundness            5.2%         23.7%        35.4%       30.2%         5.4%          3.07
         Novelty              3.7%         17.0%        34.6%       37.9%        6.7%           3.27
         Replicability        8.2%         21.2%        33.5%       30.4%         6.7%          3.06
         Presentation         4.7%         13.9%        30.5%       40.2%        10.7%          3.38

Of the 1487 reviews, 42 nominated a paper for best paper.

The table below compares the average scores for rejected papers, accepted papers, and papers with a
best paper nomination:

                                                                        nominated for
                                             rejected        accepted
                                                                         best paper
                          Significance        3.025            3.797       4.548
                          Soundness           2.891            3.719       4.381
                          Novelty             3.137            3.753       4.357
                          Replicability       2.926            3.559       4.095
                          Presentation        3.234            3.925       4.452

Explaining Total Score with Significance, Soundness, Novelty, Replicability, Presentation

To analyze the relation between the scores for significance, soundness, novelty, replicability,
presentation quality, reviewer confidence (as independent variable) and the total score (as dependent
variable) we built a linear regression model (see below; Multiple R-squared: 0.5412, Adjusted R-squared:
0.5394). All factors were statistically significant. The coefficients for Soundness (0.414) and Significance
(0.376) are the highest. Replicability only has a small influence on the total score. The reviewer’s
confidence (on a scale of 1 to 3) also influences the total score, the more confident the more critical a
reviewer is; however, the effect is very small (-0.102).

                                                           Coefficients Significance
                         (Intercept)                             -4.208 ***
                         Reviewer’s Confidence                   -0.102 **
                         Significance                             0.376 ***
                         Soundness                                0.414 ***
                         Novelty                                  0.217 ***
                         Replicability                            0.061 *
                         Presentation                             0.143 ***
                         Signif. codes: 0 ‘***’ 0.001 ‘**’ 0.01 ‘*’ 0.05 ‘.’ 0.1 ‘ ’ 1

We also computed a decision tree (see below) to model the total score with significance, soundness,
novelty, replicability, presentation quality, reviewer confidence as independent variables. The top node
(#1) summarizes the 1487 reviews with an average of -0.61. The first split of the decision tree is along
the criteria Soundness < 3.5: the 957 reviews with Soundness < 3.5 are summarized in the left node (#2)
and have an average total score of -1.1; the 530 reviews with Significance >= 3.5 are summarized in the
right node (#3) and have an average total score of 0.33. The highest average total score is for papers
with Soundness 4 or higher, Significance 4 or higher Novelty 4 or higher, and Presentation 3 or higher
(node #31, 261 reviews, average total score of 1.1).
The results are similar to the linear regression model: Soundness and Significance have the largest
influence on the total score, followed by Novelty and Presentation. Note that the absence of Reviewer’s
Confidence and Replicability in the decision tree does not mean that they have no influence on total
score.
3.5 Authors
ICSE 2018 received submissions from 1,493 authors and 52 countries. Here is the distribution of papers
based on the country of origin:
acceptance PC
country authors submitted accepted
rate members
Algeria 1 0.25 0 0 0
Argentina 15 4 1 0.25 1
Armenia 0 0.2 0.2 1 0
Australia 17 5.56 2.88 0.52 1
Austria 8 3.67 1 0.27 0
Belgium 7 2.42 0 0 0Brazil 62 15.92 3.45 0.22 3 Canada 77 27.58 6.89 0.25 15 Chile 14 4.53 0.67 0.15 1 China 285 75.74 10.04 0.13 5 Colombia 6 2.08 0.17 0.08 0 Czech Republic 1 0.25 0 0 1 Denmark 8 2.38 0.33 0.14 1 Ecuador 3 0.83 0.5 0.6 0 Egypt 3 1 0 0 0 Finland 5 1.75 0.75 0.43 0 France 37 9.23 0.83 0.09 1 Germany 145 51.31 6.43 0.13 7 Greece 4 1.58 0.25 0.16 0 Hong Kong 9 3.45 1.67 0.48 1 Hungary 7 1.67 0.67 0.4 2 India 20 6.13 0.33 0.05 2 Ireland 0 0 0 0 1 Israel 12 3.9 1.5 0.38 1 Italy 28 9.68 2.33 0.24 11 Japan 20 4.98 0.64 0.13 1 Jordan 1 0.17 0 0 0 Korea, Democratic People's 3 0.75 0.75 1 0 Republic of Latvia 1 0.2 0 0 0 Lebanon 0 0 0 0 1 Luxembourg 26 10.22 2.47 0.24 4 Malaysia 1 0.5 0 0 0 Mexico 4 2 0 0 0 Netherlands 26 9.74 4.49 0.46 5 New Zealand 4 1.95 0 0 0 Norway 8 3.92 0 0 1 Oman 1 0.5 0 0 0 Pakistan 11 3.5 0 0 0 Poland 1 1 0 0 0 Portugal 19 6.6 0.6 0.09 1 Russia 7 2 0 0 0 Saudi Arabia 1 0.33 0 0 0 Singapore 32 10.87 3.67 0.34 1 South Africa 1 0.33 0 0 2 South Korea 15 5.67 2.67 0.47 1 Spain 19 4 0.67 0.17 3 Sri Lanka 1 0.5 0 0 0 Sweden 24 8.27 0 0 4 Switzerland 17 6.18 1.33 0.22 1 Taiwan 4 1.25 0 0 0 Tunisia 3 1 0 0 0 United Kingdom 48 17.84 3.17 0.18 17 United States 479 161.45 42.49 0.26 40
United States Minor Outlying                 2            1           0                 0               0
 Islands
 Viet Nam                                     1         0.17        0.17                 1               0

3.6 Additional information about the authors and submissions
At the time of the submission, we were collecting additional data about the composition of the authors
with respect to students, gender, industrialists, and previous submission. Authors could provide this
data voluntarily. The responses were not visible to PC/PB members and the responses did not affect the
decision making. We received responses for 388 to 399 submissions, depending on the question.

    •   Gender. Of the 395 submissions that provided gender information, 207 had no female co-
        authors (acceptance rate: 24.8%), 188 papers had at least one female co-author (acceptance
        rate 21.0%). No data was available for 107 submissions.
    •   Industry. Of the 388 submissions that provided industry author information, 301 had no co-
        author from industry (acceptance rate: 23.2%), 87 papers had at least one co-author from
        industry (acceptance rate 16.9%). No data was available for 117 submissions.
    •   Students. Of the 399 submissions that provided student author information, only 78 had no
        student author (acceptance rate: 16.0%), 317 papers had at least one student co-author
        (acceptance rate 24.4%). No data was available for 103 submissions.
    •   Previous ICSE submissions. For 53 submissions no author had previously submitted to ICSE
        (acceptance rate 6.8%), for 331 submissions at least one author submitted to ICSE before
        (acceptance rate 24.4%), for 118 submissions. no data was available.

The submission form included two questions about double-blind review. (Note that these questions
were answered by the person who made the initial paper submission, which might be a biased sample
of the ICSE population, e.g., junior co-authors are more likely to submit than the senior co-authors.)

    1. For the question “What are your thoughts about double-blind refereeing for ICSE'18?”, the
       responses were positive. Of the 396 submissions, which responded to this question, 58.3%
       selected “Very positive”, 25.5% “Somewhat positive”, and 12.4% “Neutral”. Only a small number
       of responses felt negatively: 3.0% selected “Somewhat negative” and 0.8% selected “Very
       negative”

    2. We also asked “Do you feel that double-blind reviewing will produce a more fair assessment of
       your work, when compared to regular reviewing?”. Of the 395 submissions, which responded to
       this question, 39.0% selected “Definitely”, 42.8% “Probably”, 12.4% were “Unsure”, 5.3%
       selected “Probably not” and 0.5% “Definitely not”

    4. Programme committee selection

We put a great deal of effort into drawing from the widest possible pool of candidate reviewers. In order
to do this, we first drew up a detailed spreadsheet, extracting candidate reviewer names from Google
scholar and DBLP. For each entry, we recorded total number of citations and H index. We rounded the
total number of citations to the nearest 1000, to cater for different sample times. We manually
collected demographic information such as the sector in which the candidate reviewer worked, gender,
country of affiliation and so on. Finally, we recorded approximately 50 different categories of expertise,
manually determining candidate reviewer expertise based on recent and highly-cited publications, as
listed on DBLP and Google scholar. The whole process occupied about 10-12 person days’ effort in terms
of manual extract, cross-validation, and annotation. In order to choose the column headings for topics
of expertise as our categories, we harvested the “topics include but are not limited to” bullet point lists
from previous iterations of the conference.
Although laborious to construct, this spreadsheet allowed us to construct subsets of candidate
reviewers, and immediately measure the coverage of topics, geography, sector and other demographics.
At the same time, recording bibliometric data kept us relatively “honest” in terms of assessing the
suitability of candidates; it made it immediately visible if we were trying to promote a “favourite
candidate” who lacked scientific impact, compared to the approximate overall distribution of other
candidates.
Having constructed the spreadsheet, we used simple, by-hand, constraint satisfaction to solve the
various constraints of ensuring geographic and topic spread, availability of reviewing expertise, and
balance in the composition of the programme committee and program board.
In choosing the programme committee, we were prepared to take risks with relatively new and junior
members in order to maintain the lifeblood of the review pool and development of the wider
community. This calculated risk was amply balanced by the admirable willingness of many senior
members of the community to serve on the programme committee. This is to be welcomed, since many
perceive the programme board role is somehow be more prestigious. We believe this (potentially
incorrect) perception is something that needs to be addressed if possible; both roles are simply different
and equally important. However, we do tend to favour more senior people on the programme board,
which tends to create a “correlation expectation”.
We have confidence in the process by which we arrived at the composition of the programme
committee and program board and feel that a suitably balanced composition and topic coverage
contribute greatly to the quality of discussion and reviewing.
5. Survey analysis
We ran two surveys to learn about the satisfaction with the ICSE 2018 review process:
1. Among the authors. Of the 1,493 authors 1, 343 (23.0%) people participated in the survey. For
the analysis we split the responses in (a) authors with all papers rejected, (b) some but not all
papers accepted, and (c) all papers accepted.
1
In this report, we use author for a person who is co-author of an ICSE submission, regardless of whether the
paper was accepted or not.2. Among the PC/PB members. Of the 101 PC members, 44 (43.6%) participated and of the 33 PB
members, 17 (51.5%) participated in the survey
When possible, we compare the results to previous ICSE conferences. However, it is important to note
that the data collection varied over each year, and only subsets of authors participated in the author
feedback. In 2014 and 2015, the author surveys were post-notification (2014: 185 responses, assuming
one response per paper, 37%; 2015: 182 responses, assuming one response per paper, 42%); in 2016 the
author ratings were collected during the rebuttal (359 out of 513 responses, 70%); in 2017, the survey
was post-notification and allowed each author of a paper to rate each reviews of each paper they
submitted. For the survey in 2018, we simplified the process and asked authors for feedback on the
reviews for all their submissions.
Satisfaction (Authors, PC/PB members). The satisfaction and dissatisfaction with the review process
and the review quality is shown in the table below. Of all authors, 70% were satisfied with the review
process and 64% were satisfied with the review quality (the numbers are higher for authorswith all
papers accepted. 93% satisfied with the process and 84% satisfied with the review quality). Among the
PC/PB, 71% were satisfied with the review process and 79% were satisfied with the review quality.
Review Process Review Quality
Satisfied Dissatisfied Satisfied Dissatisfied
Authors (all) 70% 16% 64% 22%
Authors: no accept 50% 30% 45% 38%
Authors: some accept/reject 71% 13% 68% 18%
Authors: all accept 93% 0% 84% 5%
PC/PB 71% 21% 79% 11%
PC 73% 18% 80% 14%
PB 65% 29% 77% 6%
Review quality (Authors, PC/PB members). We asked authors and PC/PB members for their agreement
with statements about specific aspects of the review quality (usefulness, fairness, accuracy,
constructiveness, thoroughness). The table below summarizes the agreements.
Authors
some
all accepted/ all
rejected rejected accepted All PC/PB PC PB
The reviews were accurate. 41% 57% 76% 57% 72% 72% 71%
The reviews were constructive. 50% 64% 82% 64% 77% 75% 82%
The reviews were fair. 51% 57% 85% 64% 87% 84% 94%
The reviews were thorough. 47% 60% 73% 59% 68% 65% 77%
The reviews were useful. 62% 70% 91% 74% 88% 88% 88%
We now summarize the results of the 2018 survey and compare to the results from the submitter
surveys of previous years.• Accuracy. Of the ICSE authors, 57% agreed that the reviews were accurate (authors with all
submissions accepted: 76%, all submissions rejected: 41%). Among the PC/PB, 72% agree that
the reviews were accurate. Compared to previous years, in 2017, when each review was rated
by the authors, 59% of the reviews were rated as accurate. Before 2017, ICSE surveys did not ask
explicitly about accuracy. Instead they asked whether the reviews reflected sufficient knowledge
of the reviewers: 58% of authors agreed in 2014 that the reviewers had sufficient expertise to
evaluate their submission, 67% agreed in 2015, and 58% agreed in 2016.
• Constructiveness. Among the authors, 64% agreed that the reviews were constructive (all
submissions accepted: 82%, all submissions rejected: 50%). Among the PC/PB, 77% agreed with
the statement that the reviews were constructive. Compared to previous years, 61% of the
reviews were rated as constructive by authors in 2017, 64% of authors agreed in 2014 that the
reviews were constructive, 64% agreed in 2015, and 57% agreed in 2016.
• Fairness. Among the authors, 64% agreed that the reviews were fair (all submissions accepted:
85%, all submissions rejected: 51%). Among the PC/PB, 87% agreed with the statement that the
reviews were fair. Compared to previous years, in 2017 authors rated 62% of the reviews as fair.
Before 2017, ICSE surveys did not ask about the fairness of reviews.
• Thoroughness. Among the authors, 59% agreed that the reviews were thorough (authors with all
submissions accepted: 73%, all submissions rejected: 62%). Among the PC/PB, 68% agreed with
the statement that the reviews were thorough. Compared to previous years, 55% of the reviews
were rated as thorough by the authors in 2017, 66% of authors agreed in 2014 that the reviews
were constructive, 69% agreed in 2015, and 66% agreed in 2016.
• Usefulness. Among the authors, 74% agreed that the reviews were thorough (authors with all
submissions accepted: 91%, all submissions rejected: 47%). Among the PC/PB, 88% agreed with
the statement that the reviews were thorough. Compared to previous years, 64% of the reviews
were rated as useful by the authors in 2017, 66% agreed in 2016 that the reviews were useful,
no data is available for 2014 and 2015.
Resubmissions (Authors). Of the authors with research papers rejected, 84% have or are planning to
resubmit the papers to a different venue.
We also asked authors about which venue(s) they have or are planning to resubmit. For the question,
we allowed multiple responses (since authors might have multiple rejected papers) and write-ins. In
total we received 340 responses by 175 participants. The most frequent targets for resubmission are in
the table below.
Venue Count Percent Venue Count Percent
ESEC/FSE 58 33% ISSRE 10 6%
ASE 51 29% TOSEM (journal) 9 5%
TSE (journal) 39 22% RE 8 5%
ISSTA 36 20% ICST 6 3%
ICSME 19 11% SANER 6 3%
EMSE (journal) 17 10% ICPE 5 3%MSR 11 6% ICSA 5 3%
ESEM 10 6% OOPSLA 5 3%
Review process (PC/PB members). We asked PC and PB members about their agreement with several
statements on the ICSE 2018 review process, specifically about workload, rebuttals, review quality,
discussions, interaction between PC/PB, and the local social clusters. The results are summarized in the
table below. Interestingly, 94% of the PB responses agreed with the statement that the workload was
manageable but only 59% of the PC responses.
Program Committee Agreement Disagreement
My workload for ICSE was manageable. 59% 18%
The rebuttals helped make decisions more informed and more fair. 55% 18%
I was able to provide expert reviews on most of the papers assigned to me. 93% 2%
PB members helped improve my reviews. 51% 21%
PB members were effective in seeding and facilitating discussion among
reviewers. 60% 16%
It was fair to recuse myself for discussions where I became aware of some
author identities. 36% 20%
PB members and PC Chairs did not overrule my decisions about the papers I
reviewed. 73% 9%
The Local Social Cluster is a useful mechanism to facilitate mentoring and
resolve problems. 12% 33%
I took advantage of the Local Social Cluster system. 11% 55%
Program Board Agreement Disagreement
My workload for ICSE was manageable. 94% 0%
The rebuttals helped make decisions more informed and more fair. 65% 18%
The PC reviews were of poor quality. 6% 82%
Online discussions resulted in good decisions. 71% 12%
I would have preferred to review papers myself instead of presiding over the
PC online discussion. 35% 41%
I had all the data I needed to make decisions about papers discussed at the
PB meeting. 71% 24%
The PC chairs used their influence to inappropriately change decisions for
papers discussed at the PB meeting. 6% 82%
The discussion at the PB meeting discussions led to good decisions. 71% 29%
Local Social Cluster is a useful mechanism to improve mentoring of PC
members and resolve other problems. 6% 53%
I used my Local Social Cluster. 6% 88%
Opinion questions (Authors, PC/PB members). We asked authors and PC/PB members about their
agreement with several statements about review processes in general.
Authors PC/PB members
Agree Disagree Agree Disagree
Authors should be able to respond to all reviews. 72% 8% 48% 17%
No additional reviews should be assigned after
rebuttal, even when the review expertise was low. 15% 61% 17% 65%Meta-reviews written by program board members are
useful. 61% 13% 63% 20%
Double-blind (Authors, PC/PB members). Overall, the double-blind review process was perceived
positively by the PC, PB, and the authors.
Among PC/PB members, 57.4% agreed (13.1% disagreed) with the statement “Before ICSE 2018, your
attitude towards double-blind reviewing was positive/ supportive”. 68.9% of the PC/PB members agreed
(14.7% disagreed) agreed with “You would like to see double-blind reviewing being used for future ICSE
conferences.” The difference between 57.4% and 68.9% suggests that by participating in the ICSE 2018
review process several PC/PB members became more positive towards double blind review.
In the submitter survey, 75.6% agreed (6.8% disagreed) with “Before ICSE 2018, your attitude towards
double-blind reviewing was positive/ supportive.” 77.4% agreed (8.5% disagreed) with “You would like
to see double-blind reviewing being used for future ICSE conferences”. The small difference between
75.6% and 77.4% suggests that the ICSE 2018 review process did not have much impact on the (already
positive) attitude towards double-blind-review. This can have several reasons: many authors might have
already previously submitted to double-blind venues; it is harder to observe any changes for authors
because they don’t have as much insight into the internals of the review process as PC/PB members, etc.
It is noteworthy that there are demographic differences in whether authors want to see double-blind
review again:
• Gender: among authors who identified as females 72.1% agreed, while among authors who
identified as male 78.9% agreed;
• Location: Europe 68.4%, South America 76.9%, North America 80.8%, and Asia/Pacific 89.4%
agreed (not enough responses for the other regions);
• First-time authors: 80.9%, Repeat authors: 73.5% agreed
• Seniority: Graduate/Master 82.4%, Post-doc 80%, Assistant Professor 78.4%, Associate Professor
72%, Full Professor 57.5% agreed that they would like to see double-blind reviewing being used
for future ICSE conferences
The tables below list the agreement with additional statements about double-blind in the ICSE 2018
review process from the point of view of the PC/PB members.
Program Committee Agreement Disagreement
Double-blind reviewing helped make decisions which are more fair. 64% 14%
Double-blind reviewing gave me all data that I needed to make a decision. 77% 9%
Program Board Agreement Disagreement
Double-blind reviewing made decisions which are more fair. 65% 6%
Double-blind reviewing provided sufficient data to make a decision. 82% 6%
The table below lists the agreement with general statements about double-blind review from the point
of view of the authors and PC/PB members. Among authors and the PC/PB members, there is a
preference for never revealing the identity of the author names for rejected papers.Authors PC/PB members
Agree Disagree Agree Disagree
Making submissions double-blind is a lot of work. 33% 42% 37% 42%
Submitting supplemental materials such as data, case studies,
code is difficult for double-blind review. 55% 21% 63% 20%
Double-blind reviewing decreases the quality of reviews
because it is harder to solicit external opinions. 16% 51% 18% 60%
Reviewers should recuse themselves from the discussion if
they discover the authors’ identity. 48% 21% 37% 44%
The authors names of rejected submissions should never be
revealed. 67% 6% 57% 22%
Submissions that accidentally reveal the authors identity
should be rejected. 29% 43% 15% 63%
PB meeting. We asked the PC/PB members to rate the agreement with the statement "A physical PC/PB
meeting is not necessary. An electronic meeting would suffice.". 60.7% agreed with this statement,
21.3% disagreed. Among the PC 63.7% agreed, among the PB 52.9% agreed. The agreement was higher
for PC/PB members who attended at least one meeting vs those who never attended a PC meeting:
64.5% vs 56.3%. Among PC/PB members who identified as female 64.3% agreed (10.7% disagreed) and
among members who identified as male 55.5% agreed (33.3% disagreed).
6. Chairs’ Comments:
Review Process. We invited several members of the PC to serve as Rapid Response Reviewers, that is,
at the exchange of getting a smaller initial review load, we asked them to be prepared to step in with
their reviews when needed. This was a very good move and we recommend next year’s chairs to do the
same. We “deployed RRRs” whenever initial reviewers were late or when the quality or depth of the
review we did receive was deemed inadequate by the PB member handling the paper.
We also felt that it was important that the authors have an opportunity to rebut every review. That
meant that we made a choice not to solicit additional reviews in case the existing reviewers disagreed or
when some of the expertise was lower than we would have liked. We believed that the reasons for our
decision outweighed those again but it is a point that the next chairs may want to decide for themselves
(see the data provided).
Journal-first and Posters. We received 67 submissions for the Journal-First track (25 from TSE, 5 from
TOSEM and 37 from TSE). Of these, 18 were deemed ineligible because they were either published
outside the eligibility window or had an associated conference paper. Furthermore, the author of one
paper was unable to attend ICSE. The resulting 48 JFP were presented at ICSE’18 (20 from TSE, 2 from
TOSEM and 26 from JESE. That number was still significant as it added, effectively, 50% to the size of
the ICSE Technical Track program. In several occasions, the JFP papers nicely complemented the onesfrom ICSE but there were several sessions consisting of primarily (or even solely) JFP papers. But JFP clearly increased attendance: 77 registrants indicated that they had a JFP paper at ICSE, and 33 of them indicated ONLY a JFP (for 30 unique papers). We feel that the JFP process should be reviewed at the SC meeting. In addition, we invited a significant number of authors of rejected papers to submit posters to present at ICSE, and many authors took us up on this offer. This may be one of the many factors that led to the high attendance at this ICSE. Specifically, 168 registrations indicated that they had a poster at ICSE’18, and 108 had only a poster (for 96 unique posters). Moreover, of these 108, 51 were students (and of these, 40 were attending ICSE for the first time). Thus, as one would expect, posters are an excellent way to increase ICSE student attendance. Use of easychair. While relatively late, EasyChair did provide a workable plugin for managing double- blind conflicts. That enabled authors to specify conflicts with PC/PB members and enabled PC/PB members to see these conflicts and declare theirs. We also used EasyChair to allow authors to submit optional (and anonymized) data supplementing their papers. A significant number of authors took advantage of that option. Overall, the use of EasyChair went relatively smoothly. We did significant amount of double-blind conflict testing ahead of time, over the summer of 2017, and the bugs did get fixed before the submission started. Since we did not switch roles of individuals (as was done in 2017), by asking PB members to do reviews, support provided by EasyChair was adequate. Double-blind violations. Probably the most significant problem with experienced was in identifying double-blind violations. Some were blatant but some were subtle. Yet others involved attached supplementary information. Identifying double-blind violations rapidly and enabling authors to fix them quickly, all the while without “polluting” the reviewer pool was a challenge for us and will probably remain a challenge for next chairs. We did ask the program board members to help us in this process during the first week after the paper submission and before the papers were sent out to PC members for review. We discuss others below. Why not Triple blind: Both program chairs felt very strongly that we should opt for double-blind but not triple blind. That is, the identities of reviewers should be known to each other. We discussed this at length with the programme committee and program board. There appeared to be strong and valid opinions on both sides of this argument. In favour of hiding review identities from each other, more junior members of the community may sometimes seemed to feel that they might be unduly silenced by more senior members of the community if identities were known. Similarly, other reviewers were concerned that more junior members may simply choose to remain silent, once they realized they were discussing a paper with someone who had more seniority. The first of these concerns we were able to ameliorate by seeking out and tackling any such cases as they arose. Mercifully, we didn’t see any cases where this happened. The second issue was a more silent (undetectable) concern; we weren’t able to tell whether junior members were simply reticent. Having said that, we did observe that review of reticence was a per- reviewer property, rather than a reviewer-group phenomenon; reviewers who are reticent to comment tended to be reticent on all of the papers to which they were assigned, rather than only with regard to a particular perceived more authoritative reviewer.
Set against these concerns over revealing of reviewer identities, we have to take account of the social
nature of the reviewing process. We felt that it was important for junior reviewers to be recognized for
the quality of their reviews. We could have achieved this by revealing review identities at the end of the
process, of course. However, could we really be sure that lasting impressions of reviewer quality would
remain in the minds of those who have influence in the selection and ongoing development of more
junior colleagues? Furthermore, we felt that it was appropriate to take into account the expertise, and
also possible leanings (and dare we say biases), of reviewers in weighing the different contributions to
make to the discussion.

Managing Conflicts of Interest. One of the big challenges lies in balancing the tension between the
handling of conflict-of-interest and the aim to provide a double-blind review process. The former is
concerned with explicit bias that arises through conflict-of-interest, while the latter is concerned with
implicit bias, about which the reviewer may be entirely unaware. Since we are dealing with
professionals, we tended to regard the balance of risk in terms of favouring the reduction of implicit
bias, and relying on professionalism to reduce explicit bias.

That is, we hope that by removing author identity from the process, the only way in which explicit bias
could occur through conflict-of-interest would be through unprofessional behavior, which we hope will
be minimal if not non-existent. On the other hand, motivated by many scientific publications on the
topic of implicit bias to favour double-blind, we favoured reducing potential sources of implicit bias,
since no amount of professionalism could ever hope to ameliorate their affects.

We thought that there would be a tension here, when we send people out of the room for conflict-of-
interest, because this may reveal author identity. However, fortunately, we were not aware of this
happening during the programme board meeting. We did try to obscure the conflicts and attempted to
focus the meeting away from the consideration of author identities.

We were pleased to find that there wasn’t a single occasion where any of the members of the
programme board claimed to discover identity during the meeting itself, and furthermore, we got the
strong impression that members of the programme board had fully absorbed the philosophy of double-
blind reviewing: they were not even thinking about possible author identity during the process. This is
an impression, rather than something for which we can provide quantitated data.

Use of Paper History vs “Blind” Reviewing. One of the biggest tensions we encountered was between
two things, both of which we wanted to have in the process but which appeared contradictory. It arose
because of the incompatibility of making use of historical data on previous submissions, with the need
to remove author entities from the decision-making process. If a previous conference had not had a
fully double-blind process then, by definition, we would not be able to take account of any historical
information available, and anyone among the reviewers/board who knew of such information would
automatically be compromised and therefore unable to take part in the discussion. This is clearly very
unfortunate, since it may be useful to have this historical information, and any so-recused reviewer
would, by definition, be one who has suitable expertise to comment. We had no way to balance these
competing concerns, and were therefore forced, in a couple of cases, to recuse referees and deny our
committee historical information from previous conferences that were not fully double-blind.

It seems that the only way the community could resolve these two conflicting objectives would be at the
community level, by agreeing to move to full (heavy) double-blind, throughout the review process. If we
don’t do this, as a community, then one conference will effectively pollute the double-blind intentions
of another. Maybe this is a conversation for the ACM SIGSOFT/IEEE TCSE Townhall meeting.
You can also read