Identification of superspreading environment under COVID 19 through human mobility data - Nature
←
→
Page content transcription
If your browser does not render page correctly, please read the page content below
www.nature.com/scientificreports
OPEN Identification of superspreading
environment under COVID‑19
through human mobility data
Becky P. Y. Loo1,2,3, Ka Ho Tsoi1,3, Paulina P. Y. Wong4,5 & Poh Chin Lai1,2*
COVID-19 reaffirms the vital role of superspreaders in a pandemic. We propose to broaden the research
on superspreaders through integrating human mobility data and geographical factors to identify
superspreading environment. Six types of popular public facilities were selected: bars, shopping
centres, karaoke/cinemas, mega shopping malls, public libraries, and sports centres. A historical
dataset on mobility was used to calculate the generalized activity space and space–time prism of
individuals during a pre-pandemic period. Analysis of geographic interconnections of public facilities
yielded locations by different classes of potential spatial risk. These risk surfaces were weighed and
integrated into a “risk map of superspreading environment” (SE-risk map) at the city level. Overall,
the proposed method can estimate empirical hot spots of superspreading environment with statistical
accuracy. The SE-risk map of Hong Kong can pre-identify areas that overlap with the actual disease
clusters of bar-related transmission. Our study presents first-of-its-kind research that combines
data on facility location and human mobility to identify superspreading environment. The resultant
SE-risk map steers the investigation away from pure human focus to include geographic environment,
thereby enabling more differentiated non-pharmaceutical interventions and exit strategies to target
some places more than others when complete city lockdown is not practicable.
In medical science, epidemiologists called someone who infected an especially large number of other people
“superspreaders”1. The existence of superspreaders is notable as they can accelerate the rates of new infection in
a pandemic. With COVID-19 declared a global pandemic by the World Health Organization (WHO) on March
11, 2020, scientists have closely monitored and continuously updated estimates of the effective reproduction
number (Rt), “which represents the mean number of secondary infections that result from a primary case of
infection at time t”2. Such research is necessary because Rt is an indicator of the transmission potential of a dis-
ease. A pandemic signals a declining trend only when Rt is below one. More cases are expected when Rt exceeds
one. The higher the value of Rt, the faster the transmission and the more alarming the public health risk. Rt
for COVID-19 was estimated to be between two and three in early 2 0203, but recent research suggests a higher
number in the range of 4.4 to 11.74. Yet, there is great inter-personal variability of disease transmission with
much higher transmissibility risk of a primary case by a superspreader5,6. A superspreader in Wuhan infected 14
healthcare workers that resulted in one death while an individual in Chicago who attended a dinner, a funeral
and a birthday party was responsible for 15 new i nfections1. Hence, research on identifying, tracing and treating
superspreaders is highly important to pandemic control.
Thus far, the focus of research on superspreaders has primarily been aspatial1,6,7. In this paper, we propose
to broaden research on superspreaders through geographical modelling of the pandemic spread8. Figure 1 is
an illustration using a hypothetical example of a city with 100 sub-divisions/zones and with each zone carry-
ing a population of 1,000. Two scenarios of spatial spread could result, assuming that 80% of all infected cases
was caused by superspreaders1, and the transmission rates of super versus non-super spreaders were modelled
at ten and two respectively; where these values may be adjusted according to updated and realistic estimates
gathered from field data. Scenario A assumes the presence of a superspreader in a non-superspreading environ-
ment whereas the superspreader in scenario B exists in a superspreading environment. With infectivity yielding
similar number of newly infected cases at each time period, the spatial patterns of infection for the two scenarios
look very different because of the geographical setting populated by people at two extreme ends of mobility.
1
Department of Geography, The University of Hong Kong, Pokfulam Road, Pok Fu Lam, Hong Kong. 2Institute
of Transport Studies, The University of Hong Kong, Pok Fu Lam, Hong Kong. 3Urban and Transport Research
Laboratory, The University of Hong Kong, Pok Fu Lam, Hong Kong. 4Science Unit, Lingnan University of Hong
Kong, Pok Fu Lam, Hong Kong. 5Centre for Social Policy and Social Change, Lingnan University of Hong Kong, Pok
Fu Lam, Hong Kong. *email: pclai@hku.hk
Scientific Reports | (2021) 11:4699 | https://doi.org/10.1038/s41598-021-84089-w 1
Vol.:(0123456789)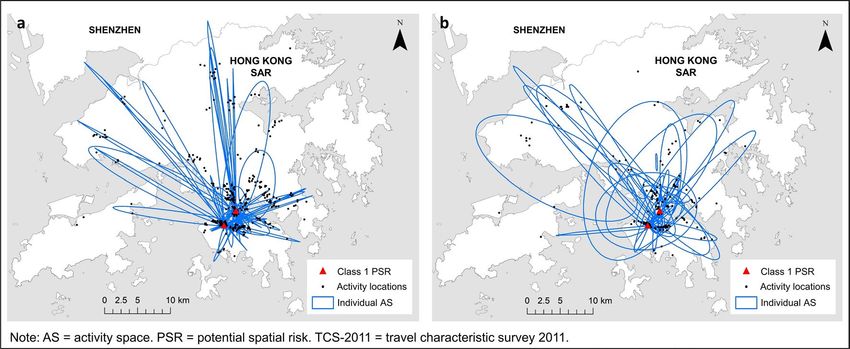
www.nature.com/scientificreports/

                                           Figure 1.  Transmission patterns under the non-superspreading and superspreading environment.

          Scientific Reports |   (2021) 11:4699 |             https://doi.org/10.1038/s41598-021-84089-w                                   2

Vol:.(1234567890)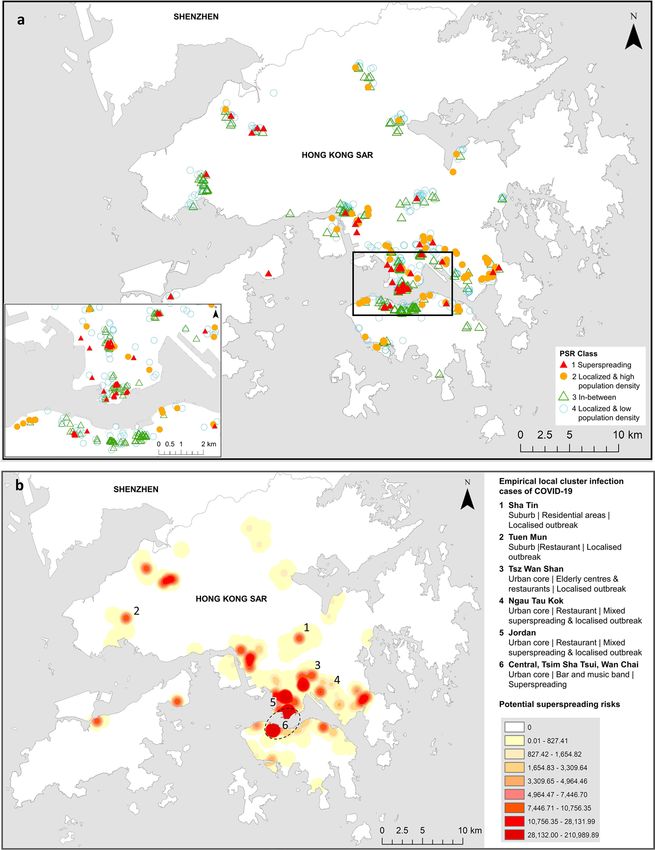
www.nature.com/scientificreports/
A non-superspreading environment (Scenario A) is characterised by people at the low end of mobility while a
superspreading environment (Scenario B) has highly mobile individuals, including long-distance commuters
and those who regularly travel from place to place beyond their local communities.
We argue that a community/district with mobile population must also possess certain amenities or services to
turn it into a superspreading environment. This is analogous to Losch modified Christaller’s central place t heory9,
which suggests the locations of retail in urban areas attract people/consumers to purchase goods and services they
need (see Supplemental Methods S1.1). Moreover, retail locations in urban versus rural districts exhibit different
retail centrality, which is a measure of the retail drawing power or attraction of a given location10. The density
of streets or transport networks also plays an important role in shaping variations of retail and service intensi-
ties within a c ity11,12. Compared with suburban locations, urban cores or central business districts where both
high- and low-order retail and transport facilities tend to cluster favour the formation of “attractors” in the set-
tlement layout, exerting a strong pull on consumers living nearby and further away in the region. Consequently,
the combined characteristics of higher spatial agglomeration of retail activities and expanse transportation can
serve as a proxy for superspreading environment.
Consider the varying spatial patterns of disease transmission under a superspreading environment, we sug-
gest that non-pharmaceutical interventions (NPIs) for disease containment must step beyond the conventional
practice of focussing on home and workplace of the infected. Unlike the traditional spatial analysis that associates
patients to their home locations13–15, this study identifies candidate areas with a heavy concentration of retail and
public facilities as potential spreading environments. Our approach aims to predefine high-risk areas of disease
spread such that these locations can be targeted to receive more stringent and timely disease prevention and
control measures before or during an outbreak. Research on pandemic control have involved scientific studies
about the host, pathogen and the environment. Under COVID-19, scientific research on the pathogen (such as
the genetic sequences of SARS-CoV-2) has been ongoing at full steam although effective drugs and vaccines to
protect human beings are still being tested. It is also noted that a period of at least two days of pre-symptomatic
transmission in the community is particularly challenging2. Without an effective means of tracking asymptomatic
individuals, NPIs are essential components in public health response to the COVID-19 pandemic.
There is recent evidence to suggest that NPIs have been effective in China and b eyond2,16,17. Specifically, the
COVID-19 cases in China could be 67 times higher without N PIs2,18. Notwithstanding that these studies have
bundled all confinement or lockdown measures as NPIs, they recognized that the effectiveness of different inter-
ventions might vary. It is also realised that the economic and social costs of lockdowns can be e normous19, as
people are confined to homes without being allowed to participate in social, entertainment and leisure activities
good for their physical and/or mental health. Knowing that a complete city lockdown incurs enormous economic
and social costs, as well as related knock-on effects on physical/mental health and interpersonal violence, it may
be beneficial to continue operation of some public facilities deemed important for maintaining people’s daily life
and wellbeing. Studies have suggested that permitting limited access to sports centres, libraries, dinning out, and
shopping for local residents can be managed with proper disease prevention measures, such as frequent disin-
fection, mandatory face-masks and physical distancing20,21. Under COVID-19, these public facilities have often
been targeted for indiscriminate and complete close-down. Referring to NPIs included in the Oxford d atabase22,
closing of these public facilities may be considered as the intermediate step following school and workplace
closures, but before the most drastic measures of stay home order and complete city lockdown.
This paper extends beyond current research that focuses on the pathogen (e.g. characteristics of SARS-CoV-2)
or individuals (i.e. the hosts) with a high risk to be superspreaders. It does not focus on biological characteristics
of infected persons (e.g. in relation to their immune system) but to examine the environment/space posing dif-
ferent health risks of a transmissible disease. It, therefore, supplements the traditional public health concerns
of medical science and microbiology with the spatial dimension of people-environment dynamics. Against this
background, this research uses geospatial statistical methods, originated from time g eography23, to differentiate
between exceptionally “high-risk superspreading facilities” covering wider spatial catchment areas that attract
users from distant locations and those spending substantial periods of time out-of-home, and “local facilities of
the same type” but with smaller spatial catchment areas that mainly attract local residents and those spending
shorter out-of-home time.
Methods
This study quantifies and maps potential risk areas of superspreading tendencies in Hong Kong. It aims to illus-
trate the concept and methods of extracting spatial mobility data in an urban setting to enable the identification
of superspreading environments. In the later part of this paper, we also crosschecked the validity of potential
risk surface against the patterns of confirmed COVID-19 cases in the city. Two types of human mobility data
were extracted from secondary data sources without direct experiments with human participants. Data applied
to identify the superspreading environments came from the Travel Characteristics Survey 2011 (TCS-2011),
obtained from and approved by the Transport Department of the Hong Kong SAR Government. The TCS-
2011 is a territory-wide survey that informs characteristics of trips made by Hong Kong residents on a typical
working day. The fieldwork protocols are available in the final report (https://www.td.gov.hk/filemanager/en/
content_4652/tcs2011_eng.pdf). The survey contains data of over 35,000 households about their household/
personal characteristics and mechanized trip information (e.g. origins/destinations, trip purpose, journey time
and transport modes). Data of empirical cases database were publicly available data from the Centre for Health
Protection (CHP) of the Hong Kong Government and crowd-sourced information came from local news reports
and social media.
We identified six types of retail locations and public facilities where an agglomeration of people and services
is likely to take place during a pandemic, viz. bars, shopping centres, karaoke & cinemas, mega shopping malls,
Scientific Reports | (2021) 11:4699 | https://doi.org/10.1038/s41598-021-84089-w 3
Vol.:(0123456789)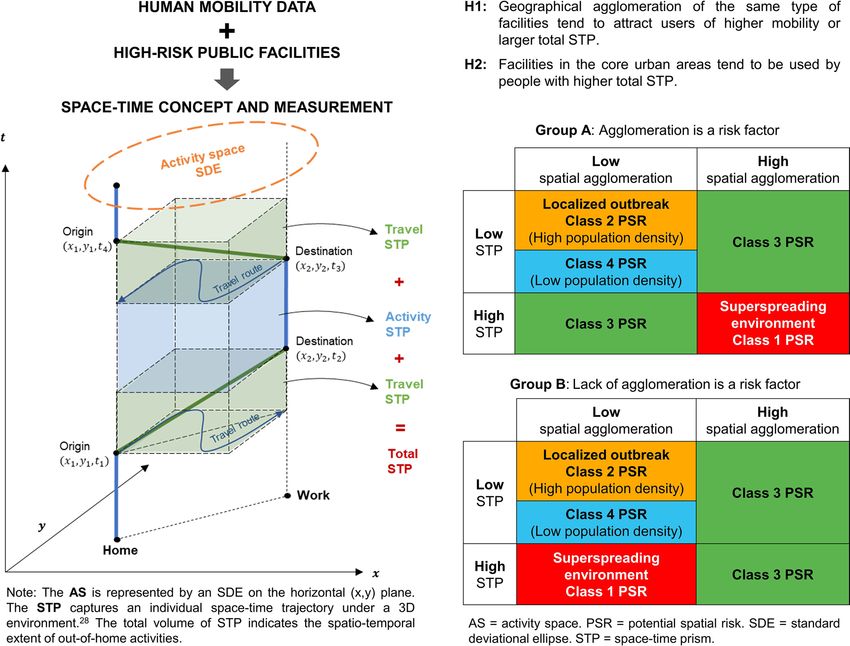
www.nature.com/scientificreports/
Figure 2. An illustration of the space–time concept and spatial agglomeration.
public libraries, and sports centres (see Supplemental Methods S1.2). These locations emerged as popular social
gathering grounds associated with clusters of locally transmitted cases24–26. Locational data for all facilities except
bars were readily extracted from the “GeoCommunity Database of Hong Kong”, available from the Survey and
Mapping Office of the Lands Department (https://www.landsd.gov.hk/mapping/en/lic/geocom.htm). As “bars”
exist in a myriad of combinations (such as cocktail bar, café bar, restaurant-cocktail-bar, pubs, etc.), we searched
for any liquor-licensed premises with “bar” in their names (both English and Chinese). Other crowded facilities
and services such as places of worship, elderly homes, and restaurants may be chosen but there are operational
difficulties due to data availability, privacy concerns, or numerousness of these locations.
We derived human mobility data based on travel-activity diaries from TCS-2011. Although TCS-2011 does
not truly reflect movement situations during the pandemic, it is the latest and detailed territorial-wide travel
characteristics data for the city. Additional pre-processing of TCS-2011 was necessary (see Supplemental Methods
S1.2 & S1.3), as the travel diaries did not differentiate trip purpose for bars and restaurants. Here, we identified
street blocks with a high density of bars that also contained three or more trip records in TCS-2011 and used
them as a proxy for locating bars in Hong Kong. Bars in neighbouring street block(s) and with TCS trip records
were also included for further analysis.
Space–time concept and measurements. First, we introduce the space–time concept and a method
of identifying high-risk public facilities that may give rise to a superspreading environment due not only to the
physical locations (e.g. near the central business district) or the nature of facilities (e.g. being bars or shopping
centres) but also the characteristics of users (e.g. whether they travel from a wider spatial catchment area and
spend substantial out-of-home time with other users having similar lifestyles). Even for the same type of facility
like bars, some bars may be more local “watering holes” (corresponding more to scenario A in Fig. 1) while oth-
ers can attract people from all over the city to hang out and socialize (resembling more to scenario B in Fig. 1).
We made use of time and space information on the mobility pattern of individuals in a city to aggregate the
activity space (AS), space–time prism (STP), and the potential path area or potential risk surface for different
types of activities (see Supplemental Methods S1.4–S1.6) associated with the selected public f acilities27. As illus-
trated in the left panel of Fig. 2, an individual’s recollection of places of visit within a day (including home, all
activity locations and transit stops) can be used to delineate a Standard Deviational Ellipse (SDE) which is used
as the metric of his/her AS (see Supplemental Methods S1.4). For measuring mobility, we used the 2-dimensional
rectangular area bounding the AS and multiply it by the time factor. This measure of STP is a proxy for how far
(space) and how long (time) an individual has taken part in out-of-home activities during a day28. The AS and
Scientific Reports | (2021) 11:4699 | https://doi.org/10.1038/s41598-021-84089-w 4
Vol:.(1234567890)www.nature.com/scientificreports/
corresponding STP for all individuals who visited any of the six types of public facilities recorded in the TCS
database were calculated.
Spatial agglomeration and potential spatial risk (PSR). We established two hypotheses in relation to
the different mobility characteristics of facility users.
H1: Geographical agglomerations of the same type of facilities tend to attract users of higher mobility, as
represented by larger total STP.
H2: Facilities in the core urban areas tend to be used by users with higher total STP.
To test the two hypotheses, the geographical agglomeration level (low vs. high) and the geographical loca-
tions (urban vs. suburb/new town) of each public facility were analysed. Difference-of-means test was used to
see whether the differences of AS and total STP of their respective users were statistically significant at p = 0.05.
Based on the six major types of public facilities (i.e. bars, shopping centres, karaoke & cinemas, mega shop-
ping malls, public libraries, and sports centres) and catchment areas of users with a highly mobile lifestyle, we
asked whether these combinations could be classified into different classes of “potential spatial risk (PSR)” to
differentiate superspreading environments (see right panel of Fig. 2). With spatial agglomeration (high vs. low
facility density and urban vs. suburb AS) as the x-axis and users’ total STP (high vs. low) as the y-axis, each
facility of the same type was assigned into one of the four quadrants to indicate their PSR classes (see Group A
and Group B tables in the right panel of Fig. 2).
If the above two hypotheses hold true which suggests agglomeration as a risk factor, the high-high quadrant
presents the highest PSR in creating a superspreading environment (red quadrant in Group A, Fig. 2). However,
some locations with few establishments (i.e. a lack of agglomeration or H1 is rejected) that are frequented by
highly mobile individuals (i.e. H2 holds true) may also be candidates of a superspreading environment (red
quadrant in Group B, Fig. 2). Class 2 PSR with high population density (orange sections for both Groups A & B
in Fig. 2) signals potential locations of localized outbreaks because of low STP. The number of PSR classes will
be determined based on the data construct. Our example used two classes (low vs. high) on each dimension to
yield four quadrants in total (with the low-low quadrant split by high and low population densities).
To reflect the superspreader characteristics of much higher risks and transmission rates, we weighed the
different PSR classes exponentially with a base of ten to standardise and differentiate risk levels. Finally, the
risk surface of all six public facilities were integrated to produce a “risk map of superspreading environment”
(hereafter referred to as the “SE-risk map”) for the entire city. The method can be adopted in other cities with
reasonably well-established data on travel activities and public facilities.
Tracking AS and validation of the SE‑risk map. The CHP hosts a map-centric dashboard showing key
information about the pandemic, with daily updates (https://chp-dashboard.geodata.gov.hk/covid-19/en.html).
Each case of confirmed and suspected COVID-19 infection gets a unique case number, with the corresponding
home location indicated. The CHP and various groups of scientific researchers have tracked infected individuals
and identified different “clusters” of COVID-19 cases. At least 40 clusters have been identified as at July 13, 2020
and Supplemental Table S1 lists the ten largest clusters. The top-ranked “bar and music band” cluster not only
was the largest so far but also among the earliest in affecting the city.
We chose to focus on these clusters and attempted to obtain more detail about the infected cases from news
media and press releases from the government. Many of the recounts of movement and activity by infected
individuals were incomplete due to memory lapse and possible editing/word limitations set by local news media.
The sequence of visiting different locations was often available from news report but the exact duration of each
activity was not available. We could thus compute only the AS (but not total STP) in the validation analysis.
Generally speaking, the wider is the spatial extent of activities of the confirmed cases linked to hot spots iden-
tified by the SE-risk map, the higher is the value of the current method to pandemic control and public health.
We reconstructed the AS space–time trajectories of the confirmed cases associated with some facilities of class
1 PSR to check the consistency of the findings and establish the value of the SE-risk map in screening facilities
based on historical travel-activity records from TCS-2011. To estimate the value of this approach, the empirical
patterns of COVID-19 cases or disease clusters associated with these popular public facilities were compiled
and the SDE representing AS mapped for geovisualization. Mann–Whitney U test statistics were computed to
ascertain the degree of correspondence (p = 0.05) between the actual AS of confirmed cases and potential AS
based on this approach.
Results
Table 1 shows the summary results of difference-in-means tests for the six public facilities (see Supplemental
Table S2 for detailed statistics). There is evidence to support both H1 and H2 for two types of public facilities:
bars and small-medium shopping centers. These public facilities were associated with users with higher AS and
STP, especially when they existed in high facility agglomerations and in urban areas (Class 1 PSR in Group A,
Table 1). H1 is rejected for the other four types of public facilities: karaoke & cinemas, mega shopping malls,
public libraries, and sports centres. Our results show that this second group of public facilities was associated
with users of higher AS and STP but in areas with lower facility agglomeration (Class 1 PSR in Group B, Table 1),
perhaps suggesting a lack of similar types of provision in the wider communities. Among the four types of public
facilities, H2 is rejected for karaoke and cinemas and sports centres, suggesting that these facilities tended to
attract more mobile users in suburbs compared to urban areas. Furthermore, our results show that the remaining
public facilities (i.e., public libraries and mega shopping malls) frequented by highly mobile users tended to be
the more isolated establishments or locations with low facility agglomeration in the urban setting.
Scientific Reports | (2021) 11:4699 | https://doi.org/10.1038/s41598-021-84089-w 5
Vol.:(0123456789)www.nature.com/scientificreports/
Activity space (AS)a Space–time prism (STP)*
Group A: Agglomeration is a risk factor
Urban vs. suburb Urban vs. suburb
Bars
Low vs. high density Low vs. high density
Urban vs. suburb Urban vs. suburb
Small-medium shopping centres
Low vs. high density Low vs. high density
Group B: Lack of agglomeration is a risk factor
Urban vs. suburb Urban vs. suburb
Karaoke & cinemas
Low vs. high density Low vs. high density
Urban vs. suburb Urban vs. suburb
Mega shopping malls
Low vs. high density Low vs. high density
Urban vs. suburb Urban vs. suburb
Public libraries
Low vs. high density Low vs. high density
Urban vs. suburb Urban vs. suburb
Sports centres
Low vs. high density Low vs. high density
Table 1. Results of difference-in-means tests for the six public facilities. a Bold letterings indicate groups with a
higher mean score (sig. < 0.05).
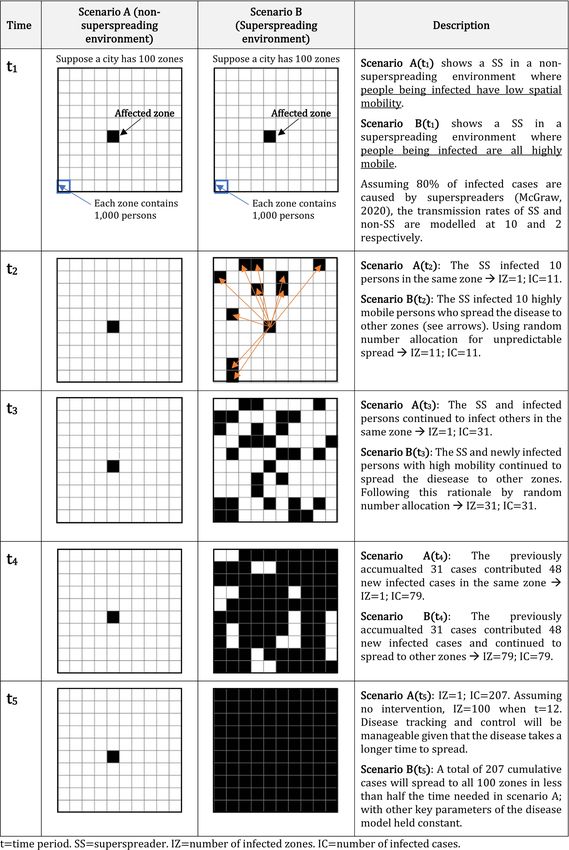
Next, the full list of six types of public facilities was integrated and the resultant locations assigned into four
PSR classes, as shown by Groups A & B in Fig. 2. These locations by PSR classes were visualized in Fig. 3a. Of
particular interests are the red triangles and orange circles representing areas of superspreading environment
and localized infectivity respectively. Figure 3b transformed Fig. 3a from the point symbol representation into
a risk surface or the SE-risk map with darker shading denoting higher risks. The numbered locations represent
empirical data of actual disease clusters occurring between February and July 2020 inclusive. By visual inspection,
the actual disease clusters seem to fall in high-risk areas with identifiable hotspots in Fig. 3b.
To consider the empirical value of the analysis to inform policy makers, we identified two bars designated as
class 1 PSR by our method and plotted the AS space–time trajectory based on TCS-2011 (Fig. 4a). Our method
shows AS of wide coverage indicating patrons of bars were not limited to nearby residents. Then, we reconstructed
the AS time–space trajectory of the infected cases from the same bars based on information from tracing studies
conducted by the CHP and news reports from local media (Fig. 4b). The derived AS show a large spatial extent
of comparable pattern. Mann–Whitney U test indicates no significant difference in the areal coverage of AS
between our method and the actual occurrence (p = 0.76).
Discussion
Targeting the environment to complement superspreader research is needed. Our study illustrates the potential
value of mapping hot spots of superspreading environment in an ex-ante manner by combining geographical
settings with pre-pandemic human mobility data. The SE-risk map can serve as a useful reference for policy
makers in targeting facilities for more differentiated NPIs. The wisdom of Dr John Snow more than 150 years ago
has highlighted the importance of associating disease cases (that is, cholera) with the location of public facilities
(that is, public water pumps)29. Given the challenge of a pandemic with no effective vaccine and cures, NPIs are
necessary to “avoid peaks of cases that would overwhelm hospital and intensive care unit (ICU) capacity and
result in hundreds of thousands of deaths”30(p 1).
Current observations and the global trend have indicated that the COVID-19 pandemic is likely to last
for some time. It has become increasingly difficult to enforce citywide lockdowns that carry serious politi-
cal, economic and social (including health) consequences. Identifying individuals with the disease (at the pre-
symptomatic stage), reducing the time for diagnosis and laboratory tests, proper isolation of the infected, and
tracing of the whereabouts of the individuals that they have been in contact with, will remain critical in this
fight against coronavirus. These persistent efforts have put pressure on people’s everyday life, and the already
strained healthcare and laboratory resources worldwide. One major challenge in a pandemic is the rapid and
unpredictable transmission of disease associated with superspreaders. Using the conceptual and methodologi-
cal framework of superspreading environment, our analysis has demonstrated the potential value of integrating
geographical knowledge and human mobility patterns to predict the “origins” of disease clusters based on the
activity type, facility features, and users’ travel-activity pattern. One limitation of the study is that we had to use
travel characteristics survey data from 2011 to analyze a pandemic of 2020. Since that year, complex changes in
people’s activity-travel patterns may have happened as the city’s urban form and transport system evolved. This
issue may hinder the accuracy of the study. With more updated data, the results of the study would be more
accurate. Despite this limitation, the usefulness of the technique was validated. Besides, the selection of public
facilities conducive to disease spread and insights derived from the potential risk surface may be more applicable
to COVID-19 in particular and other respiratory pathogens in general, and somewhat relevant to infectious dis-
eases with other modes of transmission. The generalizability of the potential risk surface may thus be constrained.
In terms of future research directions, more factors which are known to contribute to the formation of
superspreading environment, such as poor indoor ventilation, can be considered and integrated into the current
analysis. In parallel, there is a need to refine the research by considering more characteristics both about the users
and the facilities. For the former, superspreaders of certain occupations working in a superspreading environment
may result in even higher public health risk. For the latter, facilities located at mixed commercial-residential areas
Scientific Reports | (2021) 11:4699 | https://doi.org/10.1038/s41598-021-84089-w 6
Vol:.(1234567890)www.nature.com/scientificreports/
Figure 3. Public facilities by potential spatial risk (PSR) (a) and risk map of superspreading environment
(SE-risk map) (b). (a) Symbol locations correspond to four PSR classes as shown in the map legend. (b) Top
ten locations of empirical local cluster infection (numbered 1–6) plotted against the SE-risk map, a generalized
surface of potential superspreading risks with darker shadings indicating higher risks of infection. The empirical
local cluster infection cases of COVID-19 shown above included the top 10 infected clusters with the highest
number of cases recorded between February and July 2020. (Generated by ArcGIS 10.5, URL: http://www.esri.
com/software/arcgis/arcgis-for-desktop).
can be an extra risk factor. In addition, our current study made use of historical travel characteristic data to com-
pute AS and STP of individuals. The widespread use of smart cards and mobile devices with self-tracking applica-
tions and big data analytic software can provide more refined mobility data to construct the SE-risk map using
our proposed m ethod31,32. Nonetheless, NPIs that focus on modified human behaviours from wearing masks
and hand disinfection to reducing travel and social activities must go hand in hand in fighting the pandemic.
Scientific Reports | (2021) 11:4699 | https://doi.org/10.1038/s41598-021-84089-w 7
Vol.:(0123456789)www.nature.com/scientificreports/
Figure 4. Activity space (AS) based on (a) travel characteristic survey versus (b) empirical data. No significant
difference in the size of AS for both (a) and (b). Two-sided Mann–Whitney U test indicates that the AS of
individuals who visited street blocks of bars in class 1 PSR (n = 2,463; mean rank = 1,248.97) and the empirically
infected cases from bars (n = 35; mean rank = 1,286.74) in class 1 PSR were NOT significantly different in size
(p = 0.758). Extreme outliers were removed. (a) AS of individuals who visited bars in class 1 PSR based on TCS-
2011. Two-sided Mann–Whitney U test indicates the AS of individuals visiting bars in class 1 PSR (n = 2463;
mean rank = 3437.18) is higher than those visiting bars in class 3 PSR (n = 3887; mean rank = 3009.68) (Z = −
9.06; p = 0.000). Extreme outliers were removed. (b) AS of individuals infected with COVID-19 and had visited
bars in class 1 PSR. Two-sided Mann–Whitney U test indicated the AS of individuals visiting bars in class 1 PSR
(n = 35; mean rank = 23.77) is higher than those visiting bars in class 3 PSR (n = 8; mean rank = 14.25) (Z = − 1.94;
p = 0.026). Extreme outliers were removed. (Generated by ArcGIS 10.5, URL: http://www.esri.com/software/
arcgis/arcgis-for-desktop).
Data availability
All data generated during this study are included in the main text and supplementary information. The mobil-
ity data from Travel Characteristics Survey 2011 (TCS-2011) used to support the findings in this study are not
publicly available because the dataset is under a license from the data provider. Some aggregated information is
publicly available online (https://www.td.gov.hk/filemanager/en/content_4652/tcs2011_eng.pdf). The mobility
data of empirical cases were compiled by the authors based on publicly available data from the Centre for Health
Protection of the Hong Kong Government (https: //www.corona virus .gov.hk/ eng/index.html) and crowd-sourced
information from local news reports and social media.
Received: 8 September 2020; Accepted: 9 February 2021
References
1. McGraw, E. What is a Super Spreader? An Infectious Disease Expert Explains. https://theconversation.com/what-is-a-super-sprea
der-an-infectious-disease-expertexplains-130756 (2020).
2. Lai, S. et al. Effect of non-pharmaceutical interventions to contain COVID-19 in China. Nature https://doi.org/10.1038/s4158
6-020-2293-x (2020).
3. Cowling, B. J. et al. Impact assessment of non-pharmaceutical interventions against coronavirus disease 2019 and influenza in
Hong Kong: An observational study. Lancet Public Health. 5, e279–e288 (2020).
4. Kochanczyk, M., Grabowski, F. & Lipniacki, T. Accounting for super-spreading gives the basic reproduction number R0 of COVID-
19 that is higher than initially estimated. R. Soc. Open Sci. 7(9), 200786. https://doi.org/10.1098/rsos.200786 (2020).
5. Lloyd-Smith, J., Schreiber, S., Kopp, P. & Getz, W. M. Superspreading and the effect of individual variation on disease emergence.
Nature 438, 355–359 (2005).
6. Adam, D. C. et al. Clustering and superspreading potential of SARS-CoV-2 infections in Hong Kong. Nat. Med. 26, 1714–1719
(2020).
7. Kwok, K. O. et al. Inferring super-spreading from transmission clusters of COVID-19 in Hong Kong, Japan and Singapore. J. Hosp.
Infect. 105(4), 682–685 (2020).
8. Lai, P. C. et al. An early warning system for detecting H1N1 disease outbreak—A spatio-temporal approach. Int. J. Geogr. Inf. Sci.
29, 1251–1268 (2015).
9. Fischer, K. Central places: The theories of von Thünen, Christaller, and Lösch. in Foundations of Location Analysis. International
Series in Operations Research & Management Science (ISOR 155) (eds Eiselt, H. & Marianov, V.) (Springer, 2011).
10. Hillier, B. Centrality as a process: Accounting for attraction inequalities in deformed grids. Urban Des. Int. 4, 107–127 (1999).
11. Lai, P. C., Kwong, K. H. & Wong, H. T. Spatio-temporal and stochastic modelling of the severe acute respiratory syndrome (SARS).
Geospat. Health. 8, 183–192 (2013).
12. Wang, F., Chen, C., Xiu, C. & Zhang, P. Location analysis of retail stores in Changchun, China: A street centrality perspective.
Cities 41, 54–63 (2014).
13. Su, J. G., Jerrett, M., Meng, Y. Y., Pickett, M. & Ritz, B. Integrating smart-phone based momentary location tracking with fixed site
air quality monitoring for personal exposure assessment. Sci. Total Environ. 506–507, 518–526 (2015).
14. Yu, I. T. S. et al. Evidence of airborne transmission of the severe acute respiratory syndrome virus. N. Engl. J. Med. 350(17),
1731–1739 (2004).
Scientific Reports | (2021) 11:4699 | https://doi.org/10.1038/s41598-021-84089-w 8
Vol:.(1234567890)www.nature.com/scientificreports/
15. Gao, N. P., Niu, J. L., Perino, M. & Heiselberg, P. The airborne transmission of infection between flats in high-rise residential
buildings: Particle simulation. Build Environ. 44(2), 402–410 (2009).
16. Ferguson, N. et al. Report 9: Impact of Non-Pharmaceutical Interventions (NPIs) to Reduce COVID19 Mortality and Healthcare
Demand. https://www.imperial.ac.uk/mrc-global-infectious-disease-analysis/covid-19/report-9-impact-of-npis-on-covid-19/
(2020).
17. Flaxman, S. et al. Report 13: Estimating the Number of Infections and the Impact of Non-Pharmaceutical Interventions on COVID-19
in 11 European Countries. https://www.imperial.ac.uk/mrc-global-infectious-disease-analysis/covid-19/report-13-europe-npi-
impact/ (2020).
18. Liu, Y., Eggo, R. M. & Kucharski, A. J. Secondary attack rate and superspreading events for SARS-CoV-2. Lancet 395, e47 (2020).
19. Colbourn, T. COVID-19: Extending or relaxing distancing control measures. Lancet Public Health. 5, e236–e237 (2020).
20. Baker, M. G., Wilson, N. & Anglemyer, A. Successful elimination of Covid-19 transmission in New Zealand. N. Engl. J. Med. 383,
e56 (2020).
21. Han, E. et al. Lessons learnt from easing COVID-19 restrictions: An analysis of countries and regions in Asia Pacific and Europe.
Lancet 396(10261), 1525–1534 (2020).
22. 22Oxford COVID-19 Government Response Tracker project. https://www.bsg.ox.ac.uk/research/research-projects/coronaviru
s-government-response-tracker (2020).
23. Lam, W. W. Y., Yao, S. & Loo, B. P. Y. Pedestrian exposure measures: A time-space framework. Travel Behav. Soc. 1, 22–30 (2014).
24. Cohen, J. & Kupferschmidt, K. Countries test tactics in ‘war’ against COVID-19. Science 367, 1287–1288 (2020).
25. Lai, P. C. et al. Understanding the spatial clustering of severe acute respiratory syndrome (SARS) in Hong Kong. Environ. Health
Perspect. 112, 1550–1556 (2014).
26. Shen, Y. et al. A cluster of novel coronavirus disease 2019 infections indicating person-to-person transmission among casual
contacts from social gatherings: an outbreak case-contact investigation. Open Forum Infect. Dis. 7, ofaa231 (2020).
27. Yao, S., Loo, B. P. Y. & Lam, W. W. Y. Measures of activity-based pedestrian exposure to the risk of vehicle-pedestrian collisions:
Space-time path vs. potential path tree methods. Accid. Anal. Prevent. 75, 320–332 (2015).
28. Tsoi, K.H. Transport equity: A spatio-temporal analysis of commuting in Hong Kong. in Proceedings of the 24th Conference of Hong
Kong Society for Transportation Studies (HKSTS) 2019 (2019).
29. Pietz, J., McCoy, S. & Wilck, J. H. Chasing John Snow: Data analytics in the COVID-19 era. Eur. J. Inf. Syst. https://doi.
org/10.1080/0960085X.2020.1793698 (2020).
30. Colbourn, T. Unlocking UK COVID-19 policy. Lancet Public Health. 5, e362–e363 (2020).
31. Davalbhakta, S. et al. A systematic review of smartphone applications available for corona virus disease 2019 (COVID19) and the
assessment of their quality using the mobile application rating scale (MARS). J. Med. Syst. 44(9), 164 (2020).
32. Wu, J., Wang, J., Nicholas, S., Maitland, E. & Fan, Q. Application of big data technology for COVID-19 prevention and control in
China: Lessons and recommendations. J. Med. Internet Res. 22(10), e21980 (2020).
Acknowledgements
We would like to thank all panellists and participants of COVID-19 and Geography seminar series for their
support and insights in inspiring this research.
Author contributions
B.L.: conceptualisation, methodology, supervision, writing original draft, review & editing. K.H.T.: investigation,
methodology, data curation, data analysis, writing—review & editing. P.W.: data curation, data analysis, visualisa-
tion, writing—review & editing. P.C.L.: methodology, visualisation, interpretation, writing—review & editing.
Competing interests
The authors declare no competing interests.
Additional information
Supplementary Information The online version contains supplementary material available at https://doi.
org/10.1038/s41598-021-84089-w.
Correspondence and requests for materials should be addressed to P.C.L.
Reprints and permissions information is available at www.nature.com/reprints.
Publisher’s note Springer Nature remains neutral with regard to jurisdictional claims in published maps and
institutional affiliations.
Open Access This article is licensed under a Creative Commons Attribution 4.0 International
License, which permits use, sharing, adaptation, distribution and reproduction in any medium or
format, as long as you give appropriate credit to the original author(s) and the source, provide a link to the
Creative Commons licence, and indicate if changes were made. The images or other third party material in this
article are included in the article’s Creative Commons licence, unless indicated otherwise in a credit line to the
material. If material is not included in the article’s Creative Commons licence and your intended use is not
permitted by statutory regulation or exceeds the permitted use, you will need to obtain permission directly from
the copyright holder. To view a copy of this licence, visit http://creativecommons.org/licenses/by/4.0/.
© The Author(s) 2021
Scientific Reports | (2021) 11:4699 | https://doi.org/10.1038/s41598-021-84089-w 9
Vol.:(0123456789)You can also read