The epidemiological impact of the NHS COVID-19 App - Newtral
←
→
Page content transcription
If your browser does not render page correctly, please read the page content below
The epidemiological impact of the NHS COVID-19 App Chris Wymant*1, Luca Ferretti*1, Daphne Tsallis2, Marcos Charalambides3, Lucie Abeler-Dörner1, David Bonsall1, Robert Hinch1, Michelle Kendall1,4, Luke Milsom5, Matthew Ayres3, Chris Holmes1,3,6, Mark Briers3, Christophe Fraser†1 *equal contribution † correspondence to christophe.fraser@bdi.ox.ac.uk 1 Big Data Institute, Li Ka Shing Centre for Health Information and Discovery, Nuffield Department for Medicine, University of Oxford, Oxford, UK 2 Zühlke Engineering Ltd., London, UK 3 The Alan Turing Institute, London, UK 4 Department of Statistics, University of Warwick, Coventry, UK 5 Department of Economics, University of Oxford, Oxford, UK 6 Department of Statistics, University of Oxford, Oxford, UK Last updated 9 Feb 2021 - For public release Abstract Since its launch on 24 September 2020, the NHS COVID-19 app has been downloaded to over 21 million phones, and used regularly by approximately 16.5 million users in England and Wales, which is 49% of the eligible population with compatible phones, and 28% of the total population. The main epidemiological impact of the app to date has been from the exposure notification function, which automates contact tracing from confirmed cases based on digital measurements of proximity events between phones. The app sent 1.7 million exposure notifications: 3.2 per index case, or 4.4 per index case who consented to be contact traced. We estimated that 6.1% of app-notified individuals subsequently tested positive (the secondary attack rate, SAR), comparable to the SAR for manual contact tracing (7.3% for close contacts and 13.5% for direct contacts). We estimated infected cases averted by the app in October-December 2020 using two conceptually complementary approaches. Modelling based on the observed notifications and SAR yielded 284,000 (224,000-344,000) averted cases, whilst statistical comparison of matched neighbouring local authorities yielded 594,000 (317,000-914,000) averted cases, i.e. about one case averted for each case consenting to notification of their contacts through the app. Improvements in the app notification system gave increased epidemiological effectiveness of the app, further supporting evidence for an effect of the app. We estimated that for every 1% increase in app users, the number of infections can be reduced by 0.8% (from modelling) or 2.3% (from statistical analysis). The United Kingdom has been heavily hit by the COVID-19 pandemic, recording one of the highest confirmed death rates in the world in 2020 and experiencing two waves in spring and autumn, and a third in winter due to the B.1.1.7 SARS-CoV-2 variant. In order to help control the spread of the disease, the NHS COVID-19 app was launched in England and Wales on 24 September 2020, early in the second wave. Out of 33.7 million eligible people with compatible
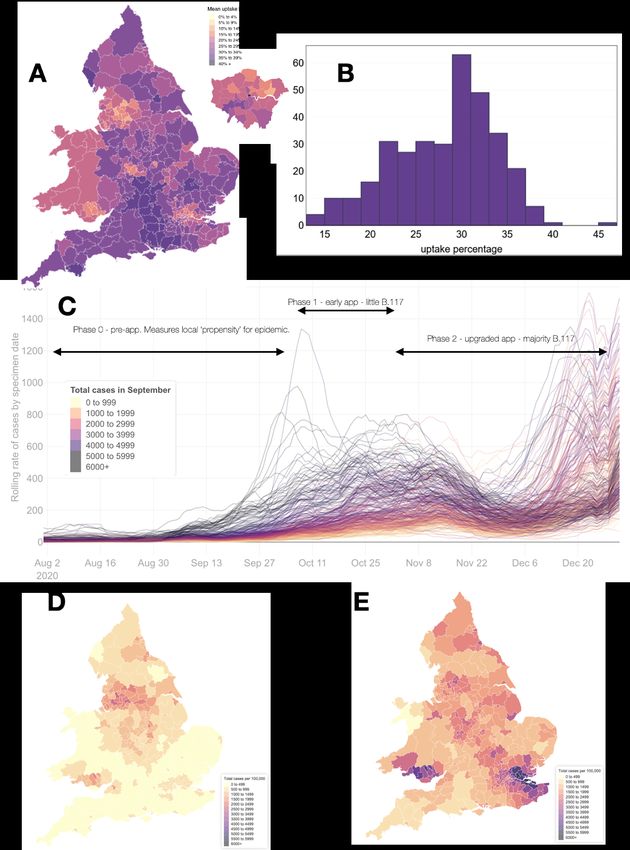
smartphones, the app has been downloaded on 21 million unique devices, and is regularly used by at least 16.5 million users. The app provides a number of functions that were expected to reduce the spread of COVID-19. The main function is ‘digital contact tracing’ (Ferretti, Wymant, et al. 2020; Kretzschmar et al. 2020; Lunz, Batt, and Ruess 2020; Abueg et al. 2020; Lambert 2020; Cencetti et al. 2020) using the Google Apple Exposure Notification (GAEN) system. GAEN is embedded in the Android and iOS operating systems and allows privacy-preserving contact tracing (Google/Apple 2020; Troncoso et al. 2020). App users can be notified if they had a contact with another user later confirmed to have COVID-19. If the exposure has characteristics that exceeded a risk threshold, the user will receive an exposure notification and an instruction to quarantine. App-based contact tracing is a novel public health measure, with limited empirical validation or estimates of epidemiological impact. Users also check into venues using a custom QR code scanner, and may receive notifications that they have visited risky venues. This feature enables a degree of “backwards” contact tracing, where a common source for clusters of cases can be found (Endo et al. 2020). In addition, the app includes a symptom checker linked to the booking of PCR tests, automated reporting of a majority of test results in the app, and locally appropriate information on COVID-19 prevention. When installing the app, users enter their postcode district (the first half of the postcode), allowing analysis of geographic variation in app use. For consistency between data sources, we aggregated data at the level of lower tier local authorities (LTLAs), of which there are 338 in England and Wales. We defined app uptake as the mean number of active users over November and December, divided by the population size. App uptake was variable between LTLAs (Figures 1A and 1B), with an interquartile range of 24.8 - 33.2%. We defined three phases for the analysis, shown in Figure 1C: phase 0 before app launch, phase 1 from 1 October to early November 2020 (first version of app) and phase 2 from early November to 31 December 2020 (improved version of app). These are described in more detail in Table 1. Phases in the app precede phases in the resulting cases: there is a lag between changes in transmission rates and changes in confirmed cases, we assumed by 8 days. Other factors beside the app changed during these phases. Phase 1 saw increases and local targeted and tiered control measures, phase 2 saw first a reduction due to the November lockdown and then a rise in December, mostly driven by the new variant B.1.1.7 (Figure 1C-E).
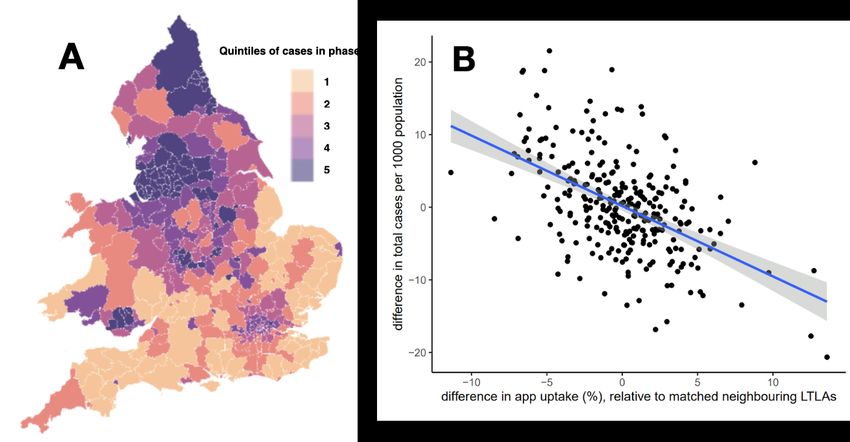
Figure 1: geographical variability, at the Lower Tier Local Authority (LTLA) level, of both app uptake and number of COVID cases. Panel A: mean app uptake by LTLA in phase 2/3, as a map. Panel B: mean app uptake by LTLA in phase 2/3, as a histogram. Panel C: the seven-day rolling mean of the number of daily confirmed COVID-19 cases per 100,000 population, by date of specimen, coloured by the cumulative per-capita number of cases in September. Each LTLA is shown as one line. Bold black horizontal arrows indicate the different phases of the app intervention, and the appearance of the new B.117 viral variant of concern. Panel D: cumulative number of confirmed cases (by specimen date) in phase 1, by LTLA. Panel
E: as Panel D but in Phase 2. Panels C-E are based on public data on the total number of
people tested positive for COVID, not app users specifically.
Phase Date range Rationale Additional context
for cases*
0 1 Aug 2020 - Two months of baseline data before the introduction of the app. Infection rates grew
30 Sept 2020 Used for adjustment and stratification of analyses. We ignore approximately exponentially.
the effects of pilot studies in Newham and the Isle of Wight.
Deployment 1 Oct 2020 - The number of app users increased rapidly in the first week after
7 Oct 2020 launch (24-30 Sep). This phase is excluded from our statistical
analysis (which assumes a steady-state number of users) but
not from our modelling approach.
1 8 Oct 2020 - The phase begins with stabilisation of number of app users, and Local alert levels (3-tier
6 Nov 2020 ends with release of version 3.9 of the app (29 Oct). During this system) in England from 14
phase the app used a simple implementation of GAEN with a Oct.
conservative (high) threshold for triggering exposure Firebreak lockdown in Wales
notifications. 23 Oct - 9 Nov.
2 7 Nov 2020 - The phase begins with release of version 3.9 of the app, when a England lockdown until 2
31 Dec 2020 custom risk scoring system for exposure notification was Dec, 3-tier system
introduced in England and Wales and the number of afterwards.
notifications per index case increased immediately by a factor of Emergence of the new
2. The phase ends when the threshold risk score for exposure
notification was reduced, leading to a further immediate increase B.1.1.7 viral variant.
in the number of notifications. Tier 4 introduced on 20 Dec.
3 1 Jan 2021 We exclude this phase from our analysis, because the app was
onwards sufficiently different from phase 2 to be separate, but there were
not enough data for reliable analysis.
App 8 Oct 2020 - Combined period for the overall effect of the app, at the present
11 Jan 2021 time of analysis
Table 1. Phases of the analysis, and their justification in terms of changes to the NHS
COVID-19 App. *Changes in case numbers resulting from changes to the app will lag behind in
time; we assumed by 8 days, hence for example the change in the app occurring on 23
December is not expected to be reflected in case numbers until 31 December.
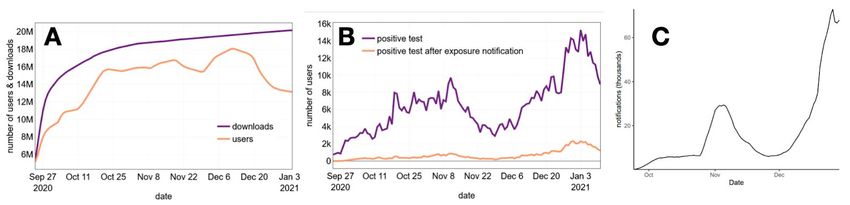
Figure 2: characterising the behaviour of the app. A: the total number of app downloads and
active users over time. Fluctuations in app users are artifactual, driven by reporting issues on
Android handsets, such that the estimate of ‘active users’ is a lower bound estimate. B: the daily
number of app users receiving a confirmed positive test, and the daily number of those who hadalready been advised to quarantine due to receiving an exposure notification. C. The total number of notifications triggered each day. Roughly 1.75 million exposure notifications were sent as a result of 560,000 app users testing positive over the whole time period: a mean number of notifications per index case of 3.2. Since 72% of app-using index cases consented to app-based contact tracing after receiving a positive test, the number of notifications per contact tracing event was 4.4. For comparison, the mean number of contacts traced per index case by the central manual tracing system in the same period is 1.8 in phases 1 and 2 combined. (https://www.gov.uk/government/publications/nhs-test-and-trace-england-statistics-24-december-t o-30-december). Unlike for manual contact tracing, we do not know any details of the nature of the contacts that resulted in a contact tracing notification. We can however indirectly infer that they are likely in large part non-overlapping with those found by manual contact tracing. The majority of contacts found by manual contact tracing live in the same household as the index case (68% according to (Lee et al. 2021)). In England and Wales, each adult lives with an average of 0.9 other adults, and therefore, given that users of the app must be aged over 16, it seems highly likely that most of the 4.4 adults contact traced by the app do not live in the same household as the index case. The total number of notifications is shown in Figure 2. An important question regards the probability that an app user who receives an exposure notification is actually infected. We partially address this by reporting the secondary attack rate (SAR) in app users, which is the probability that someone who receives a notification later tests positive within two weeks of being notified. We estimated this to be 6.1%. This estimate does not count individuals who were infected, but who did not test, or who did test but did not enter the result in the app; only individuals who were notified and received a positive test contribute to this, whilst all notified individuals are counted in the denominator. Data to estimate this was available only for phase 3, in January 2021, after a change in the threshold for risk calculation which meant that more notifications were being sent than during phases 1 and 2. Our estimate is commensurate with the SAR observed in encounters with relatives and social contacts, at the workplace and in school (Koh et al. 2020; Public Health England 2020b; Lee et al. 2021). The SAR for close contacts identified by manual contact tracing during December 2020 and January 2021 was 7.2% for close contacts and 13.0% for direct contacts (Public Health England 2020b). An in depth investigation of the SAR for manual contact tracing in an earlier time period (Lee et al. 2021), perhaps better corresponding to our period of analysis, suggested an overall SAR of 6.4%, and a SAR of 4.6% for contacts not with other members of the household. In summary, contact tracing with the app identifies contacts who are approximately equally likely to be infected than with manual contact tracing. These results indicate that the app is functioning at a technical level: sending an appropriate number of exposure notifications, and to the right people. Technical functioning of the Swiss and Spanish COVID-19 tracing app have recently been demonstrated (Salathé et al. 2020; Rodríguez et al. 2021). The epidemiological functioning of the app -- the number of infections
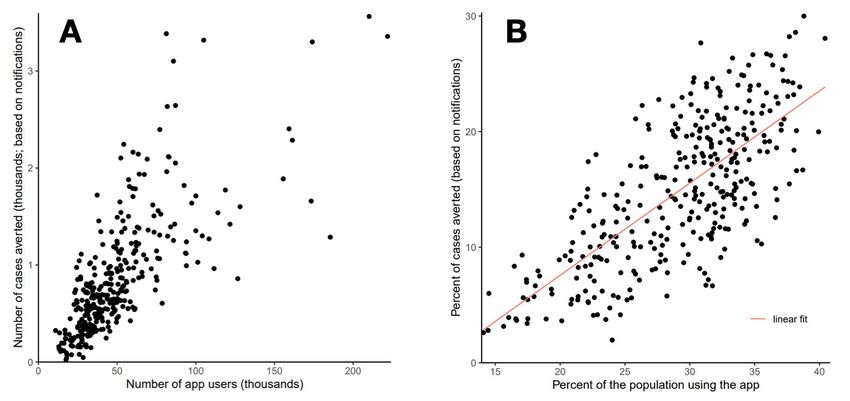
averted -- depends on the degree of complementarity of the app with other interventions, the timeliness of exposure notifications (see Supplementary figure 3), and adherence to quarantine. To evaluate this epidemiological effect we used two complementary approaches. First, we modelled the number of cases averted using the number of observed notifications and the SAR in app users. Second, we performed statistical comparisons of cumulative cases in neighbouring LTLAs with a similar baseline infection rate. To model the impact of the app, we started from the number of notifications in each local area (Figure 2C and 2D) and modelled the likely impact in averting cases downstream. For a notification to prevent infections the notified person must be infected, and so calculating the number of cases averted requires multiplying the number of notifications by the SAR. The number of transmissions averted depends also on the timeliness of the notification relative to onwards transmission (Ferretti, Wymant, et al. 2020), which can be quantified in terms of the delay between exposure and notification. Adherence to instructions to quarantine is critical but hard to assess reliably. UK surveys found only 11% of individuals in quarantine declared proper adherence to quarantine rules, but 65% of individuals intended to adhere to quarantine (Smith et al. 2020), albeit imperfectly. In this more pessimistic scenario, the total number of predicted averted cases during the period 24 Sep - 29 Dec would be 176,000, assuming 50% adherence to imperfect quarantine (95% credibility interval: 56,000-295,000). Recent surveys found a high adherence to quarantine (greater than 80%) (Fancourt et al. 2020), and this behaviour may be more representative of app users. In this more optimistic scenario, the number of averted cases is approximately 382,000 (95% credibility interval: 364,000-399,000). We considered an intermediate scenario of 61% overall effectiveness of quarantine in preventing transmissions as our central estimate, corresponding to 279,000 cases averted (95% credibility interval: 210,000-347,000). The predicted number of cases averted was higher in areas of high app uptake (Figure 3). The slope of the regression in Figure 3B indicates that the fraction of cases averted increases by 0.8% for every 1% increase in app uptake (Table 2).
Figure 3: the predicted cases averted in each LTLA, in Phases 1 and 2 combined, as a function of local app uptake. A: predicted number of cases averted. B: predicted percent of cases averted (among all cases observed or averted). Our second approach to evaluate the impact of the app was to link the variation in app uptake between LTLAs with the variation in cumulative cases. We took care to account for strong confounding factors. We therefore used a stratified approach, only comparing LTLAs with similar socio-economic and geographic properties. We used several different ways of grouping LTLAs into comparable units, and found similar results; one is described below, with the others in Supplementary Information. People who use the app live in LTLAs which, compared to the national average, have lower levels of poverty, are more rural, and have higher local GDP (see Supplementary Information section on confounding). We included these variables in the regression to measure an effect of the app adjusting for these known confounders. We expected that app uptake would also be associated with other factors that affect epidemic dynamics but which were not directly measured, such as adherence to social distancing measures, use of face masks, etc. Since these factors affected case numbers before app release, app uptake should have some correlation with case numbers even before app release. To test this, we regressed the number of cases in Phase 0 (before release of the app) on a number of covariates including the later uptake of the app. App uptake was indeed a major predictor of Phase 0 cases (see Supplementary Information). To account for this confounding effect, we stratified LTLAs into quintiles based on their Phase 0 cases, and only compared within these strata. With this stratification, the correlation between app uptake and pre-app cases disappeared, i.e. this adjusted for unmeasured confounders (see Supplementary Information, “Placebo regression”). The number of confirmed cases in an LTLA is also confounded by those in neighbouring LTLAs, therefore we only compared neighbouring LTLAs (those sharing a border). We found that the difference in number of cases per capita between neighbouring LTLAs, matched by Phase 0 case number quintile, was strongly and robustly associated with differences in app use, whether or not we adjusted for other demographic confounders (Figure 4, Table 2, and Supplementary Information for Robustness analyses).
Figure 4. A: a map showing the quintiles of cases per capita LTLAs during Phase 0. We only
compared each LTLA to other neighbouring LTLAs within the same quintile. B: the unadjusted
relationship between difference in app uptake and difference in number of cases per capita in
Phases 1-3 combined.
Disaggregating the effect by phase, we found that it was larger during the second phase (Table
2). This is consistent with the sudden increase in the number of notifications sent out by the app
during phase 2 (Figure 2C). Table 2 shows the estimated effect size replicated in a number of
different statistical analyses (see Supplementary Information for details).
Percent reduction in cases for every percent increase in app use
Analysis Phase 1 Phase 2 Overall
Modelling 0.32 (0.30 - 0.35) 0.92 (0.84 - 1.0) 0.79 (0.71 - 0.87)
Matched neighbours 1.09 (0.04 - 2.14) 2.66 (1.75 - 3.56) 2.26 (1.50 - 3.00)
regression (bootstrap: 0.15 - 2.16) (bootstrap: 0.80 - 4.71) (bootstrap: 1.60 - 3.19)
Secondary analyses Phase 1 Phase 2 Overall
Stratified linear regression -1.05 (-2.08 - -0.04) 3.34 (2.53 - 4.14) 2.76 (2.16 - 3.35)
in clusters
Matched pairs regression* 5.08 (1.77 - 8.40) 3.89 (1.05 - 6.74) 4.39 (1.70 - 7.08)
Matched pairs regression 4.49 (0.21 - 8.77) 3.11 (-0.14 - 6.35) 3.67 (0.31 - 7.02)
adjusted for local
efficiency of manual
contact tracing*Table 2. The estimated effect of the app, measured as the percent reduction in cases for every percent increase in app use, based on different analytical approaches. The two primary approaches -- modelling and matched neighbours -- are described in the main text. The three robustness checks for the statistical analysis are described in the Supplementary Information. Ranges shown are 95% confidence intervals (CIs) for regressions, and a sensitivity analysis exploring 2.5%-97.5% effectiveness of imperfect quarantine for the modelling. *Is restricted to England only, and uses data on the national NHS Test & Trace contact tracing program aggregated by Upper Tier Local Authority. Measure of manual contact tracing quality is the proportion of contacts reached per case. We translated both the modelling and statistical findings into estimates of cases averted in Table 3. These estimates are comparable to the number of app users who tested positive and consented for notifications to be sent: roughly 400,000. This finding suggests that on average, each confirmed case who consented to notification of their contacts through the app prevented one person from becoming infected. Analysis Cases averted in phases 1 and 2 combined Deaths averted in phases 1 and 2 combined Modelling 279,000 (210,000 - 347,000) 4,100 (3,100 - 5,100) Matched 594,000 (317,000 - 914,000) 8,700 (4,700 - 13,500) neighbours Table 3. Cases averted, as predicted by the different approaches. The total number of cases and deaths that actually occurred in phases 1 and 2 combined was 1,892,000 and 32,500, respectively. Ranges shown are 95% CIs for regressions, and a sensitivity analysis exploring 2.5-97.5% effectiveness of imperfect quarantine for the modelling. Deaths averted were estimated using the empirical case fatality rate. Finally, we extrapolated the findings to explore different ways in which the app could be improved, by re-running scenarios with different parameters (Table 4). Even though these are retrospective projections, the expected reductions in number of cases are relevant when considering forward projections.
Percent reduction in total case burden in phase 2 (in addition to
reductions observed for the current implementation of the app)
Analysis Modelling Statistical extrapolation
Increase uptake to 35.9% - current 90th 11% (8-13%) 21.0% (14.5-26.8%)
percentile - for all LTLAs (Improve equity)
Increase uptake across the board by 20 23% (18-29%) 41.5% (29.5-51.5%)
percentage points (Mass improvement)
Switch to opt-out notification (5% drop-off)* 6.5% (4.9-8.1%) NA
Improve adherence to quarantine by 20 6.8% (5.1-8.5%) NA
percentage points
Reduce time to test result by one day** 3.6% (2.7-4.5%) NA
Table 4. Scenarios for improvements, in terms of the percent reduction in total case burden that
would have occurred during phase 2. This is the further reduction relative to the cases that
actually occurred, not relative to cases inferred in the absence of the app. Ranges shown are
95% CIs for regressions, 2.5-97.5% effectiveness of imperfect quarantine for the modelling.
*Currently, the app requires consent after the receipt of a positive test for contact tracing to be
initiated, which is provided by 72% of users. We assume that changing to opt-out consent, e.g.
by consent at registration, would increase this to 95%. **Reducing test turnaround time has
many benefits not modelled here, here the effect is only that mediated through the app.
Discussion
Our analysis suggests a relatively large number of COVID-19 cases were averted by contact
tracing via the NHS app, ranging from approximately 200,000 to 900,000 depending on the
details of the method, compared to the 1.9 million cases that actually arose. Averted cases were
concentrated in Phase 2, covering November and December 2020, after a major upgrade to the
app’s risk scoring function (Lovett et al. 2020). These findings can be compared to prior results
from modelling, such as our report to NHSx (Hinch et al. 2020). Applying our individual-based
simulation of a contact tracing app (Hinch R and Probert WJM et al. 2020), with a similar
mechanism calibrated to a different setting, Abueg et al estimated that a 30% uptake of the app
would result in approximately 1 infection averted for every 4 infections arising for 4.5 months of
action (Abueg et al. 2020). Our estimates are in line with these expectations, and also with an
approximately exponential dependence of the number of cases averted on uptake over the
observed range of uptakes. Problems with contact tracing can cause large increases in
infections: one estimate attributed 127,000 additional cases to the failure to manually trace
contacts of 16,000 index cases in a timely manner (Fetzer and Graeber 2020). Equivalently,
improvements to contact tracing -- such as adding app-based proximity detection and
notification to the traditional manual system -- can cause large reductions in infections.Though it is informative to estimate effects on the time-varying reproduction number R, as done for example in (Flaxman et al. 2020), we did not pursue this analysis here. The epidemic dynamics of individual LTLAs are difficult to interpret: the time period of analysis coincided with staggered introductions of locally targeted restrictions, a short national lockdown, the Christmas holiday season, and the emergence of the B.117 variant genotype, which is more infectious and has rapidly become the majority variant spreading nationally across the country (Volz et al. 2021; Davies et al. 2020; Vöhringer et al. 2020; Public Health England 2020a). Future work could perhaps model all of these effects in a single hierarchical model, permitting joint estimation of the app effect over LTLAs with linked drivers and dynamics. Careful construction of counterfactual time series could also be considered (Brodersen et al. 2015). Our simpler approaches have the benefit of transparency, and we hypothesise that under negative-feedback dynamics, appropriately constructed comparisons of total case counts over a sufficiently long time period may reveal underlying propensity for disease spread. The main limitation of our analysis is that it is an observational study: no randomized or systematic experiment resulted in different app uptake in different places. Interpreting observational analyses requires particular care due to the risk of confounding. To mitigate inherent limitations, we combined a modelling approach based on the number of exposure notifications sent and the observed secondary attack rate, with a statistical approach that was stratified to focus on differences between directly comparable areas only. Our modelling approach was based on the mechanistic function of the app. Our statistical approach was based on emulating how a cluster randomised trial would have been conducted (Hernán and Robins 2016). To test for the tendency of the statistical method to be biased by confounding factors, we conducted a placebo analysis (see Supplementary Information). The method was found, reassuringly, to give a null association for the placebo analysis. Nonetheless, it remains possible that changes in app use over time and across geographies reflect changes in other interventions, and that our analysis incorrectly attributes the effect to the app. Our modelling approach is less prone to this bias than our statistical approach. A second limitation of our analysis is that we did not have data on the combined effect of manual and digital contact tracing. Based on the analysis of delays (Supplementary Information), and on the rate of notifications per index case, we may reasonably infer that the app had a separate and additional effect to manual contact tracing. We confirmed this with an analysis which included adjustment of a metric of quality of manual contact tracing, which did not affect our conclusions. Our statistical approach is less prone to this second source of bias than the modelling approach. The app is best understood as part of a system of non-pharmaceutical interventions, not in isolation. The specific role of app-based contact tracing is to speed up contact tracing, and to reach more people per index case. Contact tracing requires case finding, and so is a follow up to effective, widespread and rapid testing. Contact tracing is not a substitute for social distancing or face covering; control of the epidemic requires all available interventions to work together. Isolation and quarantine can only be effective when financially supported; replacing quarantine by daily testing could improve both specificity and adherence. Outbreak response and backwards contact tracing are ways of increasing the effectiveness of the intervention. Better use of location-specific QR code scanning could help: notifications for 226 risky venue
events have been issued as of 20 Jan 2021. App-based contact tracing may free up resources for specialist contact tracers to focus on investigations of complex local epidemics and outbreaks. The app is working as a public health tool. Improvements were implemented to the risk scoring model that resulted in increased accuracy and efficacy (Lovett et al. 2020). These improvements are currently specific to the NHS app, but are open source and could be incorporated into the Google Apple Exposure Notification system to improve digital contact tracing around the world. Users should be informed that if they receive an exposure notification and are asked to quarantine, the risk that they are infected is similar to that when they were identified by manual contact tracing as a ‘close contact’, i.e. 7.3%. The secondary attack rate of 6.1% is the proportion of people notified by the app who go on to themselves test positive during the period when they were asked to isolate, or in the 14 days after. Since only a fraction of infected people ever test to become confirmed cases, it is not a measure of the proportion of these notified people who are infected. The proportion of contacts that are infected may be twice as high as the secondary attack rate, both for manual and app based contact tracing. The surest way to increase the effectiveness of the programme is to increase uptake, and to provide material support to individuals undergoing isolation and quarantine. Special efforts may be needed to reach underserved communities. Faster testing, perhaps using point-of-care antigen tests, and integration of self-testing with the app could result in better disease control. Widespread vaccination will eventually reduce the need for non-pharmaceutical interventions, but vaccination will unlikely have global reach within the coming months, during which time improved non-pharmaceutical interventions could still prevent many infections (Galanti et al. 2020; Moore et al. 2021). Smartphone use is already global, and thus privacy-preserving contact tracing apps should be further integrated into the public health toolkit. Methods Estimating app uptake. To monitor the safe function of the app and enable its evaluation, a limited amount of data are shared with a secure NHS server. Each active app sends a single data packet daily. The fields in these packets contain no sensitive or identifying information, and are approved and publicly listed by the Information Commissioner [https://www.gov.uk/government/publications/nhs-covid-19-app-privacy-information]. For the reported numbers of downloads, repeat downloads to the same phone are counted only once. The number of active users each day is defined as the number of data packets received by the NHS server; for a single representative value of this quantity, we took the mean over all days in November and December (earlier data was deemed less reliable). We note that there continue to be unexplained fluctuations in reported user numbers on Android phones. To estimate uptake within an LTLA, each postcode district was mapped to the LTLA in which the majority of its population reside, and we took the ratio (number of active users in postcode districts mapped to
this LTLA) / (total population in postcode districts mapped to this LTLA). The population of
England and Wales is 59.91 million, of whom 47.48 are over 16 and thus eligible to use the app
[ONS]. Assuming that England and Wales is representative of the UK, we estimate that 82% of
people aged 16+ have smartphones [OFCOM], and that of smartphones in circulation, 87%
support the Google Apple Exposure Notification system [Department of Health and Social Care,
personal communication]. The denominators for measuring uptake at the national level are
therefore 59.91 million (total population) and 33.87 million (eligible population with compatible
phones).
Defining numbers of cases. The COVID-19 case numbers per day we used here are those
reported at https://coronavirus.data.gov.uk/, by specimen date and LTLA. We obtained
per-capita case numbers at the LTLA level by dividing by LTLA populations reported by ONS.
Testing has been available through the NHS Test and Trace system in all areas throughout the
period, with a median delay of less than 2 days from booking a test to receiving the result.
Testing capacity has mostly exceeded demand, except for two weeks in early September. We
assumed that case ascertainment has been relatively constant over the period of analysis, an
assumption qualitatively supported by the unbiased ONS and REACT studies (Steel and
Donnarumma 2020; Riley et al. 2020).
Estimation of the secondary attack rate amongst exposure notified people. We focussed
on a period in January when these data were linked, rather than earlier periods when isolations
and test positivity were available at the population level. The SAR at time t1 was computed by
comparing the number of cases in exposed users (i.e. those that become positive after being
asked to isolate due to risky contact) I N to the number of exposure notifications N over the
same period: S AR(t) = ∑ pN P (t|y)I N (y)/N (t) , where pN P (tN |tP ) is the probability of a user being
y
notified at time tN conditional on getting a positive test at a later time tP .
Modelling cases averted based on exposure notifications and secondary attack rate. The
effect of notifications received at time t on cases averted can be modelled as the product of (i)
the number of notifications, (ii) the secondary attack rate, i.e. the probability that notified
individuals are actually infected, (iii) the expected fraction of transmissions preventable by strict
quarantine of an infectious individual after a notification, (iv) the actual adherence to quarantine,
and (v) the expected size of the full transmission chain that would be originated by the contact if
not notified. Before each notification, the contact’s app sends a request for permission to the
central NHS server. We estimated the total number of notifications per day on each Operating
System (OS: Android or iOS) from these requests. We estimated the number of notifications per
LTLA from the number of partial days of quarantine (typically corresponding to the first day of
quarantine, i.e. the day of notification) per day, OS and LTLA, rescaling it by a time- and
OS-dependent factor to match the number of notifications per day and OS. The delay between
last exposure and notification is assumed to follow a normal distribution, with time-dependent
parameters estimated via Least Squares from the daily number of notifications and individuals in
quarantine. The fraction of preventable transmissions is estimated from the delay distribution
using the generation time distribution in (Ferretti, Ledda, et al. 2020) with mean 5.5 days. Weassume 97.5% effectiveness of quarantine in preventing transmission with complete adherence,
and 50% as central value for quarantine with imperfect compliance. Finally, the size of the
epidemic chain triggered by a single case is computed assuming that local epidemics do not mix
and that the extra cases do not affect the epidemic dynamic.
Statistical analysis. Each statistic of interest, app uptake, log cases per capita for phase X, %
population living in poverty, rural/urban score and local GDP, is collated by LTLA. Let y label a
local authority, and let M(y) label the subset set of neighbouring (adjacent) LTLAs that are in the
same quintile of cases for phase 0. Each statistic f_y measured in y is compared to the
population-weighted mean in matched neighbours f_M(y), such that D_f_y is the difference in f
between x and its matched neighbours. Effects are estimated by regressing D_logcases_y for
each phase with predictor variables D_uptake_y, D_poverty_y, D_rural_y and D_GDP_y. Full
results of regression are shown in Supplementary Materials. Predictions for cases averted are
found using the regression coefficient beta_uptake for D_uptake_y, and predicting the effect of
uptake being reduced to 15% (or kept as is if less than 15%) by linear extrapolation. We
assume that there is little benefit of app uptake below 15%. A quadratic regression with
intercept at 0 provides very similar findings (not shown). Cases averted are multiplied by the
crude case fatality rate to predict deaths averted.
References
Abueg, Matthew, Robert Hinch, Neo Wu, Luyang Liu, William J. M. Probert, Austin Wu, Paul
Eastham, et al. 2020. “Modeling the Combined Effect of Digital Exposure Notification and
Non-Pharmaceutical Interventions on the COVID-19 Epidemic in Washington State.”
bioRxiv. medRxiv. https://doi.org/10.1101/2020.08.29.20184135.
Brodersen, Kay H., Fabian Gallusser, Jim Koehler, Nicolas Remy, and Steven L. Scott. 2015.
“Inferring Causal Impact Using Bayesian Structural Time-Series Models.” The Annals of
Applied Statistics 9 (1): 247–74.
Cencetti, G., G. Santin, A. Longa, E. Pigani, A. Barrat, C. Cattuto, S. Lehmann, M. Salathé, and
B. Lepri. 2020. “Digital Proximity Tracing in the COVID-19 Pandemic on Empirical Contact
Networks.” bioRxiv. medRxiv. https://doi.org/10.1101/2020.05.29.20115915.
Davies, Nicholas G., Rosanna C. Barnard, Christopher I. Jarvis, Adam J. Kucharski, James
Munday, Carl A. B. Pearson, Timothy W. Russell, et al. 2020. “Estimated Transmissibility
and Severity of Novel SARS-CoV-2 Variant of Concern 202012/01 in England.” bioRxiv.
medRxiv. https://doi.org/10.1101/2020.12.24.20248822.
Endo, Akira, Centre for the Mathematical Modelling of Infectious Diseases COVID-19 Working
Group, Quentin J. Leclerc, Gwenan M. Knight, Graham F. Medley, Katherine E. Atkins,
Sebastian Funk, and Adam J. Kucharski. 2020. “Implication of Backward Contact Tracing in
the Presence of Overdispersed Transmission in COVID-19 Outbreaks.” Wellcome Open
Research 5 (October): 239.
Fancourt, D., F. Bu, H. Wan Mak, and A. Steptoe. 2020. “Covid-19 Social Study.” Results
Release 28.
Ferretti, Luca, A. Ledda, C. Wymant, L. Zhao, V. Ledda, L. Abeler-Dorner, and Others. 2020.
“The Timing of COVID-19 Transmission.” MedRxiv, Publisher: Cold Spring Harbor
Laboratory Press. https://www.medrxiv.org/content/10.1101/2020.09.04.20188516v2.
Ferretti, Luca, Chris Wymant, Michelle Kendall, Lele Zhao, Anel Nurtay, Lucie Abeler-Dörner,
Michael Parker, David Bonsall, and Christophe Fraser. 2020. “Quantifying SARS-CoV-2Transmission Suggests Epidemic Control with Digital Contact Tracing.” Science 368 (6491).
https://doi.org/10.1126/science.abb6936.
Fetzer, Thiemo, and Thomas Graeber. 2020. “Does Contact Tracing Work? Quasi-Experimental
Evidence from an Excel Error in England.” bioRxiv. medRxiv.
https://doi.org/10.1101/2020.12.10.20247080.
Flaxman, Seth, Swapnil Mishra, Axel Gandy, H. Juliette T. Unwin, Thomas A. Mellan, Helen
Coupland, Charles Whittaker, et al. 2020. “Estimating the Effects of Non-Pharmaceutical
Interventions on COVID-19 in Europe.” Nature 584 (7820): 257–61.
Galanti, Marta, Sen Pei, Teresa K. Yamana, Frederick J. Angulo, Apostolos Charos, David L.
Swerdlow, and Jeffrey Shaman. 2020. “The Importance of Continued Non-Pharmaceutical
Interventions during the Upcoming SARS-COV-2 Vaccination Campaign.” bioRxiv.
medRxiv. https://doi.org/10.1101/2020.12.23.20248784.
Google/Apple. 2020. “Exposure Notifications: Helping Fight COVID-19 - Google.”
https://www.google.com/intl/en_us/covid19/exposurenotifications/.
Hernán, Miguel A., and James M. Robins. 2016. “Using Big Data to Emulate a Target Trial
When a Randomized Trial Is Not Available.” American Journal of Epidemiology 183 (8):
758–64.
Hinch R and Probert WJM, Anel Nurtay, Michelle Kendall, Chris Wymant, Matthew Hall, Katrina
Lythgoe, Ana Bulas Cruz, et al. 2020. “OpenABM-Covid19 - an Agent-Based Model for
Non-Pharmaceutical Interventions against COVID-19 Including Contact Tracing.” medRxiv.
https://doi.org/10.1101/2020.09.16.20195925.
Hinch, Robert, W. Probert, A. Nurtay, M. Kendall, C. Wymant, M. Hall, K. Lythgoe, et al. 2020.
“Effective Configurations of a Digital Contact Tracing App: A Report to NHSX.”
https://github.com/BDI-pathogens/covid-19_instant_tracing/blob/master/Report%20-%20Eff
ective%20Configurations%20of%20a%20Digital%20Contact%20Tracing%20App.pdf.
Koh, Wee Chian, Lin Naing, Liling Chaw, Muhammad Ali Rosledzana, Mohammad Fathi
Alikhan, Sirajul Adli Jamaludin, Faezah Amin, et al. 2020. “What Do We Know about
SARS-CoV-2 Transmission? A Systematic Review and Meta-Analysis of the Secondary
Attack Rate and Associated Risk Factors.” PloS One 15 (10): e0240205.
Kretzschmar, Mirjam E., Ganna Rozhnova, Martin C. J. Bootsma, Michiel van Boven, Janneke
H. H. M. van de Wijgert, and Marc J. M. Bonten. 2020. “Impact of Delays on Effectiveness
of Contact Tracing Strategies for COVID-19: A Modelling Study.” The Lancet. Public Health
5 (8): e452–59.
Lambert, Amaury. 2020. “A Mathematically Rigorous Assessment of the Efficiency of
Quarantining and Contact Tracing in Curbing the COVID-19 Epidemic.” bioRxiv. medRxiv.
https://doi.org/10.1101/2020.05.04.20091009.
Lee, Lennard Y. W., Stefan Rozmanowski, Matthew Pang, Andre Charlett, Charlotte Anderson,
Gareth J. Hughes, Matthew Barnard, et al. 2021. “An Observational Study of SARS-CoV-2
Infectivity by Viral Load and Demographic Factors and the Utility Lateral Flow Devices to
Prevent Transmission.” NSMS Oxford.
http://modmedmicro.nsms.ox.ac.uk/wp-content/uploads/2021/01/infectivity_manuscript_202
10119_merged.pdf.
Lovett, Tom, Mark Briers, Marcos Charalambides, Radka Jersakova, James Lomax, and Chris
Holmes. 2020. “Inferring Proximity from Bluetooth Low Energy RSSI with Unscented
Kalman Smoothers.” arXiv [eess.SP]. arXiv. http://arxiv.org/abs/2007.05057.
Lunz, Davin, Gregory Batt, and Jakob Ruess. 2020. “To Quarantine, or Not to Quarantine: A
Theoretical Framework for Disease Control via Contact Tracing.” Epidemics 34
(December): 100428.
Moore, Sam, Edward M. Hill, Mike J. Tildesley, Louise Dyson, and Matt J. Keeling. 2021.
“Vaccination and Non-Pharmaceutical Interventions: When Can the UK Relax about
COVID-19?” bioRxiv. medRxiv. https://doi.org/10.1101/2020.12.27.20248896.Pellis, Lorenzo, Neil M. Ferguson, and Christophe Fraser. 2008. “The Relationship between
Real-Time and Discrete-Generation Models of Epidemic Spread.” Mathematical
Biosciences 216 (1): 63–70.
Public Health England. 2020a. “Investigation of Novel SARS-CoV-2 Variant - Variant of Concern
202012/01 - TC2.” Technical briefing 2.
https://assets.publishing.service.gov.uk/government/uploads/system/uploads/attachment_d
ata/file/949639/Technical_Briefing_VOC202012-2_Briefing_2_FINAL.pdf.
———. 2020b. “Investigation of Novel SARS-CoV-2 Variant - Variant of Concern 202012/01 -
TC3.” Technical briefing 3.
https://assets.publishing.service.gov.uk/government/uploads/system/uploads/attachment_d
ata/file/950823/Variant_of_Concern_VOC_202012_01_Technical_Briefing_3_-_England.pd
f.
Riley, Steven, Caroline E. Walters, Haowei Wang, Oliver Eales, Kylie E. C. Ainslie, Christina
Atchinson, Claudio Fronterre, et al. 2020. “REACT-1 Round 7 Updated Report: Regional
Heterogeneity in Changes in Prevalence of SARS-CoV-2 Infection during the Second
National COVID-19 Lockdown in England.” bioRxiv. medRxiv.
https://doi.org/10.1101/2020.12.15.20248244.
Rodríguez, Pablo, Santiago Graña, Eva Elisa Alvarez-León, Manuela Battaglini, Francisco
Javier Darias, Miguel A. Hernán, Raquel López, et al. 2021. “A Population-Based
Controlled Experiment Assessing the Epidemiological Impact of Digital Contact Tracing.”
Nature Communications 12 (1): 587.
Salathé, Marcel, Christian Althaus, Nanina Anderegg, Daniele Antonioli, Tala Ballouz, Edouard
Bugnon, Srdjan Čapkun, et al. 2020. “Early Evidence of Effectiveness of Digital Contact
Tracing for SARS-CoV-2 in Switzerland.” Swiss Medical Weekly 150 (December): w20457.
Smith, Louise E., Henry W. W. Potts, Richard Amlot, Nicola T. Fear, Susan Michie, and James
Rubin. 2020. “Adherence to the Test, Trace and Isolate System: Results from a Time
Series of 21 Nationally Representative Surveys in the UK (the COVID-19 Rapid Survey of
Adherence to Interventions and Responses [CORSAIR] Study).” medRxiv.
https://doi.org/10.1101/2020.09.15.20191957.
Steel, Kara, and Hannah Donnarumma. 2020. “Coronavirus (COVID-19) Infection Survey, UK: 8
January 2021.” ONS.
https://www.ons.gov.uk/peoplepopulationandcommunity/healthandsocialcare/conditionsand
diseases/bulletins/coronaviruscovid19infectionsurveypilot/8january2021.
Troncoso, Carmela, Mathias Payer, Jean-Pierre Hubaux, Marcel Salathé, James Larus,
Edouard Bugnion, Wouter Lueks, et al. 2020. “Decentralized Privacy-Preserving Proximity
Tracing.” arXiv [cs.CR]. arXiv. http://arxiv.org/abs/2005.12273.
Vöhringer, Harald, Matthew Sinnott, Roberto Amato, Inigo Martincorena, Dominic Kwiatkowski,
Jeffrey C. Barrett, and Moritz Gerstung. 2020. “Lineage-Specific Growth of SARS-CoV-2
B.1.1.7 during the English National Lockdown.”
https://virological.org/t/lineage-specific-growth-of-sars-cov-2-b-1-1-7-during-the-english-nati
onal-lockdown/575.
Volz, Erik, Swapnil Mishra, Meera Chand, Jeffrey C. Barrett, Robert Johnson, Lily Geidelberg,
Wes R. Hinsley, et al. 2021. “Transmission of SARS-CoV-2 Lineage B.1.1.7 in England:
Insights from Linking Epidemiological and Genetic Data.” bioRxiv. medRxiv.
https://doi.org/10.1101/2020.12.30.20249034.
Acknowledgements
We thank Richard Hayes, Moritz Kraemer, Samir Bhatt, Swapnil Mishra, Jamie Scott, Seth
Flaxman, Axel Gandy, Chris Jewell and Will Probert for helpful comments.Funding. This work was funded by a Li Ka Shing Foundation award to CF, and by research grant funding from the UK Department of Health and Social Care (DHSC) to MB, CH and CF. Role of the funders. The funders played no role in the design and conduct of the analysis. DHSC runs the app, and manages the secure data environment where the analyses conducted here were performed. DHSC led dissemination of the findings in the UK.
You can also read