Priorities and actions for a better city - City of Vancouver
←
→
Page content transcription
If your browser does not render page correctly, please read the page content below
2018-2022
BUDGET OUTLOOK
Priorities and actions for a better city
Among the world’s most livable cities, Vancouver is ranked                                                                           2018 priorities
third based on 30 factors across five areas: infrastructure,
education, health care, environment and stability (Source:                                                                           • Invest in renewing existing,
The Economist). Our greatest challenge in planning and                                                                                 and adding new, public
budgeting for the future is to make the best use of our                                                                                facilities and infrastructure.
resources to maintain basic services while responding to the
expanding needs of our growing population.                                                                                           • Manage the challenges
                                                                                                                                       of rapid growth and
Each year, we refresh our five-year plan and set our annual                                                                            affordability.
budget, taking into consideration any new developments or
challenges that have emerged as a result of changes in our                                                                           • Focus on equity and
environment, whether they be economic, physical or social.                                                                             creating a resilient, healthy
                                                                                                                                       and green community.
We continue to move forward with planned initiatives that
support our various strategies designed to improve services
and amenities for all residents, while at the same time
responding in real-time to serious issues and challenges
such as the opioid crisis and the significant affordability                                                                               How to get involved
issues in the City.
                                                                                                                                   Your input on the 2018 Budget will
                                                                                                                                   influence decisions about how your
                                                                                                                                   tax dollars are spent.

                                                                                                                                   • Online survey via Talk Vancouver
Contents                                                                                                                             from September 27 to October 13
Our priorities in detail................................................................................................pg 2       • Public meetings October 9, 18
Fiscal responsibility .................................................................................................. pg 4        and 19 (various locations)
Economic context....................................................................................................... pg 4
Public engagement ....................................................................................................pg 5
                                                                                                                                   • Public Dialogue session at City
                                                                                                                                     Hall on December 1, 4:30 - 7:30 pm
Highlights of City services...................................................................................... pg 6
                                                                                                                                     Main Floor Town Hall Room 110
Balancing affordability and services...................................................................pg 7
2017 Budget overview ............................................................................................. pg 8            For more details and information
Looking ahead ............................................................................................................. pg 9   about other opportunities to provide
How to share your input......................................................................................... pg 15             feedback, please see page 15 or visit
                                                                                                                                   vancouver.ca/budget

                                                                                                                                         2018 – 2022 Budget Outook   Pg. 1
Our priorities
Invest in renewing existing, and adding                        Manage the challenges of rapid growth
new, public facilities and infrastructure                      and affordability
Renewing and adding public facilities and infrastructure       Vancouver is rapidly growing. This makes our economy
will ensure that the health, safety and quality of life        one of the strongest and fastest growing in Canada, but
enjoyed by Vancouver residents and businesses is               it also puts significant strain on existing systems and
sustained and improved.                                        creates affordability challenges.

• The City of Vancouver provides services that are             • Housing affordability is a significant challenge for the
  essential for daily living, such as: high-quality drinking     City of Vancouver. The 10-year Housing Vancouver
  water, waste water and solid waste management, streets,        Strategy introduced in 2017 aims to improve housing
  bridges, and emergency services.                               affordability by creating the right types of homes to
                                                                 meet the needs and incomes of the people who live and
• Vancouver residents and visitors expect public streets         work in Vancouver.
  and buildings that are consistent with a modern and
  forward-looking city. Our investments in public facilities   • Lower income and homeless individuals in Vancouver
  such as libraries, recreation centres and parks add to         are the hardest hit by the housing crisis and we are
  our quality of life and to our international reputation.       prioritizing actions that address the urgency of this
  Aging infrastructure must also be maintained so that it        crisis. A number of actions to increase the supply of
  continues to perform well, meets safety standards, and         appropriate housing for these people have been put in
  continues to meet the expanding needs of citizens and          place over the past year, and more are planned including:
  businesses.                                                    an additional 600 temporary modular homes; new social
                                                                 housing buildings; and more temporary shelter spaces.

                                                               • Enabling greater supply of affordable housing is an
A key element is the planned                                     important element in our housing strategy. We will work
extension of the Millennium Line                                 with the private and non-profit sectors to expedite the
SkyTrain along the Broadway Corridor.                            production of affordable housing.

                                                               • This past year was another strong one for residential and
                                                                 commercial building development in Vancouver. The City
• We are working with TransLink to support a shared              looks at the impacts of new building developments and
  10-Year Vision for improved roads, transit service,            collects fees and contributions to help fund amenities
  and walking and cycling infrastructure. This includes          and infrastructure. We must also continue to invest
  increases in the number of SkyTrain cars, enhanced             in our staff and systems in areas such as planning
  bus service, and more. A key element is the planned            and permitting to ensure this rapid growth can be
  extension of the Millennium Line SkyTrain along the            accommodated.
  Broadway Corridor. This line will serve the second-
  largest employment centre in the province, and will allow
  more people to travel with dependable trip times along        Lower income and homeless individuals in
  the corridor.                                                 Vancouver are the hardest hit by the housing
• Arts and culture are critical elements of a high              crisis and we are prioritizing actions that
  functioning and healthy city and we will continue to          address the urgency of this crisis.
  elevate and emphasize this community in Vancouver.
  With this in mind, we’ve made additional investments in
  public art, increased grant programs that support non-       • Vancouver has begun to transition from the traditional
  profit organizations working in this space, and continue       model of business attraction to one that engages global
  to provide robust support programs for arts and culture        demand, talent, and capital. Sectors we are targeting
  activities in our city.                                        to help attract global talent and investments include:
                                                                 technology, digital and interactive entertainment, the
                                                                 green economy, and Asia Pacific trade. Beyond their
                                                                 rapid growth and ever-growing potential, these sectors
                                                                 are the new foundation of the knowledge economy.

                                                                                        2018 – 2022 Budget Outook    Pg. 2
Focus on equity and creating a resilient, • The Greenest City 2020 Action Plan launched in 2011 set
the foundation for Vancouver to lead the fight against
healthy and green community climate change, here and around the world. The 10 goal
areas in the plan demonstrate how seriously we take the
Vulnerable communities are at highest risk during an concept of environmental sustainability: clean energy,
emergency and often face the greatest health and quality green buildings, green transportation, water quality,
of life challenges. By pursuing the Healthy City and local food systems, zero waste, and more. Some of our
Greenest City Strategies, issues of poverty and resilience targets, such as those in the green transportation goal
can be addressed and our residents and businesses can area, have already been met, and in other areas we have
be more prepared for any challenges we may face. more work to do.
• The capacity to anticipate, pre-empt, and resolve • To build strong communities, the City offers a range
disruptive challenges to its vital functions has become of assistance for non-profit social service groups and
a high priority for our city. This year, we launched neighbourhood organizations in the form of grants and
a partnership with 100 Resilient Cities (led by the in-kind support. There are grants available for childcare
Rockefeller Foundation). With support and best centres, for providing services to at-risk communities,
practices from 100RC we will be better positioned to support for small-scale renovations to facilities, and
tackle our most pressing challenges such as housing other needs.
affordability, emergency preparedness, climate change,
and social connectedness.
As the number of overdoses and
deaths have continued to increase,
we have seen impacts across the City,
particularly among first responders.
• This past year a major area of focus across the City
has been the opioid crisis. As the number of overdoses
and deaths have continued to increase, we have
seen impacts across all of our facilities and services,
particularly among first responders in Vancouver
Fire and Rescue Services and the Vancouver Police
Department. The City has taken action on a number of
fronts, including: facilitation of expanded health services
in the Downtown East Side; naloxone emergency
overdose treatment training; public education events;
community-based support for at-risk residents; and
advocacy with senior governments for additional
measures to support individuals suffering from addiction
and to mitigate the extraordinary toll of illicit opioid use.
• The City of Vancouver was designated a City of
Reconciliation in 2014. In 2017, to mark Canada 150+, the
City of Vancouver hosted three signature events along
with a number of other events throughout the year: the
Gathering of Canoes; a week-long arts and performance
festival called The Drum is Calling; and the Walk for
Reconciliation.
2018 – 2022 Budget Outook Pg. 3Fiscal responsibility Economic context
The City of Vancouver is committed to supporting A resilient economy fosters dynamic businesses and
Vancouver’s residents and businesses and to building a sustainable employment, and helps to attract and retain
vibrant and livable city in a financially sustainable and professionals, families and individuals to live and work in
resilient way. Over the last few years, the City has evolved Vancouver. When developing the City’s long-term financial
our budgeting process to integrate mid- and long-term plan, the City considers global, regional and local economic
service, financial and capital planning. This transition, factors. Understanding these constantly changing factors
coupled with the introduction of performance metrics, allows the City to manage near-term risks and uncertainties
helps guide strategic investment in the services, amenities while also planning for long-term financial resilience and
and infrastructure needed to support a growing city. sustainability.
The global economy continues to build momentum in
The City’s strong financial management 2017, with world GDP growth forecasted to be 3.4-3.5%.
has been acknowledged by credit rating Given the uncertainty in policy direction of the Trump
administration, the US economy is anticipated to grow at
agencies with the highest credit rating 2.2%. The Euro area economy continues to grow at 2%,
of AAA. while the pending withdrawal from the EU is taking a toll
on the UK economy. China’s economic growth appears to
be decelerating after a period of stimulus-induced strength,
By legislation, the City cannot run a deficit or borrow to but is forecasted to meet the 6.5% target as the Chinese
fund its operating budget. The City adheres to strong government is expected to continue its fiscal injections to
fiscal discipline to ensure that: we live within our means keep the economy’s growth trajectory on track.
and do not burden future generations with unsustainable
obligations; services and programs are delivered in an The Canadian economy is poised to grow by 2.8% in
affordable and cost-effective way; and public amenities 2017, due mainly to the recovery in commodity prices,
and infrastructure are maintained in an appropriate state of fiscal stimulus and accommodative monetary policy, with
repair. When developing the City’s long-term financial plan, moderation in 2018 to 1.9%. A disorderly correction of
a key consideration is to ensure that capital investments housing markets and the renegotiation of NAFTA remain
will not unduly burden the operating budget through debt the key risks to the outlook and could have far-reaching
servicing, operating and asset life-cycle costs. This strong implications. BC is anticipated to top the provinces in
financial management has been acknowledged by credit economic growth again this year at 3%, with moderation in
rating agencies – both Moody’s and Standard & Poor’s – 2018 to 1.8% owing to downward pressure on the housing
which have awarded the City with the highest credit rating market in light of rising interest rates and the unresolved
of AAA. softwood lumber trade conflict with the US. Inflation is
anticipated to be around 2% for 2017 and 2018.
With the recent change in the Provincial government, as
well as the multitude of Federal infrastructure programs Projected Real GDP Growth 2018–2021
under way, the City is well positioned to leverage strategic
partnership and funding opportunities on key Council 3.0%
priorities such as rapid transit, affordable housing,
childcare, arts and culture, climate change adaptation and 2.5%
2.3%
2.4% 2.4% 2.4% 2.4% 2.4%
economic development. 2.2%
2.0%
2.0% 1.9%
1.7% 1.8% 1.8% 1.8%
Tax-Supported Debt Servicing as % of
Operating Expenditures 1.5%
12%
1.0%
UPPER LIMIT 10.0%
10%
% of Operating Expenditures
0.5%
8%
0.0%
6%
Qu
Mo
Ot
Ha
Ha
Vi
W
Re
To
Ed
Sa
Va
Ca
cto
inn
s
taw
ro
gin
lga
nc
mo
mi
lifa
e
LOWER LIMIT 6.0%
nt
ka
be
nt
ou
rea
lto
ipe
ria
x
ry
a
to
nt
a-G
cC
o
4%
ve
n
on
on
l
g
ati
ity
r
ne
au
2%
0%
20
20
20
20
20
20
20
20
20
20
20
20
20
20
20
20
20
20
20
21
22
23
24
25
26
27
10
11
12
13
14
15
16
17
18
19
Tax-supported debt = general debt + 50% sewer debt
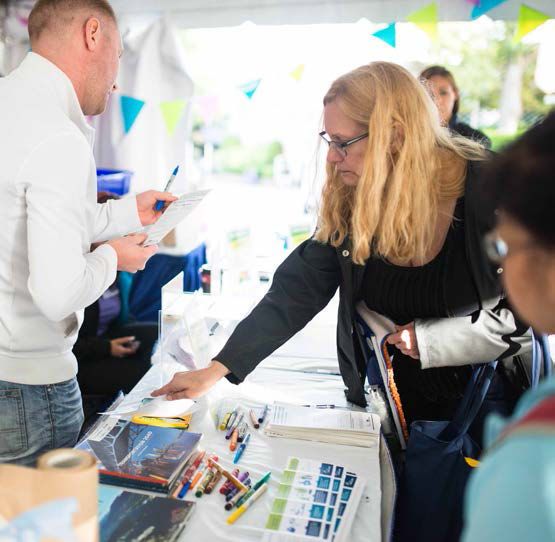
2018 – 2022 Budget Outook Pg. 4Public engagement
What we heard last year • The strongest satisfaction ratings were for provision
The City of Vancouver’s annual budget process offers an of basic services (sewer, water, drainage), garbage
excellent opportunity for public dialogue on city-wide collection, composting and recycling, fire prevention
priorities. We check in with residents and businesses and responding to medical calls.
and develop a picture of what they see as important and
how they would make the trade-offs between investing Willing to Pay Tax Increase
resources to improve or expand services, while keeping
taxes and fees affordable. Every year, the City’s budget 71%
68% Resident property owners
decisions are strengthened through the input of those
who benefit from and are affected by these choices. Public 52% Business property owners
47%
input provides valuable context for budget decisions and
helps staff track public priorities from year to year. 26% 22%
17% 16%
Our engagement process in support of the 2017 Budget,
as in previous years, was robust. Thousands of citizens
participated in surveys, meetings and neighborhood face- 1% increase 2% increase 3% increase 4% increase
to-face activities.
• The majority of resident property owners and business
The top priorities were fairly consistent across groups of property owners are willing to pay a 1.0% tax increase.
respondents. Housing, cost of living and infrastructure/ Overall, one-half are also willing to pay a 2.0% tax
transportation are the key issues on the minds of increase (though resident owners are somewhat more
Vancouver residents and business owners. willing than businesses).
Top of mind issues Support for User Fees Increases
Residents (Online) Businesses (Online) Residents Businesses
Housing/Accommodations (56%) Cost of Living (47%)
70% 18% Very 16% 62%
Cost of Living (52%) Housing/Accommodations (44%) Willing willing Willing
Infrastructure/Transportation (37%) Infrastructure/Transportation (38%) Somewhat
52% 46%
willing
Social Issues (34%) Development (29%)
Development (30%) Social Issues (22%) Not very
20% 24%
willing
Not at all
Other findings 10%
willing
14%
100%
90%
Satisfied with City Services When prompted, respondents said they were personally
80%
willing to pay more in user fees for services they or their
business use (66%).
70%
60% The public is open to using a variety of tools to balance
50% the City’s budget. They were more likely to support the
40% following measures:
2016 SURVEY
2016 SURVEY
2016 SURVEY
2015 SURVEY
2015 SURVEY
2015 SURVEY
2017 SURVEY
2017 SURVEY
2017 SURVEY
30%
• Introduce new user fees for some City services that
20%
currently have no fees (46%);
10%
0% • Increase user fees for City services that currently have
Residents Businesses 3-1-1 Callers fees (41%); and/or
(Online) (Online)
• Reduce level of staff/personnel providing services (38%).
• The average levels of satisfaction among residents
have been stable over the last several years, at or The use of online options for services and engagement,
above 70% of those surveyed. Among businesses, as well as green techniques for managing green spaces,
satisfaction has also been stable, with a small increase received the most support for finding efficiencies in
in the percentage who say they are satisfied (‘very’ or service provision.
‘somewhat’ satisfied) with City services to 54%, from
50% in previous years.
2018 – 2022 Budget Outook Pg. 5Highlights of City services delivered last year
3,925 City-facilitated
childcare spaces
(cumulative)
3,609 people received
1,865 secured
1,484 km 33,088 market rental
homelessness services
water mains tonnes garbage units committed 480 social housing
collected* units committed
2,117 km
sewer mains
49,101
tonnes compostables
collected*
9,900 on-street
6.5M 7,797 metered spaces
74% landfill gas collected in-person library visits street use
permits 311 km
2,513 tonnes collected 7M online library visits (film, events, bike network
(litter cans) food trucks,
2.4M items available patios)
49,388 business licences issued 1,306 729,630
hectares park space attendees at civic theatres
104,156 8,506
building and development, 21,541 trees planted 830,633
trades inspections building and
square feet arts
combined permit
applications 2.7M swim and culture space
50 rezoning participants
$12M grants to
applications received
cultural organizations
51,532 crimes reported; 852,868 calls made to 3-1-1
on average, 1 crime every 27,698 VanConnect service 571 City-owned buildings
10 minutes and 14 seconds requests
1,797 fires with damage 21% reduction in GHG
176 public engagement
13,325 fire safety inspections projects emissions from City-owned
44,389 medical incidents buildings (since 2007)
6,468 residents trained in 503 Freedom of Information
2017 credit rating Aaa/AAA
emergency preparedness requests received
2016 data used unless otherwise noted. 2018 – 2022 Budget Outook Pg. 6
* City provides service to single-family residential onlyBalancing affordability The City does not generate higher
with quality of services property tax revenues as a result of
and programs rising property values.
How property assessments and base provided by BC Assessment. Under this approach,
property tax work property tax increases are driven by the City’s revenue
requirements, and tax rates are adjusted annually to reflect
The City plays a leading role in enabling a thriving business changing property values.
environment and building a world-class, sustainable
community for its residents. Vancouver is consistently While the Council-directed property tax increase applies
ranked as one of the most livable cities in the world and, in to the overall tax levy, the extent of change in an individual
2016, the global accounting firm KPMG ranked the city as property’s tax year over year is determined primarily by
the second-most tax competitive in the world. how that property’s assessed value has changed relative
to the average change within its property class. Properties
The City continues to strive to balance the affordability with a higher increase in value relative to the class average
and competitiveness of property taxes, utility fees and change could experience a much higher increase in
user fees, while sustaining the breadth and quality of property tax beyond the Council-directed increase, while
services for businesses and residents. Over the past several properties with a lower increase in value could experience
years, Vancouver has consistently had one of the lowest no change or a reduction in property tax.
average property tax increases among Metro Vancouver
municipalities. Even when combining municipal taxes with
annual utility fee increases, Vancouver is in the mid-range Cost to deliver services
among the municipalities in Metro Vancouver.
Approximately half of the property tax paid by Vancouver
taxpayers goes towards funding City services while the
remaining half goes to provincial and regional taxing
authorities to fund regional services, schools, transit, and
property assessment services. Vancouver City Council has
no control over how much the other taxing authorities
charge or how they distribute those levies across the $1.05M $1.04M
region. As property values in Vancouver are generally to hire and train 10 to operate the Marine
higher than those in other Metro Vancouver municipalities, new police officers fire response program
the amount of provincial and regional property taxes paid for one year
by a household in Vancouver are typically higher than the
rest of the region.
$6.3M
to grow and maintain
Approximately half of the property Vancouver’s urban forest
tax paid by Vancouver taxpayers goes
towards funding City services while the
$1.3M
to operate a swimming
other half goes to provincial and regional pool for one year
taxing authorities to fund regional
services, schools, transit, and property
assessment services. $350,000
to purchase one Compressed
Natural Gas Refuse Truck
It is important to note that the City does not generate
higher property tax revenue as a result of rising property $6.05M
values. Property values are determined by BC Assessment; to fuel city vehicles
for one year
Vancouver City Council has no jurisdiction over the
determination of property values. To establish the City’s
tax rates, Vancouver City Council first determines the total
property tax levy that is required to support the budget,
$275,000
to install Pedestrian/Cyclist
and then divides the property tax levy by the assessment Actuated Signal
2018 – 2022 Budget Outook Pg. 72017 Budget overview
Operating budget revenues and expenditures (water, sewer, solid waste, neighbourhood
energy) total 28%. Together, these services account
expenditures for 2017: $1.322 billion for more than half of the City’s operating expenditures
Property tax and utility fees for water, sewer and solid budget. These costs have grown at a higher rate than
waste make up 76% of the revenue in the 2017 Budget. other areas, reflecting the operating cost impact of
These revenue sources are highly predictable. Revenues substantial capital investments in recent years to replace
from property development-related fees and permits are aging regional infrastructure and above-inflation wage
cyclical, but account for only 5% of the City’s revenue growth in the public safety sector across the region.
base. Community-related services — such as parks and
recreation, library, community services and planning —
In 2017, Vancouver’s property tax revenue increase of comprise 22% of the operating budget.
5.1% (including the Council-directed tax increase of 3.87%
and additional taxes generated from new development Staffing costs represent the largest component of the
of 1.23%) provided funding for cost increases in existing City’s operating budget, at more than 57%. While utilities
services as well as new investments in key priorities represent 22% of operating budget, more than 50% of
such as: equity, safety and livability; housing needs those costs are passed on to the City directly by Metro
and affordability; arts and culture; and financial health Vancouver. A further 9% of the operating budget goes
and operational effectiveness. The City of Vancouver’s to interest and debt payments for capital investments,
combined 2017 property tax and utility fees for a median as well as transfers to other funds and allocations. This
single-family home was in the mid-range among the includes transfers to the Capital Fund which, along with
municipalities that comprise Metro Vancouver. development revenues and other external contributions,
funds the City’s capital investment. The remaining 23%
Public safety accounts for 31% of the City’s operating of the operating budget goes to other non-salary costs,
budget while Engineering public works and utilities including facilities costs, grant payments and equipment.
2017 OPERATING REVENUES
($1,322.2 MILLION)
2017 Operating Revenues $1,322.2 Million 2017 Operating Expenditures $1,322.2 Million
11
2 2 4%
3 7%
5% 22%
8%
5%
1% 1% 19%
5% 2% 31%
4%
22% 9%
57% 5%
28%
19% 9%
22%
6%
PUBLIC SAFETY
57% | Property Tax 22% | Police
19% | Utility Fees 9% | Fire
5% | Program Fees ENGINEERING & UTILITIES
5% | Licence & Development Fees 22% | Utilities
5% | Parking 6% | Engineering Public Works
3% | Cost Recoveries, Grants COMMUNITY-RELATED SERVICES
& Donations
9% | Parks
2% | Rental, Lease & Other
5% | Community Services
2% | Revenue Sharing
4% | Library
1% | Bylaw Fines
2% | Development, Buildings & Licensing
1% | Investment Income
1% | Planning, Urban Design & Sustainability
1% | Other
CORPORATE SUPPORT
8% | Debt & Capital (Non-Utility)
7% | Corporate Support
4% | Contingencies & Transfers
2018 – 2022 Budget Outook Pg. 8Capital Budget
The City owns more than $20 billion of capital
Looking ahead: 2018-2022
assets (based on replacement value, excluding land) operating and capital
encompassing parks and recreation, community
facilities, affordable housing, public safety, roadways, financial plan
walkways, bikeways, and underground water and sewer
infrastructure. The need to renew, upgrade and expand 2018 Operating Budget
public amenities and infrastructure to support residents Looking toward 2018, the projected growth in revenues
and businesses is significant and growing. Infrastructure is consistent with prior years with the exception of
renewal is an investment in the future of our city and an decreased traffic fine revenue from the Provincial revenue
important factor in achieving good value for money by sharing program (which reflects the province-wide trend)
maintaining and, where possible, extending the operational and lower investment income, which is due to the current
lifespan of the assets. low interest rate environment. Wage increases are a key
factor in determining the City’s rate of budget growth.
Annual capital expenditure budget for 2017
The City’s annual capital expenditures budget for 2017 Costs rising faster than inflation
is $485 million. Utilities and public works account for Costs for maintaining existing staff levels and existing
the largest share of planned capital investments at services scope and levels are rising faster than inflation in a
about 27%, followed by transportation at 21%. Housing number of areas:
investments represent the next largest proportion at about
16%, followed by parks, open spaces and recreation at • Public safety collective agreements will increase in 2018
10%, equipment and technology at 9%, and community by 2.5%.
facilities, civic facilities and childcare accounting for about
16% of planned expenditures. • Regional utility charges passed on to the City by Metro
Vancouver are forecast to increase by 3% for water and
by 8.5%-12% for sewer annually from 2018-2022, driven
by major infrastructure investments.
• BC Hydro electricity rates are increasing by 3.5% in
2017 Capital Budget Expenditures $485.5 Million
2018, and an average of 3% for the next four years
based on BC Hydro’s 10-year plan.
1%
3%
6% • Increases in ongoing operating and life cycle costs
7% 27% arising from new and expanded amenities and
infrastructure.
9%
The outlook for 2018-2022 shows the potential for a
significant gap between expenditure growth and revenue
growth. This trend—common for all municipalities—will
10% need to be addressed through continued review of City
21% service levels, and innovation in how programs and
services are delivered, including: strategic partnerships;
16%
process improvements and business and technology
transformation; and new revenue sources to address the
costs of City growth.
27% | Utilities & Public Works ($130M)
21% | Transportation ($104M)
16% | Housing ($80M)
10% | Parks, Open Spaces &
Recreation ($47M)
9% | Equipment & Technology ($42M)
7% | Community Facilities ($29M)
6% | Civic Facilities ($29M)
3% | Childcare ($15M)
1% | Citywide ($7M)
2018 – 2022 Budget Outook Pg. 92017 Combined Municipal Property Tax and Utility Compounded Wage Increases
Fees for Median Single-Family Home ($)
25%
CITY OF LANGLEY 3,039
CITY OF PITT MEADOWS 3,172
20%
CITY OF MAPLE RIDGE 3,207
CITY OF PORT COQUITLAM 3,261
15%
TOWNSHIP OF LANGLEY 3,263
CORPORATION OF DELTA 3,289 10%
CITY OF VANCOUVER 3,486
CITY OF SURREY 3,686
5%
CITY OF BURNABY 3,702
CITY OF COQUITLAM 3,801 0%
AVERAGE 3,803
20
20
20
20
20
20
20
20
20
20
20
20
21
22
12
13
14
15
16
17
18
19
CITY OF NORTH VANCOUVER 3,806
CITY OF RICHMOND 4,038
DISTRICT OF NORTH VANCOUVER 4,151 CPI 8.0% CUPE 10.2% POLICE 16.6% FIRE 16.0%
(2017–2022 forecast)
CITY OF PORT MOODY 4,209
Compounded Annual Increase from 2012 to 2017
CITY OF NEW WESTMINSTER 4,357
CITY OF WHITE ROCK 4,458
DISTRICT OF WEST VANCOUVER 5,728
1,000 2,000 3,000 4,000 5,000 6,000
Other challenges
The increasing pressure for local governments to take on
Comparing median single-family homes, Vancouver tax and utility fees more and more services and responsibilities from senior
are mid-range in Metro Vancouver. levels of governments has increasingly hindered the City’s
ability to keep operating expenditure growth at the rate
Vancouver vs Metro Vancouver Five-Year Average of inflation. Examples of some of the challenges the City
Property Tax Increase (2013-2017) faces include:
5.00% • The opioid crisis – in 2017, Council approved $3.5 million
to respond to this urgent crisis.
4.00%
3.00% • Insufficient new housing supply that is affordable for
2.00%
low- to moderate-income individuals and families living
and working in Vancouver. In 2017, the City invested
1.00%
$80.1 million in capital and $4.5 million in operating
0.00% funds to support housing needs and affordability.
- P te R
-R
-N
-L
-P
-B
- S t Va
-N
-M
-V
-C
- D h Va
-A
- W ey T
-W
-L
-P
or
an
ur
ich
itt
an
ur
an
oq
ew
or
elt
ve
or
ap
• Deterioration of the Single Room Occupancy (SRO)
es
hi
t C ck
rey cou
gl
na
tM
t
g l e ge
co
ra
Me
a
mo
uit
le
W
oq
ge
b
uv
hotels and the aging social-housing stock is having a
Ri
lam
ad
oo
es
yC
nd
y
o
n
uit
d
er
tm
nc
ow
ow
dy
ity
cumulative impact on homelessness, street disorder
lam
ins
ou
s
ns
ve
ter
ve
hip
and related crisis-response costs at the municipal
r
rD
level. Recently, Federal and Provincial governments
ist
ric
have acknowledged a need for increased investment
t
Over the last five years, Vancouver has had one of the lowest average in affordable housing. In the current housing crisis,
property tax increases in the region. municipalities have carried many of the costs of
historical decreases in investments in social housing by
senior levels of government.
Collective agreements and other
challenges • Inadequate access to treatment for people with serious
mental health challenges and addictions puts pressure
Collective agreements on local services. There has been a 43% increase in
The City has negotiated collective agreements for the emergency room mental-health visits between 2009
majority of the unions as represented by Fire Fighters and 2013 and an increase in the number of emergency
Union, CUPE Local 15, CUPE Local 1004, IATSE and CUPE responses, including mental-health apprehensions.
Local 391 and arbitrated with Vancouver Police Union. The Vancouver Police Department provides significant
resources to respond to these emergencies, and there
Given the magnitude of public safety wages relative to is a need to ensure that appropriate treatments are
the other parts of the City, the recent trend of public available to those in need before an emergency occurs.
safety wage increases above inflation will continue to put
significant pressure on the City’s budget and property tax
rates.
2018 – 2022 Budget Outook Pg. 10• The BC government has announced that income • Existing rental stock is aging, requiring upgrades and
assistance rates will increase by $100 a month beginning refurbishment with potential displacement of long-term
in September 2017. Prior to that, income assistance rates tenants who are not able to afford new, market housing.
had been frozen for 10 years and have not increased
significantly in 20 years, despite substantial increases in • The decision by the RCMP and Provincial government
rents over this period. Even with the increase in income to limit the financial contribution for the cost of DNA
assistance rates, there is still risk of homelessness and analysis services resulted in costs downloaded to
a need for investment in support services to provide municipalities.
housing options to people facing increased rents.
• The availability of childcare spaces continues to be well
below the number needed to meet current demand.
Operating Budget 2018-2022 Outlook
Budget decisions will be based on a five-year financial plan to ensure Council priorities are addressed, to enable proactive
planning for revenues and business transformation opportunities, and to respond to emerging risks. The 2018 Budget is
the first year of the five-year financial outlook and identifies the main drivers of the City’s operating budget.
2018–2022 Operating Budget Preliminary Expense Pressures ($ in millions) 2018 2019 2020 2021 2022
External Agency Costs passed on to the City
Increased Metro Vancouver charges for Water and Sewer utility $8 $10 $9 $9 $9
Anticipated external party cost increases (including EComm) $1 $1 $1 $1 $1
Debt, Transfers and Capital Program Costs
Operating impacts of capital projects $3 $3 $3 $3 $3
Transfers and debt & pay-as-you-go financing for Water, Sewer, NEU & Solid Waste $7 $4 $5 $5 $5
Increased non-utility debt cost $2 $2 $1 $1 $1
Inflationary Cost Pressures
Inflationary costs (hydro, gas rates, rents & leases, insurance, grants) $2 $2 $2 $2 $2
Salary and Benefit Costs
Salary and benefit increases required by existing collective agreements (contractual
$20 $20 $20 $20 $20
increments and projected benefit cost increases)
Total Preliminary Expense Pressures $43 $42 $41 $41 $41
Expenses are projected to increase primarily due to:
• Increases in salaries and benefits, due to contractual • Estimated $1-2 million per year for cost increases
increases as per collective agreements. passed on from external agencies and senior levels
of government. In addition, indirect cost pressures
• Increases in regional utility charges passed on to the in the areas of housing, mental health and addiction,
City by Metro Vancouver, forecast to increase by 3% for childcare, and emergency medical response, formally
water and by 8.5%-12% for sewer annually from 2018- the responsibility of the Provincial and Federal
2022, driven by major infrastructure investments. governments, continue to add to the City’s budget
pressures.
• Increasing costs associated with the 2015-2018 Capital
Plan, reflecting increasing debt servicing costs, ongoing
operating and lifecycle costs of new amenities and
infrastructure, and use of pay-as-you-go capital for
water and sewer utilities.
2018 – 2022 Budget Outook Pg. 112018–2022 Operating Budget Projected Revenue Changes ($ in millions) 2018 2019 2020 2021 2022
Property Tax
Increase in property tax revenue (estimated at 2%) $14 $15 $16 $16 $17
New construction tax revenue $5 $5 $5 $5 $5
Utility fees
Increase in utility fee revenue (Water, Sewer, Solid Waste, NEU) $12 $11 $10 $10 $10
Program fees
Inflationary increases in program fees and development fees $3 $3 $3 $3 $3
Lower investment income - lower interest rate environment ($2)
Provincial traffic fine revenue sharing ($3)
Total Projected Revenue Changes $29 $34 $34 $34 $35
Operating revenues are projected to increase primarily Capital Budget 2018-2022 Outlook
due to:
The City’s capital program consists of a 10-year strategic
• Property tax to increase in line with inflation projected outlook, a four-year plan, and an annual budget plus four-
to be approximately 2% annually. year forecast (Five-Year Financial Plan) with quarterly
capital program status reports.
• Additional property tax revenues from new
development to increase by $5 million annually, The 2015-2018 Capital Plan (four-year plan) was approved
representing less than 1% of our annual property tax by City Council in October 2014 and included $1.085
base. billion of capital investments. As factors impacting capital
priorities change, the capital plan is adjusted as needed to
• Utility fees to increase by 5% annually on average for align with current priorities and budget challenges. With
the next five years, based on Metro Vancouver regional Council approved adjustments to July 25, 2017, funded
utility charge forecasts (subject to change when Metro primarily by development revenue and senior government
Vancouver rates for 2018 are finalized in October 2017). funding that was not included in the original plan, the
2015-2018 Capital Plan is now $1.337 billion. The Capital
• Program fee and development fee revenues to increase
Plan provides the framework for the 2018 Capital Budget,
in line with inflation. Fee increases identified through
the fourth and final year of the four-year Capital Plan.
fee reviews to be incremental.
Funding from the multi-year capital plan is allocated to
• Declining investment income in 2018 due to lower specific capital programs and projects through the annual
interest rate environment, offsetting some of the Capital Budget process.
revenue increases.
Capital investments vary from year to year depending on
• Lower provincial revenue sharing of traffic fines in 2018 funding availability, amenities and infrastructure needs,
due to declining ticket revenues and declining City asset condition and evolving priorities. The key objective
of Vancouver share in municipal allocation, offsetting of the 2015-2018 Capital Plan is to balance three areas:
some of the revenue increases. maintaining the City’s infrastructure and facilities in an
appropriate state of repair; optimizing the City’s network
• Additional revenue from the Empty Homes Tax is not of public amenities to best serve residents, businesses
known at this time, but is anticipated to cover the and people who visit and work here; and advancing
costs of implementation, with any additional revenue Council and community priorities within the City’s long-
available to fund affordable housing programs. term financial capacity. The Capital Plan is designed to be
flexible to accommodate evolving needs and priorities.
The final 2018 Budget will incorporate feedback from
public consultation with Vancouver residents and business Development contributions are essential to support public
owners. amenities and infrastructure for a growing city. The City
of Vancouver is also leveraging strategic partnership and
NOTE: The estimates contained in this report are preliminary and are based funding opportunities. In 2015 and 2016, the City was
on assumptions related to future events and rate changes that have been
successful with several applications to obtain modest
estimated based on the current economic outlook, recent expenditure
growth and revenue trends and available Metro Vancouver forecasts. These Federal and Provincial government funding toward the
assumptions will be refined and adjusted over the coming months to reflect City’s capital program (approximately 3% of the City’s
ongoing revenue trends, productivity improvements and service-delivery projected five-year capital expenditures), including
changes to bring the 2018 Budget into balance.
2018 – 2022 Budget Outook Pg. 12improvements to transportation infrastructure, childcare Key capital investments
and the Stanley Park Seawall. Further senior government
funding in 2017 is anticipated to enable key priorities such
Affordable housing, including replacement and expansion
as affordable housing, childcare, utility and transportation of Roddan Lodge in the Downtown Eastside, new affordable
projects. In 2018 and beyond, the City will continue to housing in Southeast False Creek Area 3B, and development
leverage strategic partnership and funding opportunities of affordable housing on City sites managed by the Vancouver
with the Provincial and Federal governments to advance Affordable Housing Agency.
key Council priorities in the areas of affordable housing,
Child care investments, including a number of childcare facilities
childcare, sewer separation, bridge infrastructure, recreation
in partnership with Vancouver School Board (construction for
facility renovations and upgrades, and park renewal. Lord Nelson Elementary and Sir Sandford Fleming Elementary
childcares, planning for Lord Tennyson Elementary School and
The City has a 2017 capital budget of $485 million, the David Lloyd George Elementary childcares), as well as planning
largest annual capital investment by the City since 2010. for new childcare facilities at City parkades in Gastown.
A number of major capital projects are advancing from
planning and design to construction or implementation, Community facilities, including planning for renewal of Marpole
and Britannia community centres, planning for a new outdoor
including social housing, several City/Vancouver
pool, and completion of the new Killarney Seniors Centre and
School Board partnership childcare facility projects, the
expansion of Central Library to levels 8 and 9 to replace formerly
construction of the Arbutus Greenway, and the replacement leased space with a vibrant public learning and gathering space.
of Fire Hall #5 co-located with new social housing.
Civic facilities, including completion of Fire Hall #5, incorporating
Capital investments in 2018 are expected to be consistent a social housing component, and start of construction for the
with 2017 levels, much higher than previous years, reflecting replacement of Fire Hall #17, with completion in late 2019.
the continuation or completion of major construction
Parks, open spaces, and recreation, including completion of the
phases in 2018 for several multi-year capital projects. The Parks and Recreation Master Plan, park designs for Northeast
level of annual capital investment for 2019 through 2022 is False Creek, playground renewals, park renewals in Renfrew
forecast to stabilize somewhat at levels comparable to 2016. Community Park and Ravine Park, and China Creek North Park, a
The forecasts for 2019 through 2022 are early estimates new downtown park at Smithe and Richards, and completion of
given that the 2019-2022 Capital Plan will be presented to major repairs to the Stanley Park Seawall.
Council for consideration and approval in mid-2018. Over
Transportation, including detailed design and costing for
the next few months, staff will review the projects schedule development of the Arbutus Greenway, planning and costing for
across the five-year outlook to further refine the 2018 the next phase of the Georgia and Dunsmuir viaducts removal
Budget based on Council and community priorities, as well and Northeast False Creek redevelopment, and continued
as capacity to deliver. investments in bikeways and greenways.
New capital investments in the 2018 Capital Budget Utilities, including continuation of construction for the multi-
year closure and gas collection infrastructure project for the
will be based on the current 2015-2018 Capital Plan,
west 40-hectare section of the Vancouver Landfill, and phased
prioritized based on need, opportunities to leverage senior
construction of a dike as part of street construction and park
government and partner funding, and initiatives to drive development at the base of Kerr Street to align with the
business transformation. Investments in affordable housing, development plan in East Fraser Lands.
childcare, and active transportation remain high priorities,
as well as a continued focus on utility maintenance, Equipment and technology, including replacement of the City’s
fleet management system in 2018 and a continued focus on fleet
renewal and upgrades.
purchases with reduced greenhouse gas impacts and improved
operational efficiencies.
Capital Expenditure Trend Comparison
2012–2022 (in millions) New from 2015-2018 Capital Plan
485
500 Projects Continuing into 2018
439
450
406
406
380
380
380
380
381
400
178
350
$ (in millions)
312
297
284
288
266
300
253
242
250
188
228
200
150
100
FORECAST
FORECAST
FORECAST
FORECAST
FORECAST
FORECAST
BUDGET
BUDGET
BUDGET
BUDGET
BUDGET
ACTUAL
ACTUAL
ACTUAL
BUDGET
ACTUAL
ACTUAL
50
0
2012 2013 2014 2015 2016 2017 2018 2019 2020 2021 2022
2018 – 2022 Budget Outook Pg. 13Operating and Capital Budget risks Expenditure risks include:
2018–2022 • Costs associated with collective agreements for 2018
and beyond, including arbitrated agreements, for which
There are a number of internal and external risks that the City has no control over final settlement costs.
can affect the City’s five-year financial outlook and are
considered in developing the City’s budget. • Unforeseen increases in employee benefit costs,
including costs associated with employer pension
Revenue risks contributions, WCB premiums, employee extended
Approximately 76% of the City’s operating revenue comes health and dental benefits, and long-term disability
from property taxes and utility fees, which form a stable insurance claims.
and predictable revenue base for the City. Some revenues
come from cyclical activities such as development and • Unanticipated costs passed on to the City from other
permit fees which make up 5% of the City’s revenues. levels of government.
Revenue risks include: • Costs for unforeseen events, such as public
emergencies and issues related to climate change or
• Development permits and licence fees, which represent unusual weather events. These could include costs for
5% of the revenue budget, may be negatively affected higher water consumption during periods of low rainfall,
by senior government policy directions towards costs for flooding and wind damage, or higher costs for
housing, such as the Provincial 15% foreign buyers tax, snow and ice removal in periods of high winter storm
increases in mortgage rates and economic slowdown. activity.
• Program fee revenue, parking, rental and lease income • Delays in benefit realization and payback from business
combined generate 12% of the City’s revenue and are and technology transformations.
also sensitive to general economic conditions, seasonal
weather factors and increased market competition. • Any significant increase in interest rates, which will
increase the City’s debt servicing on new debt and limit
• Cost recoveries, grants and donations from external future borrowing capacity.
parties and provincial revenue sharing provide 5% of
City revenue and 6% of the City’s 2015-2018 Capital • Future needs for rapid transit and affordable housing
Program funding and are typically project-specific and could be a potential pressure in the five-year plan.
less predictable.
• Development contributions are a significant source Summary
of funding for growth-related capital investment. An
economic downturn could lead to less real estate Looking ahead for the next five years, we expect that
development and therefore less development-related continued rapid growth in our city will create challenges
capital sources of funding, resulting in some capital and the need for further investments from all levels of
projects being delayed or cancelled. government. We need to continue to invest in public
facilities and infrastructure to ensure that the health, safety
• Investment income could decline should interest rates and quality of life enjoyed by Vancouver residents and
decrease. businesses is sustained and improved. As our costs to
maintain and improve public facilities and infrastructure
Expenditure risks rise, we also need to find opportunities to create more
A significant portion of non-salary expenses are value for money in service delivery, while we continue to
contractually fixed and predictable in the short-term. focus on equity and creating a resilient, healthy and green
For expenses that are less predictable during the year, community.
the City’s annual budget includes a contingency to cover
unanticipated expenses, subject to approval by Council
before the funding is accessed.
2018 – 2022 Budget Outook Pg. 14How to share your input
on the 2018 budget
Between now and when the 2018 Budget is approved by
Council in December, your input will influence decisions
about how your tax dollars are spent.
The City is again offering a range of online and face-to-
face opportunities for the public to learn more about
the development of the 2018 budget and to share your
experiences of City services as well as your priorities for
public spending.
Online
Members of the public can take a brief online survey
through our Talk Vancouver platform.
vancouver.ca/budget
Community
Will be meeting with members of the City’s advisory
committees, community organizations, business Budget Roadshow
improvement associations, and not-for-profit organizations
to listen and learn. We will be popping up at Community Centres, Libraries and
Neighbourhood Houses to bring the conversation to you,
including family-friendly learning opportunities.
Public Dialogue
Monday, October 9
Come join us at City Hall on December 1 from 4:30 – 7:30 pm
Outside on northwest corner of 4th and Vine
to learn about the draft budget that includes community
(near Safeway/Whole Foods), 9 – 11 am
and public input to date, for a final chance to learn and
Save-On-Foods (3535 West 41st Avenue), 12 noon – 2 pm
comment before the 2018 budget goes to City Council.
Britannia Breezeway (1661 Napier Street), 3 – 5 pm
For more details and information about other opportunities
to provide feedback, please visit vancouver.ca/budget Wednesday, October 18
Trout Lake Community Centre (3360 Victoria Drive),
8 – 10 am
Collingwood Neighbourhood House (5288 Joyce Street),
11 am – 1 pm
Killarney Community Centre (6250 Killarney Street),
2 – 4 pm
Thursday, October 19
Mount Pleasant Neighbourhood House (800 East Broadway),
9 – 11 am
Creekside Community Centre (1 Athletes Way),
12 noon – 2 pm
Vancouver Public Library, Joe Fortes Branch/West End
Community Centre, 3 – 5 pm
17-113 2018 – 2022 Budget Outook Pg. 15You can also read