IEB Working Paper 2019/05 - DO SHORT-TERM RENTAL PLATFORMS AFFECT HOUSING MARKETS? EVIDENCE FROM AIRBNB IN BARCELONA - Institut d'Economia de ...
←
→
Page content transcription
If your browser does not render page correctly, please read the page content below
IEB Working Paper 2019/05

DO SHORT-TERM RENTAL PLATFORMS AFFECT HOUSING MARKETS?
EVIDENCE FROM AIRBNB IN BARCELONA
Miquel-Àngel Garcia-López, Jordi Jofre-Monseny, Rodrigo Martínez Mazza, Mariona Segú

                                                                                   Cities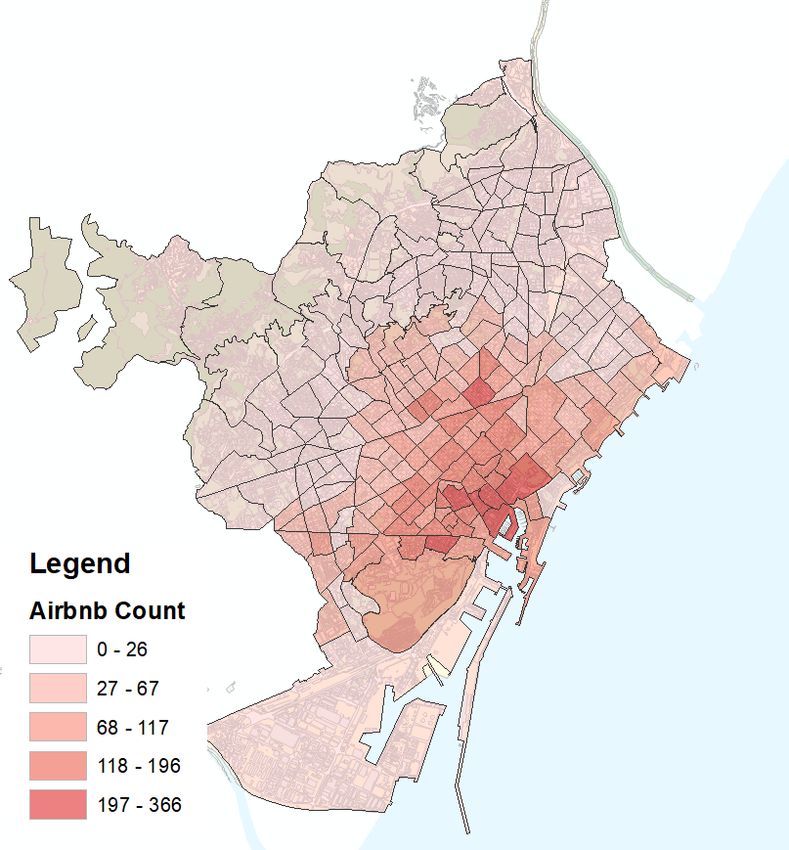
IEB Working Paper 2019/05

                DO SHORT-TERM RENTAL PLATFORMS AFFECT HOUSING
                    MARKETS? EVIDENCE FROM AIRBNB IN BARCELONA

                            Miquel-Àngel Garcia-López, Jordi Jofre-Monseny, Rodrigo
                                                     Martínez Mazza, Mariona Segú

The Barcelona Institute of Economics (IEB) is a research centre at the University of
Barcelona (UB) which specializes in the field of applied economics. The IEB is a
foundation funded by the following institutions: Applus, Abertis, Ajuntament de
Barcelona, Diputació de Barcelona, Gas Natural, La Caixa and Universitat de
Barcelona.

The Cities Research Program has as its primary goal the study of the role of cities as
engines of prosperity. The different lines of research currently being developed address
such critical questions as the determinants of city growth and the social relations
established in them, agglomeration economies as a key element for explaining the
productivity of cities and their expectations of growth, the functioning of local labour
markets and the design of public policies to give appropriate responses to the current
problems cities face. The Research Program has been made possible thanks to support
from the IEB Foundation and the UB Chair in Smart Cities (established in 2015 by
the University of Barcelona).

Postal Address:
Institut d’Economia de Barcelona
Facultat d’Economia i Empresa
Universitat de Barcelona
C/ John M. Keynes, 1-11
(08034) Barcelona, Spain
Tel.: + 34 93 403 46 46
ieb@ub.edu
http://www.ieb.ub.edu

The IEB working papers represent ongoing research that is circulated to encourage
discussion and has not undergone a peer review process. Any opinions expressed here
are those of the author(s) and not those of IEB.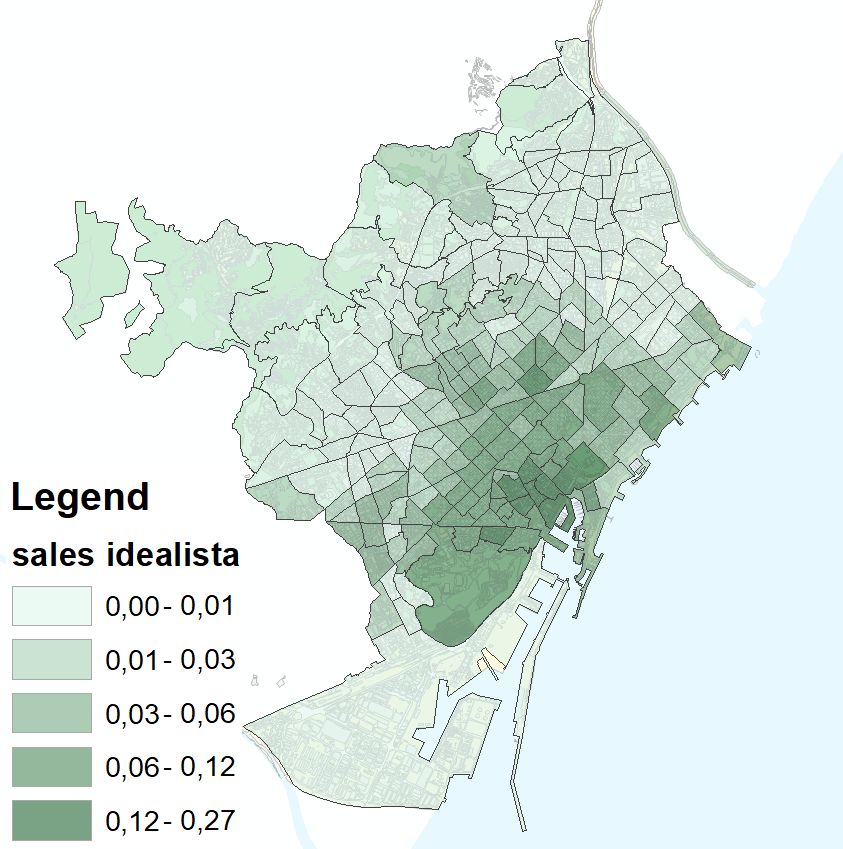
IEB Working Paper 2019/05

          DO SHORT-TERM RENTAL PLATFORMS AFFECT HOUSING
           MARKETS? EVIDENCE FROM AIRBNB IN BARCELONA *

               Miquel-Àngel Garcia-López, Jordi Jofre-Monseny, Rodrigo
                           Martínez Mazza, Mariona Segú

ABSTRACT: In this paper, we assess the impact of the arrival and expansion of Airbnb on
housing rents and prices in the city of Barcelona. Examining highly detailed data on rents
and both transaction and posted prices, we use several econometric approaches that exploit
the exact timing and geography of Airbnb activity in the city. These include i) panel fixed-
effects models with neighborhood-specific time trends, ii) an instrumental variable shift-
share approach in which tourist amenities predict where Airbnb listings will locate and
Google searches predict when listings appear, and iii) event-study designs. For the average
neighborhood in terms of Airbnb activity, our preferred results imply that rents have
increased by 1.9%, while transaction (posted) prices have increased by 5.3% (3.7%). The
estimated impact in neighborhoods with high Airbnb activity is substantial. For
neighborhoods in the top decile of Airbnb activity distribution, rents are estimated to have
increased by 7%, while increases in transaction (posted) prices are estimated at 19% (14%).

JEL Codes: R10, R20, R31, Z30

Keywords: Housing markets, short-term rentals, Airbnb

Miquel-Àngel Garcia-López                         Jordi Jofre-Monseny
Universitat Autònoma de Barcelona and IEB         Universitat de Barcelona and IEB

Rodrigo Martínez Mazza                            Mariona Segú
Universitat de Barcelona and IEB                  RITM, Université Paris Sud, Paris Saclay

*
   We are grateful to Gabrielle Fack, Apostolos Filippas, Laurent Gobillon, Hans Koster, Miren
Lafourcade, Florian Oswald, Henry Overman, Elisabet Viladecans-Marsal and participants of UEA
(Dusseldorf and New York) and RUES 2019 (Paris) for their valuable comments. We gratefully
acknowledge funding from Ajuntament de Barcelona (18S02330-001), Generalitat de Catalunya
(2017SGR-796 and 2017SGR-1301), Ministerio de Economía (ECO2016-75941R) y Ministerio de
Ciencia, Innovación y Universidades (RTI2018-097401-B-I00). Daniel del Pozo and David Rey
(Idealista) were very helpful and collaborative with their data.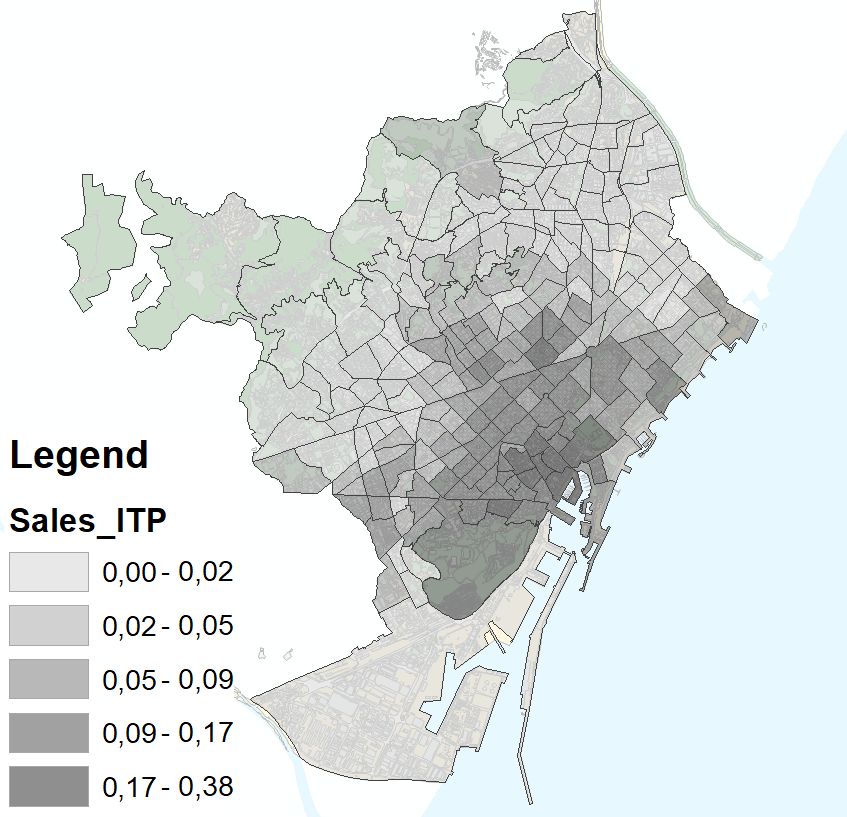
1       Introduction
       Tourism has grown enormously in recent decades. Between 1990 and 2017, the
worldwide number of international tourist arrivals increased from about 400 million to
1300 million (WTO, 2018). This pattern is particularly true for urban tourism; in fact, the
number of visitors to the 132 most popular world cities increased by 45% between 2009 and
2015.1 Peer-to-peer platforms such as Airbnb have recently entered the market through
partly accommodating the increased demand for tourism in cities. As a consequence,
they have contributed to increasing the overlap between tourism and housing markets by
allowing owners of residential properties to enter the hospitality sector.
       Proponents of peer-to-peer platforms argue that short-term rentals provide residents
with an additional source of income while allowing for tourism decentralization within
cities. From an economic point of view, home-sharing platforms can be seen as an ef-
ficiency improvement in markets where goods are not fully used (Barron et al., 2018).
One could argue that empty apartments during holiday periods are efficiency losses that
can be reduced by means of short-term rentals. However, if home-sharing platforms are
used by owners to permanently shift from long- to short-term rentals for tourists, the
supply of units in the long-term market will be reduced, increasing housing prices and
rents. Those that oppose peer-to-peer platforms also emphasize that short-term rental
units in residential areas might constitute a negative externality for residents in terms of
noise or uncivil behavior and that they cause gentrification and displacement of long-term
residents.2 Complaints about the gentrification effects and nuisances of short-term rentals
have resulted in the implementation of local policies that limit the expansion of platforms
such as Airbnb. Examples of such policy responses include the requirement to have a spe-
cific permit (Barcelona, Berlin, Paris, San Francisco, and Los Angeles), limiting the rental
period (Amsterdam, New York, Paris, and San Francisco), paying a rental tax (Amsterdam
and San Francisco), or outlawing short-term rentals in some conditions (Berlin and New
York).
       Despite all these local policy responses, we still have limited evidence on the effect
of peer-to-peer platforms on housing markets. In this paper, we analyze the effects of the
arrival and expansion of Airbnb in Barcelona. Barcelona constitutes an ideal city to study
the effects of Airbnb on local housing markets for several reasons. First, Barcelona has
experienced a tourism boom, with the number of passengers in the city’s airport increasing
from 20 to 47 million between 2000 and 2017. In fact, Barcelona is currently the 7th most
visited destination in Europe (and the 17th worldwide). Second, Airbnb accounts for the
lion’s share of peer-to-peer platforms activity in the city, far ahead of its competitors3 .
Third, Airbnb penetration in Barcelona is high, with Barcelona being Airbnb’s 6th top
destination worldwide.4
       Table 1 compares the size of the stock of Airbnb listings in Barcelona, New York,
Los Angeles and Paris in 2015. Despite (substantial) legal uncertainties regarding the use
of peer-to-peer platforms such as Airbnb in Barcelona, about 2.06% of all units are listed
    1
     Mastercard Global Destination Cities Index.
    2
     Similarly, the hotel industry opposes home-sharing platforms, as they are viewed as a threat to fair
competition. Zervas et al. (2017) empirically studies the effect of Airbnb on hotels revenues.
   3
     For Barcelona, the market share of Airbnb is around 70% according to the datahippo project
(https://datahippo.org/es/) which collects data for several peer-to-peer platforms since 2017. We do
not use these data as they do not cover the period we study.
   4
     ‘You’ll never guess which city has the most Airbnb listings’. Forbes. J Bishop 2017.

                                                   2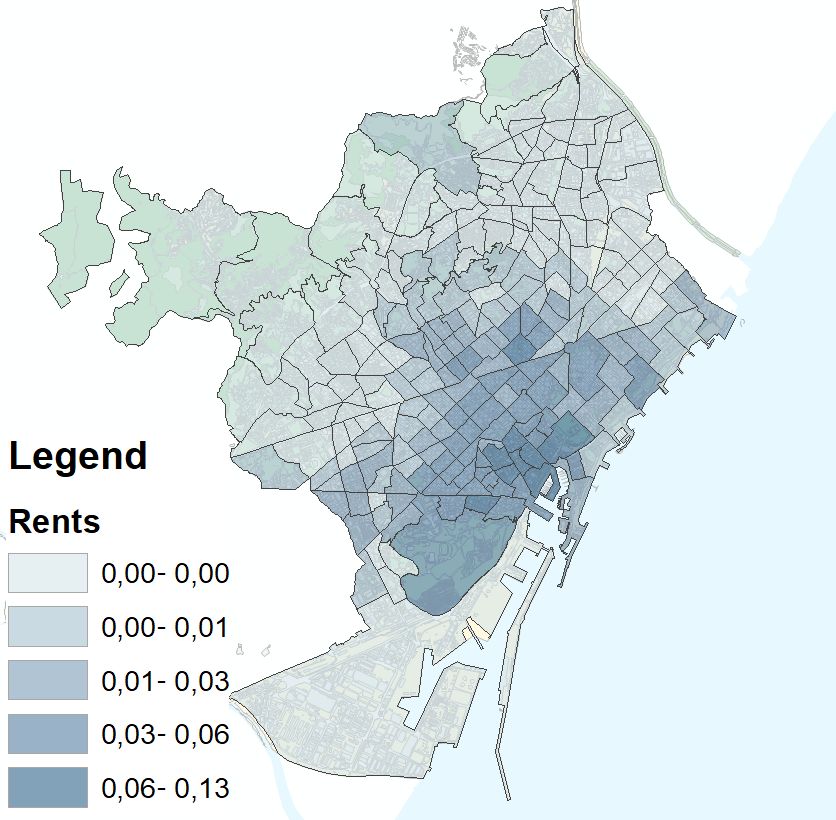
on Airbnb. 5 This figure is higher than in New York (1.31%) and Los Angeles (0.86%),
while it is very similar to Paris (2.09%). However, if we measure Airbnb listings relative
to the number of rented units, the percentage for Barcelona rises to 6.84%, a figure that is
significantly higher than in the other cities in the table.6 This high penetration of Airbnb
in Barcelona is likely to be explained by the (large) difference between the returns of short-
and long-term rentals. At the bottom of Table 1, we provide estimates of the returns of
Airbnb relative to those of long-term rentals. In 2015, the average long-term rental price
in Barcelona was e11 per night (e735 per month), while the average Airbnb price (short-
term rental) was e71 per night. Hence, a unit on Airbnb for 10 days a month would yield
the same monthly income as a long-term rental.

                        Table 1: Airbnb activity in 2015 in selected cities

                                           Barcelona       New York        Los Angeles         Paris
  Airbnb Listings                            16,951          45,260            30,000         35,000
  as % of total units                         2.06            1.31              0.86           2.56
  as % of rented units                        6.84            1.92              1.56           4.97
  Average Airbnb price/day (e)                 71              131              114             81
  Long-term rent/day (e)                       11               59               75             37
  Days/month for same revenue                  10               14               20             14

 Notes: Data on Barcelona come from Cadastral Records and INCASOL, data on New York and Los
Angeles come from US Census Bureau, Zillow Rent Index and airdna, and data for Paris come from
INSEE and OLAP. All Airbnb data have been obtained through InsideAirbnb.

       To study the effect of Airbnb listings on housing rents and prices, we combine pub-
licly available web-scraped data on Airbnb listings in Barcelona with high-quality data on
housing markets. Specifically, we have access to i) individual-level data on the universe
of transactions of second-hand apartments sold in the 2009-2016 period and ii) all posted
ads for rentals and sales from a major real estate website (Idealista) that were active each
December in the 2007-2017 period. We aggregate the information at the geographical level
of small neighborhoods, which leaves us with a panel dataset of 220 small geographical
areas that have an average population of about 7,000 inhabitants.
       Throughout the empirical analysis, our dependent variable is the average residual
resulting from a hedonic regression in which log rents or housing prices are regressed on
time dummies and unit characteristics. In all regressions, we control for neighborhood and
time fixed effects. Since Airbnb has grown the most in central parts of the city, our main
identification concern is that neighborhoods that experienced higher Airbnb penetration
might also be simultaneously experiencing processes of gentrification.7 We adopt several
strategies to control for the potential confounding effects of gentrification.
    5
      Barcelona’s regulation of short-term rental platforms has not substantially changed during recent years.
A city law passed in 2007 (Housing Rights Act 18/2007) states that tourist apartments that are neither
primary nor secondary residences are required to have a business activity permit. Hence, when Airbnb
first arrived in Barcelona around 2009, the short-term rentals of entire apartments without a permit were
illegal. Nevertheless, enforcement of the law was very low until 2016, when the number of inspections
substantially increased.
    6
      Compared to traditional tourist accommodation, the number of active listings during 2017 was equal
to 32% of the total number of beds in hotels in the city in that same year.
    7
      For the US, processes of urban revival have been described and studied by Baum-Snow and Hartley
(2016); Couture and Handbury (2016), while Behrens et al. (2018) focus on the changes in local busi-
nesses associated with gentrification processes. González-Pampillón et al. (2019) provide some evidence of
gentrification in the city center of Barcelona.

                                                      3
First, we control for the time-varying neighborhood demographic characteristics that
are associated with gentrification processes. Second, we allow for each small neighborhood
to have a specific linear time trend. Third, we apply an IV strategy, where the instrument
is the interaction between i) a measure of proximity to the city’s tourist amenities at
the neighborhood level and ii) a Google Trends measure that tracks changes in Airbnb
activity over time. The proximity to tourist amenities predicts where Airbnb will locate,
while Airbnb searches in Google predict when listings appear. We indirectly verify the
exclusion restriction by showing that proximity to tourist amenities does not predict rent
and price growth in the pre-Airbnb period (i.e., before 2013). Finally, we also estimate
event-study regressions. We dummify Airbnb activity (beyond the 90th percentile) and
estimate interaction terms between year dummies and the Airbnb intensity indicator that
identifies those areas with more Airbnb listings. This approach allows us to check if prior
to the expansion of Airbnb, housing markets were evolving similarly in neighborhoods that
after 2012 would experience high Airbnb penetration compared to others.
       Our findings indicate that Airbnb has increased both rents and prices. For rents, our
preferred specification result suggests that 54 more active listings in a small neighborhood
(about the average level in 2016) increase rents by 1.9%, while transaction and posted
prices increase by 5.3% and 3.67%, respectively. However, our estimates imply that local
impacts can be substantial in the most tourist parts of the city. In particular, our results
imply that 200 listings (the average number of listings in the top decile of the Airbnb
activity distribution in 2016) increase rents by 7% and transaction and posted prices by
19% and 14%, respectively. We develop a stylized model of the housing market, where
owners can decide to rent long term to residents or short term to tourists. Consistent with
our findings, the model predicts that Airbnb will increase housing prices and rents, with
the former effect being larger than the latter. In terms of mechanisms, the model predicts
that Airbnb reduces the supply of residential housing units. In line with this prediction,
our analysis shows that Airbnb listings reduce the number of resident households in the
neighborhood.
       Despite Airbnb being a recent phenomenon, there are already some research papers
that estimate the effect of Airbnb on housing markets in the US. Barron et al. (2018)
perform an analysis similar to ours. They look at the impact of Airbnb on rents and
house prices for all cities in the US.8 Their main strategy consists of using a ‘shift-share’
instrument, where the time variation comes from Google Trends of ‘Airbnb’ searches, while
the cross-sectional variation is a neighborhood ‘touristiness’ index based on the location
of restaurants. They find that a 1% increase in Airbnb listings increases rents by 0.018%
and housing prices by 0.026%. Finally, Koster et al. (2018) study the effects of Airbnb
bans implemented by several, but not all, governments in the Los Angeles area. Exploiting
changes in prices at the administrative border, they find that banning Airbnb decreases
prices by about 5%.
       We contribute to the literature in several ways. First, as explained above, in Barcelona,
the difference in returns between Airbnb and long-term rentals is large, resulting in high
levels of Airbnb activity. Second, we have access to multiple high-quality datasets to track
granular changes in both housing rents and prices. These individual-level data allow us
to measure changes in rents and housing prices while controlling for composition changes
   8
    An earlier contribution is Sheppard et al. (2016) that focuses on New York City. Their results suggest
that doubling Airbnb in a 300-meter circle around a property translates to an increase in its value by 6%
to 9%

                                                    4
in rented or sold units. Third, this is the first study to estimate the effects of Airbnb
in the context of a large European city. This is relevant given the underlying differences
between European and US cities. For instance, there might be less excess capacity in
European cities, where guest houses or basement apartments (below a main house) are
virtually nonexistent. For the case of Barcelona, our analysis below shows that only a
small proportion of housing units active on Airbnb are primary residences. Despite these
differences, the results that we find are remarkably close to those found in Barron et al.
(2018). Compared to Koster et al. (2018), our paper focuses on a different channel through
which Airbnb affects housing markets. The spatial RD design, which constitutes the main
analysis in Koster et al. (2018), compares changes in prices across municipality borders
following Airbnb bans. This neatly identifies the price increase of a property due to the
possibility of using Airbnb. However, properties located across a border might be part of
the same housing market, and thus, their spatial RD estimates do not capture changes in
rents and prices that are caused by supply reductions. Our last contribution is precisely
to provide direct evidence on the supply mechanism by showing that Airbnb reduces the
number of households living in the neighborhood.
       The paper is organized as follows. In Section 2, we develop a stylized model to
understand the channels through which short-term rentals might affect the residential
markets of neighborhoods. Section 3 describes the Airbnb, rents and housing prices data
and describes the most relevant variables. A description of the empirical strategies we
follow is provided in Section 4. The main results are presented and discussed in Section 5,
while Section 6 contains the instrumental variables and event-study results. Finally, some
concluding remarks are provided in Section 7.

2    Theoretical framework
       In this section, we develop a theoretical framework to study the effects of short-term
rentals to tourists on the market for long-term rentals. The model is a partial equilibrium
model and focuses on the rental market of a central neighborhood n. In this neighborhood,
there is a housing stock of size C that is owned by absentee landlords.
       Each resident in the city consumes one unit of housing. Owners can rent their
apartments through a long-term rental to a resident and obtain an annual market rent Q or,
alternatively, rent short-term to tourists and obtain an annual rent of T , where T > Q. T
reflects the (exogenous) tourists’ willingness to pay to stay in the neighborhood. We assume
that there is an individual-specific cost bj to rent short-term to tourists, which reflects the
legal uncertainties or the costs of running an Airbnb business. bj is heterogeneous across
owners since they can differ in their risk aversion towards legal uncertainties or their access
to legal services, as well as their valuation of privacy. If T − bj > Q, the owner rents short
term to tourists, while if T − bj ≤ Q, the owner rents long term to a resident. This allows
T and Q to differ in equilibrium, which is a salient feature of the data for the case of
Barcelona. In equilibrium, there is a marginal owner who is indifferent between renting to
residents or to tourists, T − b∗j = Q, which implies that owners with bj < b∗j rent short
term, while those with bj ≥ b∗j rent long term.
       The utility that a resident obtains in neighborhood n is Uin = Yi − Q − αFb (b∗j ) + ai ,
where Yi is income and αFb (b∗j ) is a term reflecting the negative externality that tourism

                                               5
can impose on residents due to noise or uncivil behavior.9 Finally, ai is an idiosyncratic
term reflecting the preference of resident i to live in neighborhood n. If we normalize the
utility level that resident i can obtain elsewhere in the city to Yi , the willingness to pay to
live in neighborhood n of the marginal resident is Q(a∗i ) = −αFb (b∗j ) + a∗i , with everyone
with ai > a∗i living in n and everyone with ai ≤ a∗i living somewhere else.
In equilibrium, the long-term rental market in neighborhood n must clear, which
implies C(1 − Fb (b∗j )) = 1 − Fa (a∗i ). Without loss of generality, we assume that bj and
ai are U ∼ (0, 1) which simplifies the market clearing condition to C(1 − b∗j ) = 1 − a∗i .
Combining the market clearing condition, the willingness to pay of the marginal resident,
Q = a∗i − αb∗j , and the definition of the marginal owner, T − b∗j = Q, we obtain the share
of owners that rent short term to tourists:
C −1+T
(1) b∗j =
1+C −α
Equation 1 indicates that the penetration of Airbnb is determined by T , which reflects
tourists’ willingness to pay to stay in the neighborhood. In Appendix A, we show that the
number of Airbnb listings in a neighborhood is closely related to the average price of its
listings, as equation 1 predicts. T reflects how attractive a neighborhood is to tourists. In
Section 4.2, we also document that the proximity to relevant tourist attractions is a strong
predictor of Airbnb activity at the neighborhood level. Hence, the predictions of the model
in terms of where Airbnb activity should be higher are supported by the data.
When the neighborhood is of little interest to tourists, i.e., T ≤ 1−C, residents outbid
tourists, and there are no short-term apartments in the neighborhood. For T ≥ 1 − C,
b∗j > 0, and the equilibrium price of long-term rentals is obtained by inserting the market
clearing condition in the residents’ willingness to pay function:10
(2) Q = 1 − C + (C − α)b∗j
Equation 2 indicates that more units in the short-term rental market affect long-
term rents through two different mechanisms that work in opposite directions. First, one
additional unit in the short-term market reduces the number of long-term residents, which
mechanically increases a∗i , as the market clearing condition reveals. To put it differently,
reducing the supply of long-term units increases their price. Second, a marginal increase
in b∗j means higher negative externalities, which contribute to lower long-term rents.
We follow the approach of Barron et al. (2018) to relate rents and housing prices.
The market is assumed to be in a steady state, and the price of a housing unit (P ) is given
by the present value of discounted cash flows to the landlord:
∞
" # " #
Z b∗j (b∗ )2
X 1 j
(3) P = δ t (1 − b∗j )Q + (T − b)db = Q + (T − Q)b∗j −
0 1−δ 2
t=1
9
Tourism as a negative externality is in line with the local population’s perception of tourism as a
negative phenomena in Barcelona. This fact has been documented by the biannual opinion poll made by
the local authorities since 2011, which surveys citizens’ perceptions of Barcelona’s largest problems since
2011. In this poll, tourism was mentioned, on average, as the fourth major problem of the city during the
entire period, reaching the top of the ranking in 2017.
10
If 2 − α ≥ T , b∗j becomes zero, as the negative externalities drive all residents out of the neighborhood.
6Assuming δ as the discount factor, the cash flow in each period reflects the fact that
1− b∗j
units are rented long-term at price Q, and b∗j units are rented in the short-term
market at rate T paying the cost bj . Equation 3 indicates that Airbnb increases housing
prices (P ) more than rents (Q) as part of the stock available for rent obtains a return of
T − bj that is higher than Q.
Equations 2 and 3 guide our empirical analysis consisting of regressing changes in
housing rents or prices on changes in Airbnb activity at the neighborhood level. In terms
of mechanisms, one immediate prediction of the model is that Airbnb displaces residents.
Equations 1 to 3 suggest the main identification threat that we face. The effect of Airbnb
activity on residential housing markets will be biased if neighborhoods where Airbnb pen-
etration is high (because T is high) experience changes in the residents’ willingness to pay
to live there at the time when Airbnb expands in the city.
The model also illustrates that Airbnb has strong redistributive impacts. We defer
this analysis to Appendix B. There, we show that owners benefit from Airbnb either because
they obtain the short-term rental rate (which is higher than the long-term rate) or because
Airbnb increases the long-term rental rates. In contrast, long-term residents are worse
off since they face higher rents and experience the negative externalities of tourism. This
uneven distribution of costs and benefits of Airbnb is likely to explain the opposition that
Airbnb has met in cities where the residential and tourism markets overlap the most.
3 Data and variables
3.1 Neighborhood definition
Our geographical unit of analysis is the basic statistical area (BSA). BSAs are built
and used by the Barcelona City Hall for statistical purposes. There are 233 BSAs with
an average of 7,122 inhabitants. We believe that BSAs are the appropriate neighborhood
definition, as they are designed to contain similar populations in terms of socioeconomic
characteristics. On a more practical note, their size is sufficient to generate meaningful
measures of housing rents and prices for neighborhoods over time.
3.2 Airbnb
To measure Airbnb activity, we use information extracted directly from the website
of Airbnb. These data have been collected at different points in time by an independent In-
ternet user who has made the data publicly available. The dataset is called InsideAirbnb,
and for Barcelona, it contains 21 data points and covers the time period April 2015 to
February 2018. For every listing, there is information on the host ID, geographical coor-
dinates, room characteristics, date the host registered, and date of each review received.
Even though Airbnb is not the only peer-to-peer platform active in the city, we consider
that its listings are a good proxy for the short-term rental market. On the one hand, as
explained above, its market share is by far the highest among its competitors. On the
other hand, most short-term rentals are advertised through more than one platform simul-
taneously, implying that adding listings from a second platform would entail significant
problems of double counting.
For our purposes, it is crucial to identify the period that a listing has been active,
with its entry and exit dates, and any possible break period in between these two points.
7The main complication we face is that the scraped information starts only in 2015, and
hence, a listing count does not provide information for the period prior to April 2015. To
build a measure of Airbnb listings for the period of analysis, we use a method similar to
that proposed by Zervas et al. (2017). We consider that a listing is active in a given quarter
if it has received at least one review during that quarter. According to Airbnb, 72% of
guests leave a review, which supports proxying stays with platform reviews.11
The potential consequences of Airbnb might be very different if Airbnb is used to
rent out excess capacity (home-sharing), or if units are rented through Airbnb as their
primary use. We label as ‘commercial’ the listings that correspond to this second category.
Listings in Airbnb are entire apartments, private rooms or shared rooms. To obtain an
idea of the magnitude of home-sharing versus commercial use of Airbnb, we consider as
commercial listings those that are i) multi-hosted properties (those properties whose host
has more than one listing) and ii) single-hosted entire apartments that have a minimum
of 5 reviews per quarter. This definition is clearly conservative, as many entire properties
are rented as separate private rooms.12 Despite this, more than 75% of all listings in every
single year in our sample correspond to this (conservative) commercial category. Hence,
although there is some genuine home-sharing, Airbnb in Barcelona is mostly a commercial
activity.
3.3 Rents and Prices
We use two sources of data to obtain information on rents and prices at a fine spatial
level. In particular, we have two measures for prices (transaction prices and posted prices)
and one measure for rents (posted rents). For transaction prices, we use data from the
Catalan Tax Authority from transaction tax records, which contain information on the
price, exact location, date of transaction, size of the housing unit, year of construction,
and a variable reflecting the quality of the dwelling. We have the universe of transactions
that occurred in Barcelona during the period 2009-2016.13 We label this dataset ITP
(Impuesto sobre Transmisiones Patrimoniales) or transaction prices.
For posted rents and prices, we use information from the online real estate portal
Idealista. With more than one million ads and an average of 17 million weekly views,
Idealista is by far the most important Spanish real estate portal. Idealista has provided us
with all ads that were active for the city of Barcelona in December of every year for the
period 2007-2017.14 The data include the exact location, the posted rent or price and the
size of the unit, among other characteristics.15
Having two measures of prices is useful because both transaction and posted prices
11
An alternative approach would be to use the entry date and assume that listings never exit, which is
the preferred method in Barron et al. (2018). In the case of Barcelona, we consider that this approach is
problematic. First, approximately 25% of all listings do not have any reviews at all. Second, the entry
date indicates the time when the host registered. If the host has multiple listings (which is the case for
the majority of listings in Barcelona), it is not possible to know the entry date of each listing.
12
This practice increased after July 2016. Short-term rentals of entire apartments without a permit is
illegal, but enforcement was very low before July 2016. It is less clear if renting a private room is also
against the law, and in practice, enforcement with respect to private rooms has been low throughout the
period we study.
13
We keep only those sales transactions with a declared value of less than 10,000,000 euros.
14
We have dropped the following data: for sales, we drop those sales ads with posted prices below 10,000
euros and those of less than 20 square meters, and for rental ads, we drop all ads with monthly rents below
100 euros or above 30,000 euros.
15
Other characteristics that are available and that we use are number of floors, number of rooms, presence
of air-conditioning, lift and boxroom, and whether it is a studio, penthouse, or duplex.
8have advantages and disadvantages. Posted prices might differ from agreed upon prices
since there is often some bargaining in the process. Official transaction prices should, in
principle, measure prices more precisely. However, in practice, the transaction (ITP) data
have two limitations. First, there might be a nonnegligible time lapse between the date
at which parties agree on a price and the date when the ITP tax is paid. Second, there
is some fraud in the ITP tax that consists of underreporting the ITP price and thus the
tax base. For rents, we cannot compare posted to actual rents. However, Chapelle and
Eymeoud (2018) show that bargaining is less of an issue for rents and that online posted
prices are a good measure of actual rents.
3.4 Descriptive Statistics
In Figure 1, we plot the evolution over time of Airbnb activity, together with that of
rents and prices. Airbnb experienced a very rapid increase from its first entrance in 2009 up
to 2017, when the growth stopped because of City Hall’s increased efforts to reduce tourist
apartments operating without a license. In 2016, the average BSA had 54 listings, while
High Airbnb Areas (those BSAs in the top decile) had an average of 200 active listings.
In these areas of the city, approximately 5% of all housing units are listed on Airbnb.
The (substantial) variation in Airbnb activity across neighborhoods is further explored in
Figure 2, which shows the distribution of Airbnb listings across BSAs for the last quarter of
2016. Airbnb activity is higher around the city center and, to some extent, along portions
of the beach line. Note that Airbnb activity is low in many parts of the city.
Figure 1: Airbnb listings, rents and prices: 2007-2017
160
200
150
Rent, Prices 2013=100
140
Airbnb Count
100
120
50
100
0
2007 2008 2009 2010 2011 2012 2013 2014 2015 2016 2017
Av AirbnbCount High Airbnb Areas Av AirbnbCount
Rent/m2 Prices/m2
Notes: This graph plots the evolution over time of the BSA averages in Airbnb listings, rents and posted
prices (per square meter) for the period 2007-2017. Rents and prices are normalized to their 2013 value.
The dark gray bars represent the average Airbnb listings for all BSA, while the light gray bars depict the
average listings for High Airbnb Areas (BSAs in the top decile of the Airbnb listings distribution in 2016).
As for the evolution of housing rents and prices, it can be observed that the period
that we study is a turbulent one. Following the financial crises and the burst of the Spanish
9Figure 2: Airbnb activity across BSAs in 2016
Notes: This graph plots the number of active Airbnb listings in the fourth quarter of 2016 at the BSA
level.
housing bubble, rents and prices fell until 2013, when they started recovering. While prices
reached the precrisis levels towards the end of the period, rents surpassed their precrisis
levels around 2015 and kept rising. In fact, housing affordability is one of the main concerns
among residents.16 The recovery of rents and prices coincides in time with the expansion
of Airbnb. In this paper, we attempt to determine how much of this overlap is causal.
For completeness, in Table 2, we report descriptive statistics of Airbnb listings,
housing rents and prices, and sociodemographic characteristics that are used as controls in
the regression analyses. More specifically, we report the BSA means for the years 2012 and
2016 for two different samples: all BSAs and High Airbnb Areas (BSAs in the top decile
of the Airbnb listings distribution in 2016).
16
See ‘El acceso a la vivienda, el principal problema de los barceloneses’ Macedo, G., October 2010.
10Table 2: Descriptive statistics: Variables’ means across BSA for 2012 and 2016.
2012 2016
All High All High
BSAs Airbnb Areas BSAs Airbnb Areas
Airbnb Count 2.79 13.35 47.84 178.58
Rent (e/m2 ) 11.83 12.93 16.39 20.19
Posted Price (e/m2 ) 3250 3338 3753 4282
Transaction Price (e/m2 ) 2269 2356 2619 3027
Population 6978 7750 6973 7514
Population Density 0.03 0.04 0.03 0.04
Mean Age 43.36 42.10 43.69 42.08
% of Foreign Population 0.18 0.32 0.17 0.33
House Average Occupancy 2.47 2.41 2.48 2.41
Unemployment Rate 10.48 10.81 7.80 7.83
Income Index 98.37 96.48 102.78 104.58
Notes: Columns 1 and 3 report the mean for all BSAs in 2012 and 2016. Columns 2 and 4 report the
means of High Airbnb Areas (BSAs in the top decile of the Airbnb activity distribution in 2016).
4 Empirical Strategies
4.1 Baseline Specification
Our main analysis consists of estimating the variants of the following fixed-effects
specification:
(4) log(Yn,t ) = βAirbnb countn,t + γXn,t + µn + τt + εn,t
where Yn,t is our measure of housing rents or prices at the BSA level, Airbnb countn,t
is the number of active listings in quarter t, τt are time fixed effects, and µn are BSA
fixed effects that account for time-invariant neighborhood characteristics. Our dependent
variable log(Yn,t ) is the average residual at the BSA-time period level of a (micro-level)
regression in which log rents (or log housing prices) are regressed on time dummies and
unit characteristics.17 This controls for price changes across neighborhoods that could be
explained by changes in the composition of units rented or sold across BSAs and over
time. For example, it allows us to control for the fact that some BSAs might have a
growing proportion of high-end apartments being sold or rented over time. Throughout
the regression analyses, we weight BSA-year cells by the relevant number of ads or sales.
Standard errors are clustered at the BSA level to account for serial correlation within panel
units (Bertrand et al., 2004).
Our main concern regarding identification is that neighborhoods in which Airbnb
activity grew the most during our period of study might be experiencing processes of
sociodemographic change, which might have a direct impact on housing rents and prices.
Specifically, Airbnb has grown the most in central parts of the city that have also been
experiencing processes of urban revival in the last two decades. We adopt several strategies
to control for the potential confounding effects of gentrification.
First, we introduce in equation 4 a set of time-varying demographic controls at the
17
We construct a panel on the BSA-year (data from Idealista) and BSA-quarter (transaction prices)
11BSA level (Xn,t ), namely, average age, log of population density, average household occu-
pancy rate, unemployment rate, relative income, and percentage of foreign residents. This
allows us to control for yearly changes in variables associated with processes of gentrifica-
tion. In some specifications, we allow for neighborhoods with different characteristics to
have different linear time trends by introducing interactions between a linear time trend
and the control variables measured in 2012, i.e., Xn,2012 × t.
Second, a more demanding approach in terms of data is presented in equation 5:
(5) log(Yn,t ) = βAirbnb countn,t + γXn,t + µn + τt + ρn × t + εn,t
which includes the term ρn ×t that fits a BSA-specific linear time trend by estimating
interaction terms between a BSA-specific coefficient (ρn ) and a time variable t. This is a
very flexible specification since it allows for each BSA to have its own linear time trajectory
in housing rents and prices. Here, the variations that we exploit are deviations from each
BSA’s own specific linear time trend. However, if Airbnb affects not only (rent or price)
levels but also trends in these variables, including BSA-specific linear time trends, it will
confound the effect of Airbnb with the BSA-specific time trend (Wolfers, 2006). Thus,
we will resort to a procedure previously applied in the taxation (Kleven et al., 2014) and
minimum wage (Monras, 2015) literature and estimate linear time trends using data prior
to 2013 only (i.e., the pre-Airbnb period). Specifically, the method involves the estimation
of the following two equations at a neighborhood-time level:
(6) log(Yn,t ) = µn + τt + ρn × t + n,t , for t ≤ 2012
(7) ^
log(Yn,t ) = βAirbnb countn,t + γXn,t + τt + εn,t , for all t
The first equation predicts the outcome based on BSA dummies, time dummies, and
BSA-specific linear time trends. Based on these coefficient estimates, we predict log(Yn,t )
for the entire sample years and compute the residuals, log(Y^ n,t ). In the second stage
(equation 7), we regress these residuals against Airbnb listings, time dummies and the
time-varying demographic controls (Xn,t ).
4.2 Instrumental Variables Fixed-Effects Models
We also estimate equation 4 through two-stage least squares regression using as an
instrument a shift-share variable that combines i) cross-sectional variation across BSAs in
tourist amenities and ii) aggregate time variation in Airbnb activity.
Starting with the cross-sectional ‘share’ component of the instrument, we build an
index that measures proximity to tourist amenities. To that end, we use TripAdvisor to
produce a complete list of the city’s tourist amenities.18 We then proceed by geolocating
the tourist amenities and by obtaining the number of reviews in Google to weight their
relative importance.19 Our measure of tourist amenities is built as follows:
18
TripAdvisor is a website that offers tourism-related content. According to the site, it currently has
over 390 million monthly unique visitors. We exclude the more endogenous and less historical amenities
such as areas known for restaurants, bars or clubs.
19
Although TripAdvisor also provides reviews, these are fewer in number than on Google.
12X 1
(8) T ouristAmenitiesn = ∗ Reviewsk
distn,k
k
where k indicates the amenity, distn,k is the distance in meters between the centroid
of each BSA n and amenity k, and Reviewsk is the number of reviews in Google. Figure
3 shows the location of these amenities, where the size of each circle is proportional to the
number of reviews received.
Figure 3: Location of tourist amenities
Notes: The size of the circles is proportional to the number of reviews received.
As can be see in Figure 3, tourist amenities are concentrated in the city center,
although three of the most important ones have a less central location. These are the
Sagrada Familia (easternmost large circle), Parc Güell (northernmost large circle) and
Camp Nou (westernmost large circle). Being the ‘share’ component of the instrument, the
tourist amenities index should predict where Airbnb listings will appear. Panel a) in Figure
4 plots this relationship by binning the data for deciles of the tourist index distribution.
The graph clearly shows that BSAs that are closer to tourist amenities tend to show the
highest number of Airbnb listings. This relationship can be rationalized by the model of
Section 2. Tourists’ willingness to pay (T in the model) is higher close to tourist amenities,
where tourists outbid residents, which results in high levels of Airbnb activity. Consistent
with this prediction, in Appendix A, we show that, indeed, Airbnb activity is higher in
BSAs where the price of Airbnb is also higher.
Turning to the ‘shift’ component of the instrument, we follow Barron et al. (2018)
and use worldwide searches in Google for the term ‘Airbnb Barcelona’. This variable is
measured at a monthly level and is normalized to 100 for the month with the highest
13number of searches. Panel b) of Figure 4 shows that the number of Google Trends searches
for ‘Airbnb Barcelona’ tracks the time variation in Airbnb activity very well.
Figure 4: Airbnb activity, tourist amenities and Google Trends searches.
15000
80.00
200
GoogleTrend Airbnb (dashed line)
60.00
150
10000
Airbnb Count (full line)
Airbnb Count
40.00
100
5000
20.00
50
0.00
0
0
4.5 5 5.5 6 6.5 7 2009q1 2011q1 2013q1 2015q1 2017q1
log TripAdvisor index quarter
(a) Airbnb activity and tourist amenities (b) Airbnb activity and Google Trends searches
Notes: Graph (a) shows BSA Airbnb listings as a function of the tourist amenities index (bins are deciles
of the tourist amenities distribution). Graph (b) shows the time profile of Airbnb listings (solid line, left
axis) and Google Trends searches for ‘Airbnb Barcelona’ (dashed line, right axis).
The rationale behind the instrument works as follows. The proximity to tourist
amenities predicts where Airbnb will locate, while searches in Google Trends for the term
‘Airbnb Barcelona’ predict when listings will appear. The relevance of the instrument is
testable, and we return to it below. As for instrument validity, recent research on shift-
share instruments indicates that the main identification threats are related to the ‘share’
component of the instrument (Goldsmith-Pinkham et al., 2018). Since our specifications
contain a BSA fixed effect, instrument validity hinges on the assumption that the cross-
sectional ‘share’ component, proximity to tourist amenities, is only correlated with changes
in housing rents and prices through Airbnb listings. For example, our instrument would
be invalid if residents’ valuation of proximity to tourist amenities (or any other BSA char-
acteristic that correlates with it) has changed over the period we study. If the instrument
is valid, proximity to tourist amenities should not explain changes in housing rents and
prices prior to the arrival of Airbnb. We address this issue at length below.
4.3 Event study plots
Finally, we also conduct event study exercises by focusing on the High Airbnb Areas
(BSAs in the top decile of the Airbnb listings distribution in the last quarter of 2016).20
Then, we perform regressions of the following type:
X
(9) log(Yn,t ) = δt × 1{HighAirbnbArea2016 } + γXn,t + µn + τt + εn,t
t6=2012
where HighAirbnbArea2016 indicates if the BSA belongs to the top decile in the 2016
Airbnb listings distribution. As in previous regressions, we include time and BSA fixed ef-
fects and time-varying demographic characteristics (Xn,t ). We estimate HighAirbnbArea2016
20
In robustness tests, we alternatively use the top 5% and the top quartile.
14× year interactions, leaving 2012 as the base year. Each of these coefficients quantifies the
price difference between the High Airbnb Areas and the control group relative to the 2012
difference. Again, we choose 2012 as the last pre-Airbnb year, as starting in 2013, Airbnb’s
activity became more significant. This exercise allows us to check if, prior to the arrival of
Airbnb, High Airbnb Areas showed parallel trends in housing rents and prices compared
to other neighborhoods.
5 Main Results
5.1 Graphical evidence
Before proceeding to the regression results, in Figure 5, we show graphical evidence of
the effect of Airbnb on housing markets. Specifically, we plot raw average (log) prices and
rents series over time for High Airbnb Areas (i.e., those in the top decile of the distribution
of Airbnb listings in 2016) versus the rest. In Panel (a) we graph rents, while in Panels (b)
and (c), we show the corresponding graphs for transaction prices (ITP) and posted prices
(Idealista), respectively. For completeness, in Panel (d), we plot Airbnb listings.
Figure 5: Evolution of rents and prices for High Airbnb Area vs. the rest
3
8
2.8
7.8
2.6
7.6
2.4
7.4
2007 2008 2009 2010 2011 2012 2013 2014 2015 2016 2017 2009 2010 2011 2012 2013 2014 2015 2016
High Airbnb Areas Rest High Airbnb Areas Rest
(a) ln(Rents) (b) ln(Prices)- ITP
250
8.6
200
8.4
150
8.2
100
8
50
7.8
0
2007 2008 2009 2010 2011 2012 2013 2014 2015 2016 2017 2007 2008 2009 2010 2011 2012 2013 2014 2015 2016 2017
High Airbnb Areas Rest High Airbnb Areas Rest
(c) ln(Prices)- Posted (d) Airbnb Count
Notes: Graph plots raw averages and the appropriate confidence intervals. High Airbnb Area are those in
the top decile of the Airbnb listings distribution in 2016.
The levels of both rents and prices tend to be higher in BSAs with more Airbnb
activity. More interestingly for our analysis, while the series for the period before 2012
15appear fairly parallel, the gaps in rents and prices seem to widen, coinciding with the
expansion of Airbnb in 2013 and onwards, especially for rents and transaction prices,
where the divergence is more noticeable. In the first three figures, the difference between
the two groups is statistically significant at the end of the period, while this is not the case
for the first years. Finally, in Panel (d), we report the evolution of the count of Airbnb
listings by group. It can be seen that while the number of listings increased drastically
for the High Airbnb Areas, the increase was very modest for the other BSAs, reflecting the
fact that Airbnb is highly concentrated in particular areas of the city.
These graphs are suggestive evidence that neighborhoods experiencing higher Airbnb
penetration experienced higher rents and prices growth with the arrival and expansion of
Airbnb. Nevertheless, since these series might be affected by other confounding factors
that could be biasing the results, we move to our main empirical strategies described in
Section 4.
5.2 Results for baseline specifications
In Table 3, we report our baseline results for the impact of Airbnb on rents (Panel
A) and prices (Panels B and C). As explained above, throughout the table, the dependent
variable is the average BSA-time period residual of a micro regression in which log rents
(or log prices) are regressed on housing characteristics and time dummies.
In column 1, we regress the outcome of interest against the number of Airbnb listings
while controlling only for time and BSA-fixed effects. Then, in column 2, we add BSA
time-varying demographic controls. Coefficients are positive and significant for both rents
and prices, which implies that an increase in the number of listings translates into an
increase in rents and prices. The effects on prices are larger than on rents, especially for
transaction prices (ITP). It is interesting to observe that the presence of contemporaneous
demographic controls has no large impact on the estimates for rents, while it slightly
decreases coefficients for prices, although not in a statistically significant way. Nevertheless,
we keep the demographic controls in subsequent specifications for the sake of completeness.
In column 3, we include differential demographic linear time trends by introducing
interactions between a linear time trend and the control variables measured in 2012, i.e.,
Xn,2012 × t. The coefficients for prices are somewhat reduced, while they remain fairly
constant for rents. In column 4, we report the results of specifications that fit BSA-specific
time trends as described in equation 5. These allow for both observable and unobservable
characteristics to impact neighborhood trends. Doing so increases the coefficient for rents
(though not significantly) and reduces the coefficients for prices, especially for posted prices
where the coefficient becomes nonsignificant. However, as mentioned before, one caveat of
this approach is that if Airbnb impacts rent and price trends rather than levels, the BSA
fixed effects will absorb part of the Airbnb effect on the outcomes.
In column 5, we repeat the analysis after detrending the data following the procedure
described in equations 6 and 7. In a first step, the pre-Airbnb data are used to estimate
BSA-specific time trends, which are then used to detrend all data points. Here, the coeffi-
cient for rents slightly decreases and gets closer to the specifications reported in columns 1
and 2. For prices, they both increase with respect to columns 3 and 4, and their magnitude
becomes more similar to each other.
Across the different specifications, the results indicate that higher Airbnb penetration
leads to increases in both rents and prices, with the effects on prices being larger than for
16Table 3: Impact of Airbnb on rents and prices - FE Model
Panel A: Rents
(1) (2) (3) (4) (5)
Airbnb Count (x100) 0.036*** 0.035*** 0.041*** 0.058*** 0.034*
(0.008) (0.009) (0.010) (0.020) (0.018)
Panel B: Transaction Prices (ITP)
(1) (2) (3) (4) (5)
Airbnb Count (x100) 0.118*** 0.097*** 0.080*** 0.065*** 0.084***
(0.021) (0.019) (0.021) (0.024) (0.026)
Panel C: Posted Prices (Idealista)
(1) (2) (3) (4) (5)
Airbnb Count (x100) 0.081*** 0.068*** 0.045*** 0.022 0.085***
(0.010) (0.009) (0.011) (0.019) (0.021)
Time FE X X X X X
BSA FE X X X X X
Dem Controls - X X X X
Time Trends - - Dem BSA -
Detrended - - - - X
Notes: Significance is indicated by * pincreases in transaction and posted prices of about 5.24% and 3.67%, respectively.
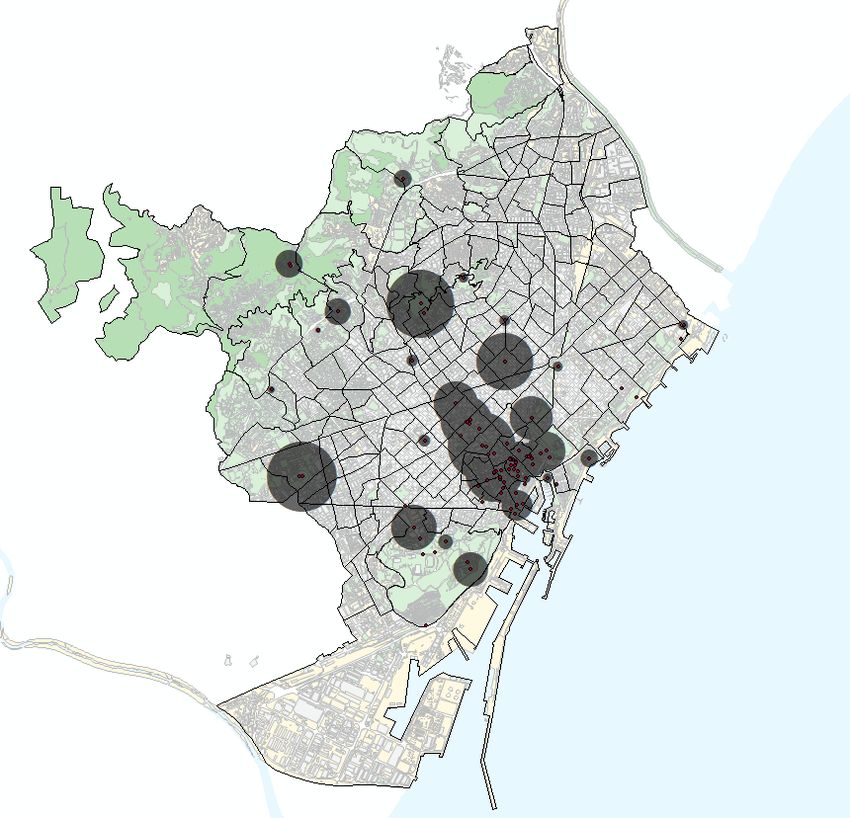
The large degree of heterogeneity in Airbnb activity across BSAs implies that Airbnb
has not affected all neighborhoods equally. In Figure 6, we illustrate these heterogeneous
impacts by plotting the result of multiplying the coefficients obtained in column 2 by the
Airbnb activity experienced by each BSA in 2016. While the implied effects are very
close to zero for the less central BSAs, our estimates imply some local impacts that are
substantial. For the High Airbnb Areas, Airbnb has increased rents, transaction prices and
posted prices by an average of 7%, 20% and 14%, respectively.
Figure 6: Implied effects of Airbnb across BSAs
(a) Impact on Rents (b) Impact on ITP Prices
(c) Impact on Posted Prices
Notes: These maps plot the implied impacts of Airbnb on rents and on transaction (posted) prices of the
results reported in column 2 of Table 3.
185.3 Robustness checks
In this section, we show that the results are robust to alternative measures of Airbnb
activity. In the last sensitivity test, we also show that our findings are not entirely driven
by neighborhoods in the historical city center (Ciutat Vella). The results are reported in
Table 4, and for the sake of comparability, in column 1, we reproduce the baseline results
(those in column 2 of Table 3).
Our measure of Airbnb activity reflects the contemporaneous activity of Airbnb.
That is, each ad or transaction is matched to the level of Airbnb activity of the quarter
in which the ad was active or the transaction took place. In column 2, we consider a
specification in which Airbnb activity is measured over a longer time window. Specifically,
each ad or transaction is matched to a moving average measure of Airbnb activity that
averages contemporaneous activity with that of the previous three quarters (Airbnb count
MA). The purpose of this measure is to take into account the seasonality of Airbnb. Then,
although the BSAs are relatively similar in terms of size, we compute a measure of Airbnb
density by dividing the number of listings over the total number of housing units (column
3). Then, in column 4, we take the log of the number of Airbnb listings to reproduce the
log-log specification used by Barron et al. (2018). The last row of Table 4 provides the
average of each of the alternative measures of Airbnb activity to ease comparability across
estimates.
Table 4: Impact of Airbnb on rents and prices: Robustness checks
Baseline AbnbCount MA AbnbDens log AbnbCount No CV
(1) (2) (3) (4) (5)
Panel A: Rents
Airbnb 0.035*** 0.029*** 0.0068 0.0098*** 0.053***
(0.009) (0.008) (0.005) (0.003) (0.010)
Panel B: Transaction Prices (ITP)
Airbnb 0.097*** 0.107*** 0.039*** 0.034*** 0.093***
(0.019) (0.023) (0.005) (0.006) (0.025)
Panel C: Posted Prices
Airbnb 0.068*** 0.070*** 0.019*** 0.017*** 0.096***
(0.009) (0.010) (0.004) (0.004) (0.025)
Time FE X X X X X
BSA FE X X X X X
Dem Controls X X X X X
Mean 4Q2016 56 49 1.57% 1.76 43
Notes: Significance is indicated by * pOverall, our findings are robust to using alternative measures of Airbnb activity.
Interestingly, and despite the underlying differences between the two studies, our results
(reported in column 4) are similar in magnitude to those found by Barron et al. (2018) for
the US. They find that a 1% increase in Airbnb listings increases housing rents and prices
by 0.018% and 0.026%, respectively. Our estimates are a bit lower for rents (0.0098), while
Barron et al. (2018)’s estimate for housing prices is in between our estimates for posted
prices (0.017) and transaction prices (0.034). Finally, in column 5, we drop all BSAs from
Ciutat Vella. The results indicate that our findings are not driven by some specific BSAs
in the city center with very extreme levels of Airbnb activity.
5.4 Mechanisms
As we have shown above, Airbnb in Barcelona is mostly a commercial activity. Hence,
as the model in Section 2 clarifies, the main mechanism behind the increase in rents and
housing prices is most likely a reduction in the supply of long-term rentals. To provide
direct evidence of this mechanism, one would ideally look at the number of units rented to
residents. Since these data are not available, we examine instead the number of households,
which includes both owner and renter households.21
In Table 5, we report the results of running specifications 1 to 4 of Table 3. The
outcome is the log of the number of households. The results indicate that Airbnb listings
have a negative and strongly significant effect across all four specifications. If we focus on
column 2, the estimates imply that 100 Airbnb listings decrease the number of households
by 2.8%. Given that the average number of households is 2850, 100 Airbnb listings would
reduce the number of households by 80. Thus, these results support the supply reduction
of long-term rentals as the mechanism at work. The results of Table 5 also lend credibility
to the hypothesis that the increases in housing rents and prices that we estimate are caused
by Airbnb activity and not by ongoing processes of gentrification. If the effects that we
estimate were driven by processes of gentrification or urban revival, we should observe an
increase (and not a reduction) in the number of households in the neighborhood.
Table 5: Impact of Airbnb on the number of households
Outcome: log(Households)
(1) (2) (3) (4)
Airbnb Count (x100) -0.018*** -0.028*** -0.016*** -0.010***
(0.005) (0.006) (0.005) (0.004)
Time FE X X X X
BSA FE X X X X
Dem Controls - X X X
Time Trends - - Dem BSA
Notes: Significance is indicated by * p6 Results for alternative empirical strategies
6.1 Instrumental Variable results
In Table 6, we report both the first- and the second-stage results of the instrumental
variable approach described in Section 4.2. Columns 2, 4 and 6 report the second-stage
results for rents, transaction prices and posted prices, respectively. The specification cor-
responds to that of equation 4, where Airbnb activity is instrumented with the interaction
between the cross-sectional tourist amenities index (equation 8) and the Google Trend
searches for ‘Airbnb Barcelona’. In terms of control variables, the specification corre-
sponds to column 2 in Table 3. Columns 1, 3 and 5 report the first-stage coefficients. The
F-test of excluded instruments is much larger than 10, which is the standard rule of thumb
accepted by practitioners (Angrist and Pischke, 2008). Hence, the instrument is not weak
and predicts well when and where Airbnb listings appear. Moving to the second-stage
results, the coefficients remain positive and statistically significant at the 1% significance
level. In terms of magnitude, they are remarkably similar to their OLS counterparts of
column 2 in Table 3, although admittedly the estimated coefficient for transaction prices
is larger (although not in a statistically significant sense).
Table 6: Impact of Airbnb on rents and prices: Instrumental variable estimates
Rents Sales ITP Posted Prices
(1) (2) (3) (4) (5) (6)
Airbnb Ln(Rent) Airbnb Ln(Prices) Airbnb Ln(Prices)
Airbnb 0.022*** 0.158*** 0.074***
Count (x100) (0.011) (0.024) (0.014)
TouristAmenities 0.005*** 0.004*** 0.005***
*GoogleTrends (0.000) (0.000) (0.000)
N 2.138 2.138 7.018 7.018 2.247 2.247
Time FE X X X X X X
BSA FE X X X X X X
Dem Controls X X X X X X
F-stat 191.80 158.70 158.61
Notes: Significance is indicated by * pYou can also read