IEP PLANNING REPORT WORKSHOP - Overview of Universal Energy Access Strategy - Department Of Energy
←
→
Page content transcription
If your browser does not render page correctly, please read the page content below
IEP PLANNING REPORT
        WORKSHOP
Overview of Universal Energy
      Access Strategy

                           1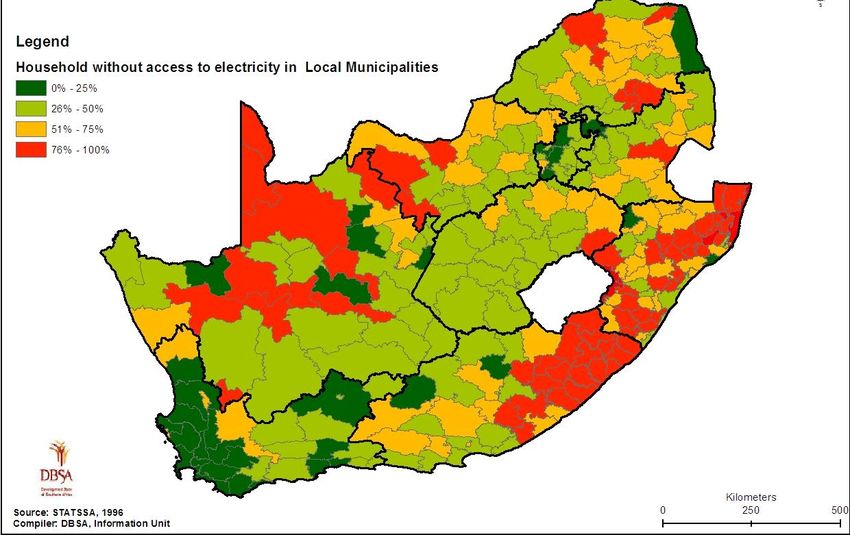
Background
• After 1994 and through the Government’s initiative of RDP
  (Reconstruction and Development         Programme) the
  electrification programme was endorsed.
• In the period 1991 – 2001 electrification was an electricity
  industry funded programme.
• During 2001 Government took responsibility for funding
  and managing the electrification programme, via funds
  made available from National Treasury – as a result of the
  White Paper on Energy Policy (1998).
• Resulted in the establishment of Integrated National
  Electrification Planning (INEP) unit within the Department
  of Energy.

                                                            2
Funding process             Eskom
                                    - Connections
                                    - Infrastructure
                       Grid
                  Electrification
                                     Municipalities
                                    - Connections
                                    - Infrastructure

   Fiscal
                                    Concessionaires
                    Non Grid
Donor (Kfw)       Electrification
                                     Municipalities
                                    - Limited projects

                                                         3
Electrification progress
• Over 5.7 million households were
connected to the grid between 1994 Electrified
and 2013/14. Houses:
Province
Municipalities
• In period 2002 to 2013/14 - 65 929 & Eskom
households were supplied with non-
Eastern Cape 1 023 492
grid technology (Solar panels –
Free State 363 711
Renewable Energy)
Gauteng 677 133
• Eastern Cape - 12,282 KwaZulu Natal 935 011
• Kwazulu Natal - 44,266 Limpopo 991 602
Mpumalanga 545 809
• Limpopo - 9,381
Northern Cape 133 770
• Non-grid electrification programmes
North West 659 868
will in future not only be implemented
Western Cape 387 576
in concessionary areas, but in a limited
basis in other areas in country. Total 5 732 777
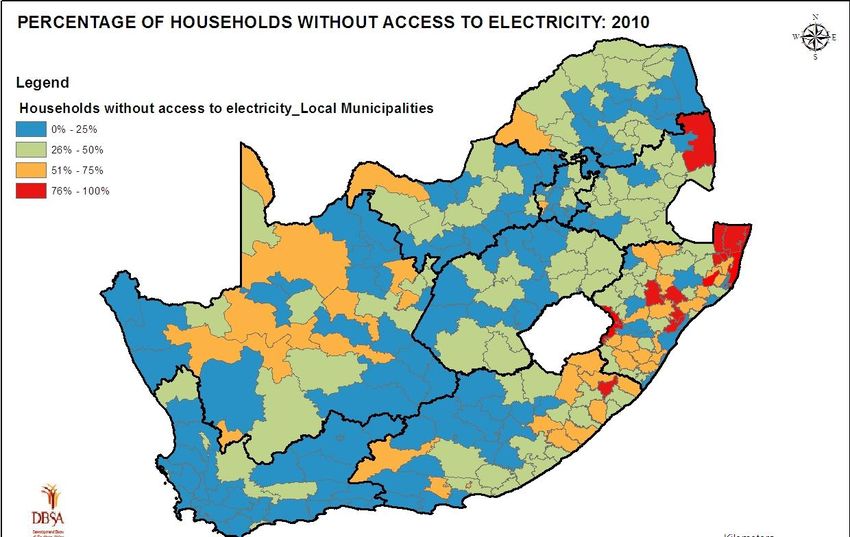
4Access - 1996
Access - 2012
5Universal access background
Western Cape
Northern Cape 5%
1.5% Eastern Cape
North West 5.5 % 20%
Mpumalanga
6.5%
Free State 6 %
Limpopo 10.5 %
Gauteng 21%
KwaZulu Natal
24%
• Households without electricity: ~3.2 million (Informal 1.2 mil and formal
2 mil)
• 75 % in Eskom supply area and 25% in municipalities supply area.
6INEP PERFORMANCE (12/13)
Connection
Connection
MTEF s INEP Total
Entity s Own
Allocations (including Connections
funding
roll-overs)
Eskom (bn) R 1,879 368 121 041 21 831 142 872
Municis (bn) R 1,151 443 50 620 50 620
Non-grid (mil) R 86 400 9 343 9 343
Total R 3,117,211 181 004 21 831 202 835
Target of 180 000 was exceeded
Improved efficiencies as a result of being more involved in the
operational activities of implementers.
7Universal access background
• INEP established in 2001/02 - address backlogs of households in
line with Energy White Paper (1998) recommendations.
• Newly built households to be electrified by the restructured
Electricity Distribution Industry (EDI) - due to serious
inefficiencies in the EDI over the last 10 years, INEP had to
address not only backlogs, but also newly built houses and
informal households.
• Not only connections had to be funded, but also ‘back bone’
network infrastructure.
• In addition to the above challenges, escalating electrification
costs and limited funding, as well as the high growth rate of
houses (formal and informal), resulted in a serious thread to
reach universal access in the country.
• Despite its successes to date, the electrification programme will
fall short in meeting its target of electrifying 92% of formal
households by 2014, as defined as backlogs in 2001/02.
8Universal access background (cont.)
• If universal access to electricity by 2014 is not practical, what is
the most effective and realistic timeframe to reach universal
access, given the various challenges in the electricity industry,
raising cost of electrification, etc.?
• Hence a new approach to electrification is required - New
Electrification Roadmap (Implementation plan) for South Africa
was developed.
• In 2011 DoE started with a new initiative where all the relevant
stakeholders were invited to participate and agreed on the need
for a new Electrification Roadmap.
• To improve the rate of electrification the following basic elements
are required:
– Work from a common implementation plan
– Improve the efficiency of implementers
– Additional funding
– Utilizing different technologies to define access to energy
9Using these rules, it is expected to deploy around 300,000
solar home systems and reach universal access for formal
households in 2025
South Africa Provincial non-grid potential
Total connections Thousand households
2013 – 2025
37
Million households
4 26
Non-grid 10% 0.3 16
84
11
28
Grid 90% 3.1 73
19
Time to electrify formal The highest potential for Non-grid
households 20251 is in KZN and Eastern Cape
1 Assumes existing INEP annual funding and DoHS contribution of R2,000
per household for new RDP houses (40,000 houses per annum); assumes
total of 50,000 new formal households per year from DoHS formalization
10 processUniversal Access is function of Electrification
Technology options and funding
+R2 billion 2027 2017 2018 2017
2019
Additional funding per year
+R1 billion
2031 2020 2022 2023 2021
(base case)
Base case
2037 2023 2030 2026
2028
Option 1 Option 3 Option 4 Option 5
All grid Option 2 (base case) Option 3, but Option 3, grid
Most cost efficient Option 2, but grid replaces connection for
technology Option non-grid within mini-grids informal
3km households
100 70 90 87 78
Technology mix
% of current un-electrified formal
households to be connected to the grid
11New Households Electrification Strategy
The Cabinet Approved (26 June 2013) the implementing of the new Household Electrification
Strategy based on the following focus areas:
a) The defining of universal access as 97% of households, as full electrification is unlikely to
be possible due to growth and delays in the process of formalising informal settlements;
b) The electrification of about 90% of households through grid connection and the rest with
high-quality non-grid solar home systems or other possible technologies based on cost
effective options in order to address current and future backlogs;
c) The development of a master plan to increase efficiency in planning and the delivery
process to ensure more connections, including a workshop on the Plan to which all
members of Cabinet would be invited to; and
The consideration of the proposed delivery targets, taking into consideration views with regard
to-
i. the proposed change to the delivery dates for universal access from 2014 to 2025
ii. the concern that the new proposed target of 250 000 households will contribute to
the backlog with regard to the targets set by the Presidential Infrastructure
Coordinating Commission (PICC); and
iii. funding provided by the National Treasury to speed up connections
12INEP: MTEF Allocations
MTEF 2013/14 MTEF 2014/15 MTEF 2015/16 MTEF 2016/17
VOTED FUNDS
R’000 R’000 R’000 R’000
MUNICIPALITIES 1 314 772 1 564 658 2 056 090 2 165 063
ESKOM 2 141 027 2 470 024 3 661 039 3 852 775
NON - GRID 91 150 96 621 101 067 106 424
BASELINE
ALLOCATION
3 546 949 4 131 303 5 818 196 6 124 262
13Households electrified in South Africa
• 2011 Census: ±12,24 mil households out of ± 14,45 mil households are utilizing
electricity as a lighting source; ± 85% of households have access to electricity for
lighting purposes.
• Different types of households included into the total household figure (built on
the same stand as the formal household):
• Houses/flats/rooms in backyard 423 000
• Informal dwellings in backyards (shacks in backyard) 713 000
• Room/flatlet on a property or larger
dwelling/servants quarters/granny flat 120 000
Total 1,256 000
• Majority of these households (about 90% ) are not metered, estimated to be
± 1 mil .
• Network designs were not done to accommodate these additional households,
hence will have to be upgraded.
• These households also do not qualify for inclining block tariff and FBE.
• About 2.2 mil households according to Census 2011 stats are without electricity,
if the about 1,1 mil households that are not metered are been added, total
figure of about 3,2 mil.
• In line with the INEP stats for households that are not formally electrified
(metered), hence ±77% households have a metered supply.
14Electrification observations
Following observations regarding electrification projects:
• Electrification is not only an electricity industry challenge – it
is a social challenge;
• Every new research/technology break-through will
automatically result in resolving electrification mass roll-out
implementation problems – challenge not technology but
whole value chain of electricity industry need to functioning
in harmony;
• Pilot projects will solve electrification problems - very few
pilot projects are successful;
• Electrification does not make commercial sense – at the
most it can be a break even venture:
• Recover connection costs via tariffs - consumption levels of
rural costumers so low that it is impossible to recover capital
and operations cost from the tariffs alone;
• In most instances not even possible to recover operation
costs to supply a rural customer;
15Electrification observations (cont..)
Following observations regarding electrification projects
(continue):
• Metering technology can solve financial viability of
electrification projects – non of the current metering solution
(pre-paid meters, smart meters etc) can fulfil such a roll;
• Renewable energy technology systems requires no
maintenance – need service providers and community
responsible to take ownership of asset.
16Way forward
If universal access to electricity is to be reach by 2025, the following
is needed:
• Adequate funding for capital projects, management of INEP programme,
skills transfer/Training
• Implementation in line with the Master Plan,
• Need to solve the serious challenges in the EDI - difficult to run an
electrification programme where networks requires serious upgrading,
• To solve some serious network constrains – can’t roll out connections in
some parts of KZN and EC where there are large backlogs,
• More political support for non-grid technologies,
• Good co-operation between National Government and other spheres of
government,
• Resources wrt municipalities to be improved, political intervention, long
procurement processes, lack of responsibility and accountability, lack of
reporting,
• DOE is 100% committed to the tasked of universal access by 2025.
– Every 70 sec of a workable day in 2012 a new connection was made,
– In 2013 we want to decrease it to every 60 sec that a new connection
is made.
17Thank you
1819
Electrification Master plan
Grid and Non – Grid Opportunities

• Least cost approach (benchmark)
   • cost per connection R12000 – Urban
   • cost per connection R17000 – Rural

• Critically analysing major infrastructure need/initiatives (PICC
  and SIP)

• Generation Capacity vs available network capacity – time
  frames to electrify outstanding households.

                                                                 20
Census 2011 figures on main source of
energy for lighting vs current situation
% Access
ESKOM Munic Total
% Access Project Houses per
Households Houses electrified Backlog Connections Connections House- Houses
PROVINCE per Households without Province
2011 Census Census 2011 Census 2011 (Oct 2011-June (Oct 2011-June holds electrified
Province with growth Electricity (Using
2013) 2013) connected
Avarage %)
EASTERN CAPE 1 687 385 1 265 759 421 626 75.01% 1 721 133 40029 9701 49730 405 644 1 315 489 76.43%
FREE STATE 823 316 740 500 82 816 89.94% 839 782 6118 6771 12889 86 393 753 389 89.71%
GAUTENG 3 909 022 3 416 360 492 662 87.40% 3 987 202 26470 11979 38449 532 393 3 454 809 86.65%
KWAZULU NATAL 2 539 429 1 977 257 562 172 77.86% 2 590 218 43603 17307 60910 552 051 2 038 167 78.69%
MPUMALANGA 1 075 488 929 372 146 116 86.41% 1 096 998 23729 10798 34527 133 099 963 899 87.87%
NORTHERN CAPE 301 405 257 255 44 150 85.35% 307 433 5757 3533 9290 40 888 266 545 86.70%
LIMPOPO 1 418 102 1 237 495 180 607 87.26% 1 446 464 47590 19489 67079 141 890 1 304 574 90.19%
NORTH WEST 1 062 015 892 424 169 591 84.03% 1 083 255 21718 6243 27961 162 870 920 385 84.96%
WESTERN CAPE 1 634 000 1 525 980 108 020 93.39% 1 666 680 19466 8721 28187 112 513 1 554 167 93.25%
TOTAL 14 450 162 12 242 402 2 207 760 84.72% 14 739 165 234 480 94 542 329 022 2 167 741 12 571 424 86.05%
Census 2011 Figures DoE connections from October 2011 to June 2013
21You can also read