Impact of Unreliable Content on Social Media Users during COVID-19 and Stance Detection System - MDPI
←
→
Page content transcription
If your browser does not render page correctly, please read the page content below
electronics
Article
Impact of Unreliable Content on Social Media Users during
COVID-19 and Stance Detection System
Mudasir Ahmad Wani * , Nancy Agarwal * and Patrick Bours

                                                Department of Information Security and Communication Technology, Norwegian University of Science and
                                                Technology (NTNU), 2815 Gjøvik, Norway; patrick.bours@ntnu.no
                                                * Correspondence: mudasir.a.wani@ntnu.no (M.A.W.); nancy.agarwal@ntnu.no (N.A.)

                                                Abstract: The abundant dissemination of misinformation regarding coronavirus disease 2019 (COVID-
                                                19) presents another unprecedented issue to the world, along with the health crisis. Online social
                                                network (OSN) platforms intensify this problem by allowing their users to easily distort and fabri-
                                                cate the information and disseminate it farther and rapidly. In this paper, we study the impact of
                                                misinformation associated with a religious inflection on the psychology and behavior of the OSN
                                                users. The article presents a detailed study to understand the reaction of social media users when
                                                exposed to unverified content related to the Islamic community during the COVID-19 lockdown
                                                period in India. The analysis was carried out on Twitter users where the data were collected using
                                                three scraping packages, Tweepy, Selenium, and Beautiful Soup, to cover more users affected by this
                                                misinformation. A labeled dataset is prepared where each tweet is assigned one of the four reaction
                                                polarities, namely, E (endorse), D (deny), Q (question), and N (neutral). Analysis of collected data
                                                was carried out in five phases where we investigate the engagement of E, D, Q, and N users, tone
                                                of the tweets, and the consequence upon repeated exposure of such information. The evidence
                                                demonstrates that the circulation of such content during the pandemic and lockdown phase had
                                                made people more vulnerable in perceiving the unreliable tweets as fact. It was also observed
                                      that people absorbed the negativity of the online content, which induced a feeling of hatred, anger,
                                         distress, and fear among them. People with similar mindset form online groups and express their
Citation: Wani, M.A.; Agarwal, N.;              negative attitude to other groups based on their opinions, indicating the strong signals of social
Bours, P. Impact of Unreliable Content          unrest and public tensions in society. The paper also presents a deep learning-based stance detection
on Social Media Users during                    model as one of the automated mechanisms for tracking the news on Twitter as being potentially
COVID-19 and Stance Detection                   false. Stance classifier aims to predict the attitude of a tweet towards a news headline and thereby
System. Electronics 2021, 10, 5.                assists in determining the veracity of news by monitoring the distribution of different reactions of the
https://dx.doi.org/10.3390/
                                                users towards it. The proposed model, employing deep learning (convolutional neural network (CNN))
electronics10010005
                                                and sentence embedding (bidirectional encoder representations from transformers (BERT)) techniques,
                                                outperforms the existing systems. The performance is evaluated on the benchmark SemEval stance
Received: 31 October 2020
                                                dataset. Furthermore, a newly annotated dataset is prepared and released with this study to help the
Accepted: 11 December 2020
Published: 23 December 2020
                                                research of this domain.

Publisher’s Note: MDPI stays neu-               Keywords: COVID-19; unverified news; Twitter; data analysis; data collection; user behavior; BERT;
tral with regard to jurisdictional claims       CNN; stance detection
in published maps and institutional
affiliations.

                                                1. Introduction
                                                     The year 2020 is marked by one of the major public health threats and emergency
Copyright: © 2020 by the authors. Li-
                                                which the whole world witnessed due to outbreak of the coronavirus disease 2019 (COVID-
censee MDPI, Basel, Switzerland. This
                                                19) infection [1]. In the face of coronavirus pandemic, social lockdown is imposed across
article is an open access article distributed
under the terms and conditions of the
                                                the globe where people are strictly asked to stay home for more than a month to slow
Creative Commons Attribution (CC BY)
                                                down the spread of infection. The isolation aspects of the lockdown period have led to
license (https://creativecommons.org/           overwhelming growth in the user activities on social media platforms such as Twitter and
licenses/by/4.0/).                              Facebook, as they have allowed people to remain connected and updated about the current

Electronics 2021, 10, 5. https://doi.org/10.3390/electronics10010005                                         https://www.mdpi.com/journal/electronics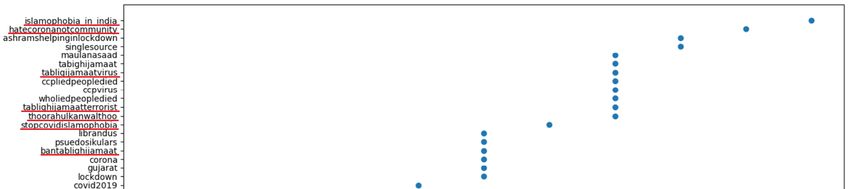
Electronics 2021, 10, 5                                                                                            2 of 21

                          status of the disease [2]. However, heavy usage of these networking sites has also caused
                          the massive circulation of COVID-19 related misinformation such as false cures, bogus
                          medical advice, the origin of the virus, 5G conspiracy, etc. [3,4] at an alarming rate.
                               Misinformation can be of several types: (1) it can be completely inaccurate, (2) it can
                          be a belief disseminated without any authentic proof, or (3) it can carry biased information
                          where selective facts are shared to achieve some mischief propaganda [5–7]. The study [8]
                          pointed out that unreliable content on social media spread way faster than fact-based
                          content. It has been noticed that the truthfulness of content is not a motivational aspect for
                          forwarding the information; rather, people tend to share the news based on their favoritism,
                          biasedness, or gaining attention in the community. Earlier studies have observed that
                          in real life, the dissemination of unreliable content on social media impacts significantly
                          on political campaigning [9,10], terrorism [11], natural disaster management [12]. This
                          article conducts the study to explore the influence of the propagation of religion-based
                          toxic misinformation on the psychology and behavior of social media users in causing
                          unrest and communal violence. It is seen that the rumors having some religious inflection
                          are potentially strong in creating severe chaos and dividing society [13]. Social media like
                          Twitter can ignite its consequences on the psychology of the society as these platforms
                          are well known for rapidly communicating fabricated and distorted information, which
                          usually carries the news based on the views and emotions of the users rather than the facts.
                               This paper analyses the diffusion of religion-based unverified news on Twitter during
                          the COVID-19 panic to investigate how it affected the mental state and behavior of the
                          users in triggering communal unrest. A similar study is conducted by the authors [5] that
                          conducts an offline survey in politically unstable and conflicting areas to show how easily
                          a rumor can amplify the instability and violence in the society. In this paper, we conducted
                          a digital survey to investigate the behavior of people regarding a religious-based event, i.e.,
                          Tablighi Jamaat (an Islamic sect) that took the turn of communal violence mainly because
                          of the COVID-19 crisis and the spreading of unverified facts. COVID-19 pandemic has
                          been observed as the source of the surge of various fake and unverified content, mostly
                          regarding the cause of the outbreak of the disease, and ironically, people are highly noticed
                          as believing such information [14]. This paper explores the reactions of Twitter users
                          towards the Tablighi Jamaat (TJ) event that happened in mid-March 2020 in Delhi (the
                          capital of India country) and became the most debatable topic if it is responsible for the
                          outbreak of coronavirus infection in the country [15].
                               Around 8000 people, including foreigners, are claimed as the attendees of the TJ event.
                          The event caught attention when later on, many attendees were tested as coronavirus-
                          positive, and various non-attendees who picked up the COVID virus were somehow
                          found in link with attendees. Many people associated this event with the whole Muslim
                          community, calling it a conspiracy and blaming the community for the spread of the
                          disease [15]. In a verdict, the Bombay High Court of India slammed the electronic media
                          for being part of big political propaganda that attempts to create the image that TJ members
                          are the cause of the outbreak of coronavirus infection in India [16]. However, although
                          the claim that TJ (i.e., Tablighi Jamaat) event is the main cause for the spread of the virus
                          has not been proven yet [17], it had sufficient potential to contribute to the instability and
                          communal violence in the society.
                               In this paper, we observed the usage of the Twitter networking site by its users towards
                          the mentioned event and see if it has contributed to the instigation of violence, hate, anger,
                          and division among people. To obtain the TJ event-based tweets, data were collected
                          in three iterations by using three packages, namely, Tweepy (https://www.tweepy.org/),
                          Selenium (https://selenium-python.readthedocs.io/), and Beautiful Sou (https://pypi.org/
                          project/beautifulsoup4/). Afterward, an annotated dataset was created by determining
                          the stance of the tweets with respect to the claim that the TJ event was responsible for
                          the spread of coronavirus in the country. The stance represents the opinion or a stand
                          of a person about something. For news, there could be four types of reaction/stance,
                          namely, endorse (E), deny (D), question (Q), or neutral (N). Therefore, each tweet in the
Electronics 2021, 10, 5 3 of 21
dataset was labeled into one of the four reaction polarities, E (tweet that supports the claim
that the event was responsible for causing coronavirus outbreak in India), D (tweet that
outrightly denies the claim), Q (tweet that questions for figures-based facts) and N (tweet
that shares the facts regarding the claim). Afterward, a deep analysis was conducted on the
corpus to gain a thorough understanding of the attitude of different user groups regarding
the misinformation. The article also presents the hashtags-based clustering of tweets for
detecting echo chambers in the network. Earlier studies have mentioned the phenomenon
of the formation of echo chambers on social media where people tend to communicate
mostly with similar-minded users [18]. The problem with these echo chambers is that they
can enhance the trust factor of a user on an unauthenticated piece of information by getting
repeated affirmations from people with a similar belief system and can make a discussion
more radicalized and polarized.
Furthermore, the article also presents a stance detection system to combat the problem
of fake news on the social network. Stance classification aims to determine whether the
author of the text stands in favor or against a news title [7]. Stance detection has been
considered a vital task for solving many problems, including fake news detection [19–21].
The study [22] shows that the tweets spreading rumors propagate differently than the
news spreading truth as the former content is mostly questioned or denied. Therefore,
monitoring the orientation of the users to the news is one of the crucial steps for determining
the veracity of the news. At present, there are numerous fact-checking organizations
where people are continuously investigating the veracity of news articles to make an
informed judgment of their potential of being fake. A reasonable approach for checking
the truthfulness of the claim is performed by retrieving the related content of the news
under scrutiny from different sources such as social media, determine the stance of the
retrieved documents, perform the stance analysis, and finally, make a prediction. However,
the manual process is very time-consuming, complex, and does not scale well. Therefore,
automatic detection of the stance of the posts/tweets shared with respect to the news
would assist the fact checker in effectively evaluating the distribution of different opinions
and flagging the news article as suspicious upon encountering a large number of countered
reactions.
In this paper, we present a deep learning-based classifier that identifies the stance of
the tweet of a claim. The work utilizes the dataset provided by Sem-Eval 2016 competition
for the stance detection task [23]. Earlier works have majorly focused on word embedding
techniques such as word2vec [24] for representing the text for the deep learning classi-
fier [25]. On the contrary, the proposed model employs sentence embedding to convert the
tweet text into a vector. Moreover, instead of designing the classifier from scratch, transfer
learning has been adopted where we use the pre-trained bidirectional encoder represen-
tations from transformers (BERT) [26] to obtain the sentence embeddings vector. BERT
is a powerful deep learning-based language representation model proposed by Google
in late 2018 for natural language processing (NLP). On top of BERT-based features, four
supervised learning algorithms, namely, support vector machine (SVM), random forest,
neural network, and convolutional neural network (CNN), are employed for designing the
respective four stance detectors bert-svm, bert-rf, bert-nn, and bert-cnn. The performances
of the models are compared with the score of top-ranked teams that participated in the
Sem-Eval 2016 competition. It is observed that the bert-cnn outperformed the baseline
systems. Furthermore, we demonstrate that the annotated Tablighi Jamaat dataset prepared
in this work has the potential to enhance the efficiency of stance classification, and thereby,
can be utilized by the concerned researchers in their studies.
The main contributions of the paper are as follows:
• A three-step data collection procedure is presented using three APIs, Tweepy, Sele-
nium, and Beautiful Soup. Each API is associated with certain limitations in scrapping,
which are discussed in the paper. The cooperative use of these APIs in data collection
helped to overcome the limitations of one another, and therefore, assisted in extracting
a wide range of TJ event-based tweets effectively;Electronics 2021, 10, 5 4 of 21
• Designed a stance-based annotated dataset where the reactions of users towards the
unverified claim are classified into four classes, i.e., E, D, Q, and N. The dataset can be
made available to the researchers for further study;
• Polarity-based text filtering is implemented for extracting the desired text from the
collected tweets;
• There are a total of 5 phases of analysis that attempt to explore the tweeting pattern
of E, D, Q, and N user classes, the kind of language used by them, and the change
in their language when they are repeatedly exposed to the harmful unauthenticated
content;
• Hashtags-based clustering is performed to identify the echo chambers in the network;
• A deep learning-based stance classifier has been proposed that would assist in tracking
the misinformation on social media. The results show that the proposed model
outperforms the existing systems;
• Demonstrate the usefulness of the prepared annotated dataset in stance classification.
Furthermore, the key findings of the analysis are as follows:
• Circulation of information initially started with neutral news containing facts and
figures, which later on turned into incredible information due to the misinterpretation
by the users;
• The sharing of distorted and incomplete content regarding the TJ event led to the
constant arguments between the two user groups (E and Q), reflecting the signs
of social unrest. It is to be noted that both the groups are opposing each other on
unverified information;
• The language of E users was more of an attacking mode treating the TJ attendees as
criminals and super-spreaders of infection, whereas D users were found using more
defensive terms, mostly asking the people to stop spreading hate in the community;
• Interestingly, the terms which were found common in the language of E and D users
were primarily educative, providing the information of the event itself, such as its
timing and location;
• User language was getting more violent and communal over time. The evidence
indicates that the repeated exposure of the rumor over a period can worsen the effect
on the cognitive ability of the individuals by imbibing continuous distress and anger
in them;
• The analysis also revealed the presence of echo chambers where similar mindset users
were observed forming clusters based on their language.
The paper is structured as follows: Section 2 provides the background of the TJ event.
Section 3 highlights the related existing studies. The three-step data collection procedure
is described in Section 4. Section 5 provides the details of designing the reaction-based
labeled dataset. The five phases of data analysis are given in Section 6. Section 7 discusses
the findings of the study. In Section 8, the methodology for designing the stance classifier
has been presented. Section 9 describes the experiments and results of stance detection.
Finally, Section 10 concludes the overall work around the spread of misinformation and
stance detection system to combat the problem of fake news on social networks.
2. Background of Tablighi Jamaat (TJ) Event
Almost every country implemented the lockdown to control the COVID-19 pandemic.
The Government of Delhi state of India also announced the ban on the gathering of more
than 200 people on 13 March 2020, which was further strengthened on 16 March 2020 with
the limit of 50 people. The Tablighi Jamaat (TJ) event was held on March 13–15 in Delhi
(capital state of India). It was claimed that over 8000 people were present in the event,
majorly belonging to the Islamic community, from several states of India along with over
1000 foreigners. The event came under focus after a week later when many attendees or
non-attendees somehow linked with the TJ event were tested COVID-19 positive across
the different states of the country.Electronics 2021, 10, 5 5 of 21
On 31 March, the Union health ministry of India claimed that 30% of COVID positive
cases in Delhi were found in linking with the Tablighi Jamaat incident. On 2 April, another
news surfaced which said that this incident caused a doubling of coronavirus-infected
cases. This news took a significant turn on social media, where users were increasingly
calling its members responsible for the spreading of coronavirus across India. However,
later on, 13 April, a piece of news [17] published which reported that according to a group
of Indian scientists, there is no evidential data that concludes that the Tablighi Jamaat
convention is the primary reason for the continuous growth of the COVID-19-infected
Indian citizens. Wikipedia (a great source of information) also witnessed the confusion
regarding the claim when the article portraying Tablighi Jamaat as a hotspot of spreading
coronavirus was deleted on account of lack of numeral census [27]. However, the page
was restored after a couple of days with some modifications [28]. Finally, on 22 August,
the Bombay High Court of India slams both media and electronic media for being part
of political propaganda against Tablighi foreigners that aimed to manipulate the society
into believing that they have spread the coronavirus in India and portray their picture as
criminal [16].
3. Related Work
In this section, we briefly discuss the contribution of social media data analysis in
solving various research problems and state-of-the-art stance detection.
3.1. Social Media Data Analysis
The extensive usage of social media platforms has produced a massive amount of data
that contains information about different dimensions of people’s lives, be it professional,
personal, and social. This enormous data offers the researchers a valuable resource for
understanding the various aspects of human behavior such as mental state [29], insecu-
rities [30], opinions or sentiments [31], the kind of response to be expected in the wake
of panic events [32], criminal psychology [33], etc. In the study [30], an investigation is
carried out on Instagram media to observe the reaction of men towards body satisfaction
and physical appearance comparison. In [34], the authors explored the posting behavior of
Twitter users to understand the factors that motivate a user to publish content on social
media. The study [29] show that the people living in a politically non-stable environment
are emotionally degraded and represent a different mental state than the people living
in stable areas in terms of expressing more fear, anxiety, and negativity in their Facebook
posts. Since understanding and modeling human response behavior can assist the adminis-
tration in dealing with adverse conditions such as natural disasters, in the study [32], the
authors analyzed the tweets during the 2010–2011 floods crisis in Australia to identify the
active user communities and their role in disseminating critical information. Social media
data can also be utilized by researchers to study the psychology of criminals and curb
cybercrimes. For instance, the study [33] explored the emotions expressed in the content
published by real and fake profiles to design the fake profile detection system.
3.2. Social Media and Misinformation Analysis
In this paper, we explore the reaction of Twitter users towards the circulation of
unverified information that can amplify communal violence in society. Some existing
research studies tend to investigate the impact of the spreading of misinformation on
the people. For example, the study [35] shows that once a person has drawn the wrong
image due to the consumption of false information, its effect cannot be easily undone
even after presenting the facts. The results point out that initial social impressions have a
long-lasting effect even if these impressions are based on some false news. The study also
shows that individuals with relatively lower cognitive skills are more prone to the effects
of false content. The study [36] discussed a case study where a false rumor regarding
the kidnapping of children from a school was disseminated like a wildfire on Twitter. In
addition, it is observed that the news created massive chaos and traffic jams in a coupleElectronics 2021, 10, 5 6 of 21
of minutes out of panic as the parents rushed to collect their children from the school.
The proliferation of fake news has been seen as strongly correlated with the occurrence
of real-time events such as natural disasters, election campaigning, etc. For example, the
paper [11] analyzed the quality of the tweets shared during the social crisis and revealed
various factors like anxiety and source ambiguity, which can lead to the massive overload
of rumors on social media during the period. The paper [37] demonstrates that user
interaction with unreliable content on social media increases sharply during the election.
The spike in rumors has also been related to the areas which are considered to be conflicted
and politically unstable. The authors [5] surveyed two insurgency-affected areas and
claimed that distrust and threat perceptions in these areas increase the odds of unverified
information being perceived as true among people. The studies [9,10] show how the
spreader of fake news on social media influenced the outcome of the US 2016 presidential
election. In this paper, we seek to determine the impact of religion-based misinformation
on the behavior of twitters during the COVID-19 pandemic.
3.3. Stance Detection
Stance detection has many application areas in the domain of NLP [25]. For instance,
automatic stance detection can replace the traditional opinion surveys that are carried out
to determine if a community stands in favor or against an ideology [38]. Stance detection
is also proven useful in designing recommendation and market forecasting system [25].
Most importantly, it has gained significant importance in the field of rumor and fake
news detection. The authors have shown the stance detector as the core component for
monitoring the rumors on social media [19]. Similarly, fake news challenge 2017 [20] has
also included stance detection as a vital subtask in determining whether a given piece of the
news article is fake or real. Existing studies have employed feature-based machine learning
(e.g., SVM [39], logistic regression [39], etc.), and deep learning techniques (e.g., Recurrent
neural network [40,41], convolutional neural network [42], etc.) for predicting the stance of
a text. The machine learning models are mostly trained on features based on bag-of-words,
Tf-IDF, POS tags, sentiments, etc. There are a few studies that utilized word embedding
vectors also with the help of pre-trained word2vec and GloVe models [43]. However,
deep learning techniques have majorly relied on word embedding representations of a
text for designing the stance detector. In this study, we employ sentence embedding
techniques for text representation by utilizing the pre-trained BERT model. Furthermore,
both machine and deep learning techniques have been experimented with for designing
the stance classifier.
4. Data Collection
The study focuses on the examination of the attitude of Twitter users towards the
unverified claim that held the TJ event responsible for the outbreak of COVID-19 in India
and determining whether the speculation of such misinformed content catalyzed the
communal violence. The data collection is directed towards obtaining only event-based
tweets shared by users. The whole data were collected in three iterations using the three
Python libraries, namely, Tweepy, Selenium, and BeautifulSoup, to gather more tweets and
cover more users affected by the claim.
Figure 1 provides the pseudocode of the three iterations for data collection. The
input to the algorithm is the list of query strings such as “jamaat covid case increase”
and “jamaat responsible corona,” which were intelligently designed so as to locate the
concerned tweets on the network. The search functionality of the Tweepy library has been
utilized to crawl the TJ event-based tweets via query strings. Four attributes of the tweet,
namely, tweetscreen_name, tweet id, tweet text, and tweet date, were scrapped and saved
in the file, tweetFile. This is the first iteration of data collection.the next task is to visit the Twitter profile of the retweeter and search for the particular
tweet, which is the retweet of the original tweet. Tweepy library is utilized to execute this
functionality. Since the retweets we are looking for on the retweeter profile contains the
text of the original tweet, the value of tweet text saved in the retweetersFile is used to
Electronics 2021, 10, 5 identify them. Once the retweet is found on the profile, all the four attributes, tweet-
7 of 21
screen_name, tweet id, tweet text, and tweet date, are scrapped and stored in the tweet
file.
Figure 1.
Figure 1. Pseudocode
Pseudocode for
for three-step
three-step data
data collection.
collection.
As already
The seconddiscussed,
iteration aimswhiletoretweeting, there are two
scrap the re-posting (or possibilities,
retweet) details (1) the users
of the may
tweets
share it asinitthe
collected is (simple-retweet),
first iteration in orderor (2)tothe users
gather mayreaction
more add some of their
towards thecomments to the
rumor. A tweet
original
can content
be shared (quoted-retweet).
as it Therefore,
is, called simple-retweet, or abydelimiter “$$$$$$##$$”
adding comments, is used
referred to asinquoted-
storing
the retweeted
retweet. text.Tweepy
Since the Text before
librarythe delimiter
does represents
not give the detailstheof content of the tweet
quoted-retweet, that was
the Selenium
retweeted,
package of and
Pythontext has
afterbeen
the delimiter contains
used to scrap the added
the retweets comment
record as it if
hasany.
the capability of
In order
imitating humanto further
action extend the coverage
and extract of data
the content fromcollection,
the browser in itself.
the third iteration,
In this we
iteration,
the Selenium
extracted script is designed
the replied-tweets to obtain
of the tweets the
savedlistinoftweetFile.
retweeters Thewho further shared
BeautifulSoup the
library
tweets
was usedsaved
for in tweetFile.
collecting Thetweets
these task ofdue
the to
Selenium script isreasons:
the following to navigate to the URL of each
original tweet (https://twitter.com/tweetscreen_name/status/tweetid), open the dialog
box which displays the screen names of the retweeters, and scraps their IDs. The scrapped
re-tweeters IDs, along with the text content of the original tweet, i.e., tweet text, are saved
in the retweetersFile. It is to be noted that the dialog box did not show the IDs of all the
retweeters, and so, Selenium could not provide the record of all retweeters. Afterward,
the next task is to visit the Twitter profile of the retweeter and search for the particular
tweet, which is the retweet of the original tweet. Tweepy library is utilized to execute this
functionality. Since the retweets we are looking for on the retweeter profile contains the text
of the original tweet, the value of tweet text saved in the retweetersFile is used to identify
them. Once the retweet is found on the profile, all the four attributes, tweetscreen_name,
tweet id, tweet text, and tweet date, are scrapped and stored in the tweet file.
As already discussed, while retweeting, there are two possibilities, (1) the users may
share it as it is (simple-retweet), or (2) the users may add some of their comments to the
original content (quoted-retweet). Therefore, a delimiter “$$$$$$##$$” is used in storing
the retweeted text. Text before the delimiter represents the content of the tweet that was
retweeted, and text after the delimiter contains the added comment if any.
In order to further extend the coverage of data collection, in the third iteration, we
extracted the replied-tweets of the tweets saved in tweetFile. The BeautifulSoup library
was used for collecting these tweets due to the following reasons:
• Tweepy library does not provide the functionality to extract replied-tweets unless we
have a premium account
• Designing a beautiful soup-based script is way easier than the Selenium scriptElectronics 2021, 10, 5 8 of 21
• Selenium increases the chances of suspension or blocking of the Twitter account being
used for collection.
The text of replied-tweet is stored similarly as retweeted-tweet, i.e., separating the
content via “$$$$$$##$$” delimiter. Here, the former part of the delimiter represents the
text of the tweet to which the user is responding, and the latter part holds the responded
text.
In the end, around 6000 tweets were extracted associated with the claim. However, we
also observed various factors that limited the data collection process. These are discussed
as follows: (1) Tweepy does not provide data older than 2 weeks, and the data collection
was started in the first week of April, (2) The dialog box of retweeters was not giving more
than 80 users ids even if a tweet has 10k retweets, (3) It was not possible to locate the
concerned tweets on the walls of every retweeter since the Tweepy can extract a maximum
of 40,000 tweets of a user and if the concerned tweet is older than that, we could not reach
to it, and (4), Beautiful soup cannot extract dynamically loaded content, and so, can return
only those replies which appear on the source page of the tweet URL.
5. Data PreProcessing
The preprocessing is conducted to prepare the tweets’ data for analysis. It is im-
plemented in two stages, Tweets Labeling and Polarity-based Text Extraction, which are
discussed in the following subsections.
5.1. Tweets Labeling
In this stage, the task is to prepare a labeled dataset by classifying the tweets into
one of the following polarities, i.e., E endorse), D (deny), Q (question), and N (neutral) to
categorize the different kinds of the reaction of the user towards the claim. E tag denotes the
tweets which supported the claim and agreed that the event is the cause of the coronavirus
outbreak in the country. Similarly, D and Q tags denote those tweets who either disagree
outright or raise the doubt regarding the claim, respectively. In the N tag, we mark those
tweets that just share the facts and figures related to the information. Table 1 shows some
tweets samples that were categorized under these labels.
Table 1. Example of tweets under four categories of reaction.
Tweet Text Sample Label Basis
Tablighi Jamaat is now responsible for the largest single-day increase in Indian COVID-19 cases E Approve
No evidence that the Tablighi Jamaat event in Delhi is responsible for the continued rise in COVID-19
D Disapprove
cases in India
Are Tablighis the only people who traveled during the pandemic? India’s 2020 foreign tourists
Q Doubt
arrivals data reveals facts
COVID-19 count crosses 15,000, toll over 500; rise in non-Tablighi Jamaat cases in Delhi N Share facts
Since the collected dataset also includes the tweets which were retweeted as it is,
there is a high possibility of having duplicated tweet text in the corpus. Therefore, before
classifying the tweets into four classes, we filter the unique tweets. Furthermore, sarcasm is
found in the tweets; for example, “TJ members are way too good”, “Tablighi jamaat people
are very funny”, etc. This made it difficult to label the tweets with a program. Therefore,
the labeling of the selected tweets was done manually with the mutual consent of the
authors of the paper. Once the tweets with unique text were assigned classes, the rest of
the tweets were labeled by the program.
5.2. Polarity-Based Text Extraction
As we discussed in the section, the text of retweeted and replied-tweets contains
two parts of information, i.e., the text of the original tweet and appended/respondedElectronics 2021, 10, 5 9 of 21
content, which is separated by a delimiter. It is to be noted that when a user retweets the
content as it is, it shows user approval regarding the text. On the contrary, when the user
adds his/her views while retweeting, there are possibilities that the user may support,
question, or deny the text of the tweet to be retweeted. Similarly, the replied-tweets or
comments can also show either approval or disapproval of the original tweet. Since one of
the objectives is to analyze the language used in the four classes of tweets (E, D, Q, and N),
text filtering is done for extracting the part of the information that projects the intention of
the replied/retweeted tweet.
The task of the text extraction is to first identify whether the appended/responded
content shows approval or disapproval of the original tweet. In order to detect the agree-
ment or disagreement, the polarities of the original tweets and retweets/replied-tweets
were compared if they are the same or change. The same polarity indicates approval, and
therefore, in this case, both the parts of the information, original and added/responded,
were considered as the views of the user. On the other hand, if the change in polarity is
detected, only the added/replied text was considered for language analysis.
Table 2 depicts two examples to demonstrate the text filtration in two scenarios,
disapproval and approval. Case 1 shows the text extraction when a disagreement is
detected between the reaction polarities (P) of replied or retweet (RT) and original tweet
(OT). Let “The TJ is responsible” be the original tweet (OT), and the user further shares
this tweet by adding the content “You are lying #islamophobia” to the content of OT. Since
the polarities of OT and RT are different, while analyzing the language of the RT, only the
appended part will be considered. Case 2 explains the scenario when RT content shows
approval for the OT content. In such a condition, we kept both the part for language
analysis of RT.
Table 2. Examples of polarity-based text extraction.
Case 1: When polarities (P) of replied-tweet/retweet (rt) and original-tweet (OT) differ,
P (OT = The TJ is responsible) => E
P (RT = The TJ is responsible $$$$##$$ you are lying #islamophobia) => D
Filtered text => you are lying #islamophobia
Case 2: When polarities (P) of replied tweet or retweet (RT) and original tweet (OT) are the same,
P (OT = the event is responsible) => E
P (RT = The event is responsible $$$$##$$ absolutely) => E
Filtered text => the event is responsible $$$$##$$ absolutely
6. Data Analysis
The data were analyzed in five phases to understand the behavior and reaction of
users from various aspects. The following five subsections discuss the findings of these
phases, respectively.
6.1. First Phase
To study the behavior of Twitter users towards the claim, we first look at the tweeting
patterns of the four classes of users, i.e., E, D, Q, N. We evaluate the frequency of the tweets
for E-D-Q-N users on each day, which is shown in Figure 2. It can be seen that the timeline
of tweets collected by the program is from 31 March 2020 to 2 May 2020. The initial thing
we noticed, on the first day of the timeline (i.e., 31 March 2020), the number of tweets
sharing neutral information (#41) about the event are exceedingly greater than the tweets
endorsing (#11) or denying the claim (#2). On this date, news citing “Union Health Ministry
of India” as reference was published, which reported 175 fresh COVID infected cases in
Delhi, doubting Tablighi gathering as the prime reason [44]. It can be seen that although
the news shares some credible facts, the claim towards TJ is still unverified. Following the
news, a peak can be seen on 1 April for endorsed (E) users with #340 number of tweets. A
trend was noticed on Twitter with the headline “Tablighi Jamaat is now responsible for theElectronics 2021, 10, x FOR PEER REVIEW 10 of 21
Health Ministry of India” as reference was published, which reported 175 fresh COVID
Electronics 2021, 10, 5 infected cases in Delhi, doubting Tablighi gathering as the prime reason [44]. It can 10 ofbe
21
seen that although the news shares some credible facts, the claim towards TJ is still unver-
ified. Following the news, a peak can be seen on 1 April for endorsed (E) users with #340
number of tweets. A trend was noticed on Twitter with the headline “Tablighi Jamaat is
largest
now single-dayfor
responsible increase in Indian
the largest COVID-19
single-day cases”.
increase On theCOVID-19
in Indian same date,cases”.
the number
On theof
tweets (#115) from the users denying the information also increases relatively, which
same date, the number of tweets (#115) from the users denying the information also in- were
citing other
creases eventswhich
relatively, and gatherings
were citingwhich
otherhappened
events andingatherings
India during thehappened
which COVID pandemic
in India
to be the potential reasons.
during the COVID pandemic to be the potential reasons.
Figure
Figure2.
2.Tweeting
Tweeting pattern
pattern of
of endorse
endorse (E)-deny
(E)-deny (D)-question
(D)-question (Q)-neutral
(Q)-neutral (N) user reaction polarities.
Next wave
Next wave ofof tweets
tweets isis seen
seen onon 55 April
April with
with ananincrease
increase inin the
the number
number of of tweets
tweets from
from
neutral (#90) and questioning (#144) users. On this date, another
neutral (#90) and questioning (#144) users. On this date, another news was surfaced fromnews was surfaced from
the media
the media that
that cited
cited the
the statement
statement of of the
the Joint
Joint Secretary
Secretary ofof India
India claiming
claiming that
that COVID-19
COVID-19
cases in India have doubled in 4.1 days, which would be 7.4
cases in India have doubled in 4.1 days, which would be 7.4 days without TJ event days without TJ event[45].
[45].
This news
This news led
led to
to the
the flooding
flooding of of the
the tweets
tweets thatthat were
were raising
raising thethe distrust
distrust regarding
regarding the the
claim by
claim by mostly
mostly asking
asking the
the statistics
statistics of
of relatively
relatively increment
increment in in testing
testing counts
counts oror arrival
arrival of
of
the total number of tourists during that period. The main arguments
the total number of tourists during that period. The main arguments that were put by Q that were put by Q
users are that the doubling of figures could be due to the increase in
users are that the doubling of figures could be due to the increase in the number of testingthe number of testing
or the
or the non-TJ
non-TJ tourists
tourists who
who havehave not
not been
been monitored.
monitored.
11 April marks the highest peak
11 April marks the highest peak for all for all types
types ofof user
user tweets,
tweets, E-D-Q-N.
E-D-Q-N. This
This was
was the
the
period when the news was published, claiming that according to a
period when the news was published, claiming that according to a group of Indian scien-group of Indian scientists,
the available
tists, datadata
the available doesdoes
not support
not supportthe blame
the blame thatthat
the the
TJ event
TJ eventis mainly responsible
is mainly for
responsible
the continuous growth of COVID cases [17,46]. They also mentioned that the skewed
for the continuous growth of COVID cases [17,46]. They also mentioned that the skewed
counts of COVID cases linked with the TJ event are due to the low number of testing being
counts of COVID cases linked with the TJ event are due to the low number of testing being
performed across India.
performed across India.
Surprisingly, although the end of the timeline of the tweets collected by our program is
Surprisingly, although the end of the timeline of the tweets collected by our program
2 May, it can be seen that after 26 April, no neutral tweets were observed. It indicates that
is 2 May, it can be seen that after 26 April, no neutral tweets were observed. It indicates
users at a certain point stopped sharing credible facts, and only the tweets containing stories
that users at a certain point stopped sharing credible facts, and only the tweets containing
based on the views and assumptions of the users were doing rounds on social media.
stories based on the views and assumptions of the users were doing rounds on social me-
dia.
6.2. Second Phase
In the first phase, we observed the tweeting pattern of E-D-Q-N users in association
with the real-time event. Here, we seek to determine if there exists any correlation between
the tweeting pattern of different classes of users. In order to obtain the pattern, tweets of
four classes of users are first grouped by their date such that each date holds the number of
tweets shared by E, D, Q, and N users, respectively. The constructed table has five columns,
namely, date, #tweets by E, #tweets by D, #tweets by Q, and #tweets by N. Spearman rankElectronics 2021, 10, 5 11 of 21
correlation [47] was used to determine the association between the tweeting patterns of the
user classes as the data do not follow a gaussian distribution.
Table 3 displays the values of the correlation between the four classes. It can be seen
that the correlation value obtained by endorsing and deny users is significantly higher than
the rest of the classes indicating that as the number of tweets from the E group rises, the D
group also becomes active and post counter-tweets. These are the only two groups that
stand extremely opposite to each other. The second and third highest correlation values are
seen between E-N and D-N user groups, respectively, which further indicates that the most
conflicting groups, i.e., E and D tend to follow each other in terms of the number of tweets.
These findings highlight the environment of social unrest created among Twitter regarding
the claim.
Table 3. Correlation between the tweeting pattern of four kinds of reaction towards unverified news.
E-D E-Q E-N D-Q D-N Q-N
0.91 0.60 0.72 0.54 0.67 0.43
6.3. Third Phase
As the second phase analysis indicated the sign of social conflict between the endorsing
(E) and denying (D) users, in this phase, we are interested in exploring the language used
by these two communities. To serve the purpose, we extracted the list of popular hashtags
in the tweet content shared by them. The re library of Python was used to fetch the hashtags
in the text. After extracting the hashtags of E and D users, we analyze their usage in three
aspects, namely, (1) hashtags (h) used by both E and D (i.e., h(E)∩h(D)), (2) hashtags used
exclusively by E (i.e., h(E)-h(D)), and, (3) hashtags used exclusively by D (i.e., h(D)-h(E)).
Table 4 shows the example of hashtags found in three lists, h(E)∩h(D), h(E)-h(D), and
h(D)-h(E). It can be seen that the topmost hashtags which were used commonly by both
groups, i.e., h(E)∩h(D), include terms that mainly provide the information of the event
that took place. For example, #covid19 and #coronavirus indicate the period of the event,
#tablighijamaat mentions the name of the event, and #nizamuddinmarkaz tells the location
of the event. These sets of tags do not include any racial, hatred, or communal term, and so
can be considered as neutral and informative.Electronics 2021, 10, 5 12 of 21
Table 4. Example of hashtags used by E and D groups.
Groups Hashtags Type of Hashtag
h(E)∩h(D), #covid19, #coronavirus, #tablighijamaat, #nizamuddinmarkaz Neutral and informative
#Indiafightscorona, #covid, #covid2019, #covid19pandemic,
h(E)-h(D) #coronavirusupdate, #lockdown, #tabighijamaat, #tabligijamaat, Neutral
#nizamuddinmarkaj, #maulanasaad
#thoorahulkanwalthoo Personal attack
#Nizamuddinidiots, #tabligijamaatvirus, #bantablighdebate,
#bantablighijamaat, #tablighijamaatterrorist, #coronajihad, Hatred and communal tags
#covid786
h(D)-h(E) #corona, #covid_19, #jamaat, #tablighijamat, #covid2019 Neutral
#hatecoronanotcommunity, #stopcovidislamophobia,
Fear
#islamophobia_in_india
If we look at the tags used by E users only, i.e., h(E)-h(D), a variety of tags from
no violence (neutral) to violence (hatred, communal, and personal-attack) can be found.
Neutral tags, as usual, include those words which provide the information about the event.
We found various novel neutral terms in this list such as #Indiafightscorona (specifying the
country, India where the event took place), #lockdown (specifying that event occurred in
the lockdown period), and #maulanasaad (indicating the name of the chief of the event).
The term # thoorahulkanwalthoo is considered as personal-attack hashtags since this tag is
directed against a well-known personality of India who denied the claim that the TJ event
is responsible for the COVID outbreak. The tag has three parts, thoo (English meaning is
spit), rahulkanwal (a renowned Indian TV journalist), and again thoo, i.e., spit.
The list of hatred and communal hashtags comprises those terms that attempt to
spread hate and encourage violence among the people based on their religion. For example,
#Nizamuddinidiots consists of two parts, Nizamuddin (location of the event) and idiots
(refers to the people who gathered in the event as idiots). The hashtag #tabligijamaatvirus
treats the COVID-19 as a Tablighi Jamaat scourge. The list also includes severely violent
terms such as terrorist in #tablighijamaatterrorist and jihad in #coronajihad. We also
observed the hashtags which directly express the anger towards the Islamic community,
such as #covid786 (786 is the holy number in Islam).
Finally, we explore the hashtags exclusively used by the denying user group, i.e.,
h(D)-h(E). Similar to the previous two hashtags lists, h(D)-h(E) also contains neutral terms
such as #covid_19 and #coronavirus. However, it is surprising to see that the list does
not include any communal or hate tags but fear. For example, the term islamophobia in
the two hashtags, #stopcovidislamophobia and #islamophobia_in_india, is indicating the
atmosphere of fear created among the people due to the diffusion of communal and hatred
tweets against the Islamic religion. Moreover, #stopcovidislamophobia urges the users to
stop spread the tweets that relate coronavirus with Islam, and #hatecoronanotcommunity
appeals to the users to hate coronavirus, but not the Islamic community.
6.4. Fourth Phase
In the previous analysis, we explored the kind of language used by endorsing and
denying communities in terms of the hashtags being used in their tweets. We observed
various categories of hashtags in the content, from no violence (neutral) to severe violence
(hate and communal). In this stage, we are keen to conduct the timeline analysis of these
hashtags to understand what is the impact on the language of the tweeter users over a
period of time due to the repeated circulation of the unverified claim that has the potential
to create communal violence.
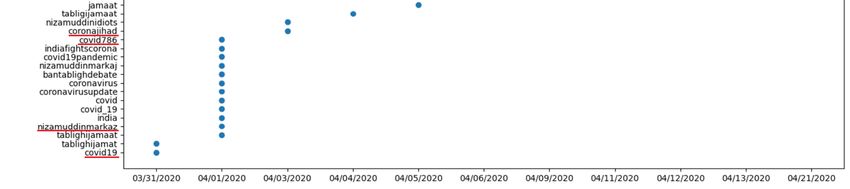
Here, we first determined the date of hashtags when they were used for the first time
by the twitters. Figure 3 shows the plot between the hashtags and the dates they were used
at first. It can be seen that at the beginning of the timeline (31 March 2020), neutral hashtagsElectronics 2021, 10, 5 13 of 21
appeared, such as #covid19, #tablighijamaat, etc. The date 1 April 2020 also witnessed
informative tags such as #indiafightscorona and #coronavirus. After this date, the data
started showing hate or communal terms like #coronajihad (3 April), #nizamuddinidiots
Electronics 2021, 10, x FOR PEER REVIEW 13 of 21
(4 April). Later on the timeline, personal-attack tags such as #thoorahulkanwalthoo is
also noticed (9 April). The rear end of the timeline experiences more violent tags such
as #tablighijamaatterrorist (11 April) and distress tags such as #islamophobia_in_india
treat the information as true and make the language of the twitters more harmful, con-
(21 April).
flicting, violent, and terrible over time.
Figure
Figure 3.
3. Birth
Birth of
of hashtags.
hashtags.
6.5. Fifth
ThePhase
timeline analysis of the birth of the hashtags indicates that repeated exposure
to the claim
Hence, far, thatweTJ causes coronavirus
have noticed outbreak in
two conflicting thecommunities,
user country has severely
E and D,affected the
which ap-
psychology of twitters. According to a study [5], the dissemination
peared to be continuously fighting and arguing on Twitter over an unverified claim. We of a rumor, time
and observed
also again, canthe affect
kindtheofcognitive
hashtags andusedperceiving
by them and skillshowof the
the people
intensity into
of believing
negativitytheof
information
these tags grow as credible.
over time.Therefore,
All thesecontinuous
results pointcirculation
out that of theunverified
unverifiedclaims
claimpersuaded
had suffi-
the user
cient to treattothe
potential information
polarize societyasand
truecause
and make the language
the situation of the twitters
of communal more
violence harmful,
and social
conflicting, violent, and terrible over time.
unrest. In this stage, we are interested to know if the four classes of users are making
separate groups or echo chambers in the network. Their presence in our dataset will fur-
6.5. Fifth Phase
ther provide the existence of polarization, groupism, and division in society.
Hence,
In order far, we have
to detect noticed
the echo two conflicting
chambers, we perform userclustering
communities,
on theEtweets
and D,ofwhich ap-
the users
peared to be continuously fighting and arguing on Twitter over
to investigate whether the tweets with the same reaction polarity are using similar lan- an unverified claim. We
also observed
guage. Each tweet theiskind of hashtags represented
mathematically used by them and how
in vector formtheby intensity
employing ofthe
negativity
bag-of-
of these tags grow over time. All these results point out
hashtags (BoH) technique [48], similar to the traditional bag-of-words (BoW) textthat the unverified claim had
repre-
sentation. In BoH vectorization, at first, a dictionary of hashtags (DH) is designed byand
sufficient potential to polarize society and cause the situation of communal violence ex-
social unrest.
tracting all of In
thethis stage, we
hashtags areappeared
that interested intothe
know
tweet if the four classes
content of users The
of the dataset. are making
size of
separate groups or echo chambers in the network. Their presence in our dataset will further
the dictionary is 175. Afterward, each tweet is assigned a vector, say, t(BoH) = (h1,h2,…
provide the existence of polarization, groupism, and division in society.
hm), where m denotes the size of the vector. Since each hashtag in the dictionary, DH
In order to detect the echo chambers, we perform clustering on the tweets of the
represents a feature, the length of the BoH vector of a tweet is the same as the dictionary,
users to investigate whether the tweets with the same reaction polarity are using similar
i.e., m = 175. The value of hi in the vector represents the number of times the respective
language. Each tweet is mathematically represented in vector form by employing the
hashtag occurred in the tweet.
bag-of-hashtags (BoH) technique [48], similar to the traditional bag-of-words (BoW) text
K-means clustering was applied to group the BoH vectors of tweets. The similarity
representation. In BoH vectorization, at first, a dictionary of hashtags (DH) is designed by
between the vectors is determined by evaluating the Euclidean distance. The K-means
extracting all of the hashtags that appeared in the tweet content of the dataset. The size
algorithm needs the value of the number of clusters in advance, which is calculated using
of the dictionary is 175. Afterward, each tweet is assigned a vector, say, t(BoH) = (h1,h2,
the elbow method. The method gives nine as the optimal number of clusters. Table 5
. . . hm), where m denotes the size of the vector. Since each hashtag in the dictionary, DH
shows the membership of E, D, Q, and N users in each cluster. It can be seen that out of 9
represents a feature, the length of the BoH vector of a tweet is the same as the dictionary,
clusters,
i.e., m = 2175. clusters (C2 and
The value of C3)
hi inhave the majority
the vector of E users,
represents two clusters
the number (C4the
of times andrespective
C6) have
the majority of D users,
hashtag occurred in the tweet. one cluster (C8) comprises Q users more in number, and one clus-
ter (C9) has N users more in number. Only 3 clusters (C1, C5, and C7) were observed with
a mixed population. These results show that the language used by the E, D, Q, and N is
similar within themselves and differ reasonably greater from each other, thereby forming
separate groups while clustering. Therefore, the findings reveal the presence of echo
chambers as people with similar mindsets or reactions are forming groups based on theirElectronics 2021, 10, 5 14 of 21
K-means clustering was applied to group the BoH vectors of tweets. The similarity
between the vectors is determined by evaluating the Euclidean distance. The K-means
algorithm needs the value of the number of clusters in advance, which is calculated using
the elbow method. The method gives nine as the optimal number of clusters. Table 5
shows the membership of E, D, Q, and N users in each cluster. It can be seen that out of
9 clusters, 2 clusters (C2 and C3) have the majority of E users, two clusters (C4 and C6)
have the majority of D users, one cluster (C8) comprises Q users more in number, and one
cluster (C9) has N users more in number. Only 3 clusters (C1, C5, and C7) were observed
with a mixed population. These results show that the language used by the E, D, Q, and
N is similar within themselves and differ reasonably greater from each other, thereby
forming separate groups while clustering. Therefore, the findings reveal the presence of
echo chambers as people with similar mindsets or reactions are forming groups based on
their language usage.
Table 5. Membership of users in clusters.
Dominating
Cluster #E-Users #D-Users #Q-Users #N-Users
Group
C1 299 127 19 48 Mixed
C2 62 2 0 0 E
C3 44 0 0 0 E
C4 0 82 0 0 D
C5 50 54 1 14 Mixed
C6 0 62 0 0 D
C7 99 117 0 2 Mixed
C8 3 19 26 1 Q
C9 0 0 1 26 N
7. Discussion
The main objective of the analysis carried out in this study is to determine whether
the misinformation disseminated on Twitter during COVID-19 has the potential to catalyze
the instability and communal violence in society. The paper analyzed the tweets generated
related to a specific religion-based rumor that claims the members of the TJ event are the
spreaders of coronavirus infection in the country. The analysis was carried out in 5 phases.
In the first phase, we look at the tweeting pattern of E, D, Q, and N users where a form of
synchronization was observed between the number of tweets of the user-classes and the
news that were published in real life regarding the claim. For example, we observed that the
timeline started with neutral tweets in correspondence to the news, which reported the total
count of COVID positive cases found as linked with the TJ event. Afterward, we see several
small peaks of the users who were either supporting (E), refuting (D), or interrogating (Q)
the claim. The highest peak was recorded on 11 April for all user groups when for the
first time, an official statement was released, which refuted the allegation that the TJ event
was responsible for the outbreak. The findings also highlighted the phenomenon when
at a certain point in time, people started getting influenced more towards the fabricated
version of the information that mostly contains the views of a similar mindset community
rather than credible facts.
In the second stage of analysis, we determine whether there exists any correlation
between the tweeting pattern of E, D, Q, N user classes. E and D classes were observed
as the most strongly correlated groups in terms of the number of tweets shared by their
users. It points to the presence of social unrest among Twitter users since these two are the
two groups that stand on opposite sides of the claim, one endorsing the claim and another
denying the claim.Electronics 2021, 10, 5 15 of 21
As the third step of the analysis, we studied the language used by E and D user
classes in terms of hashtags that appeared in their content. We analyzed three aspects,
hashtags used by both E and D, hashtags used by E only, and hashtags used by D only.
Here, we noticed a very interesting trend. The hashtags that appear in both classes were
primarily neutral and educational, carrying the information of the event itself in terms
of time, location, type, etc. However, the hashtags that were exclusively used by E class
were mostly related to communal and hated showing their anger towards the participants
who attended the event, and in severe cases, relating the event with the whole Muslim
community. Surprisingly, the hashtags observed in the content of D class were mostly
containing fear elements. The analysis of the language of E and D users further showed
the sign of communal violence on Twitter as well.
In the fourth step, we observed the timeline of the birth of hashtags of E and D user
classes in order to get insight into the impact on their language with time. We noticed
that over time, the language was getting more violent and communal. For example, the
timeline starts with the neutral and informative tags (e.g., #covid19, #tablighijamaat), get
violent in middle (e.g., #tablighijamaatterrorist) and ended with extreme distress (e.g., #islam-
ophobia_in_india). The findings reveal the effect of prolonged exposure to the toxic rumor
on the psychology of the users. In the last section of the analysis, we performed clustering
based on the language of all four user classes in terms of hashtags. Hashtag tweet vector
was designed by applying the bag-of-words approach. In total, 9 clusters were formed
where we noticed that E, D, Q, N do form separate groups and share similar language skills
within themselves. The clusters also indicated the presence of echo chambers where users
with similar mindsets seem to form groups.
This paper referred to several news articles as support. Hence, it is necessary to
look at the credibility of news-sites whose articles have been cited. We used the media
bias/fact check (MBFC) website to determine the factual accuracy of referred news media.
The website scores the news media on six categories, i.e., very high, high, mostly factual,
mixed, low, and very low, based on their credibility of publishing stories. The very high
category includes those news-sites which get a score of 0, implying these sites are always
observed as sharing credible news and never failed a fact check. Similarly, very-low-labeled
news-sites are scored as 10, implying these sources can never be considered trustworthy.
The news sources referred to in this article received three types of ratings, namely, high (1–3
score), mostly factual (3–5 score), and mixed (5–6 score). Those websites are categorized
as high and mostly factual, which have failed just one or two fact checks, respectively.
Mixed-labeled news sources are those websites which have not always used authentic
source and often fail in fast checks. Table 6 shows the scores of the news media assigned by
the media bias/fact check.
Table 6. Scores of the news media.
News Media Factual Reporting
www.thewire.in High
www.timesofindia.indiatimes.com High
www.forbes.com Mostly factual
www.thehindu.com Mostly factual
www.aljazeera.com Mixed
www.theguardian.com Mixed
8. Stance Detection
The paper emphasis the analysis of the behavior of Twitter users towards religion-
based misinformation disseminated during the COVID-19 pandemic. The main objective
of the study is to determine whether Twitter plays a role in instigating communal violence
and social instability due to spreading.
In this section, we present a stance detection model to identify the opinion of a tweet
towards a specific news headline. Using this model, we can get the distribution of differentYou can also read