Improving Food Detection For Images From a Wearable Egocentric Camera
←
→
Page content transcription
If your browser does not render page correctly, please read the page content below
https://doi.org/10.2352/ISSN.2470-1173.2021.8.IMAWM-286
                                                                                               © 2021, Society for Imaging Science and Technology

Improving Food Detection For Images
From a Wearable Egocentric Camera
Yue Han; School Of Electrical and Computer Engineering, Purdue University; West Lafayette, IN
Sri Kalyan Yarlagadda; School Of Electrical and Computer Engineering, Purdue University; West Lafayette, IN
Tonmoy Ghosh; Department of Electrical and Computer Engineering, The University of Alabama; Tuscaloosa, AL
Fengqing Zhu; School Of Electrical and Computer Engineering, Purdue University; West Lafayette, IN
Edward Sazonov; Department of Electrical and Computer Engineering, The University of Alabama; Tuscaloosa, AL
Edward J. Delp; School Of Electrical and Computer Engineering, Purdue University; West Lafayette, IN

                                                                            process. Self reporting techniques such as Food Frequency Ques-
                                                                            tionnaire (FFQ) and Automated Self-Administered Recall System
Abstract                                                                    (ASA24) are standard tools used to collect such data [5]. The ac-
     Diet is an important aspect of our health. Good dietary                curacy of the data depends on the participants motivation and the
habits can contribute to the prevention of many diseases and im-            ability to accurately remember their diet. In addition, they can
prove overall quality of life. To better understand the relationship        be time consuming and laborious. To overcome these difficulties
between diet and health, image-based dietary assessment systems             several techniques to automatically collect dietary data have de-
have been developed to collect dietary information. We introduce            veloped. Some rely on images of eating scenes to extract dietary
the Automatic Ingestion Monitor (AIM), a device that can be at-             information. These techniques are referred to as image-based di-
tached to one’s eye glasses. It provides an automated hands-free            etary assessment methods. TADA [6], FoodLog [7], DietCam [8],
approach to capture eating scene images. While AIM has several              and FoodCam [9] are examples of image-based dietary assess-
advantages, images captured by the AIM are sometimes blurry.                ment methods. All these systems require users to take a picture
Blurry images can significantly degrade the performance of food             of the eating scenes using mobile telephones. These eating scene
image analysis such as food detection. In this paper, we propose            images are then analyzed by trained dietitians to estimate the nu-
an approach to pre-process images collected by the AIM imaging              trient information. This process is also time consuming, costly
sensor by rejecting extremely blurry images to improve the per-             and laborious. Recently, progress has been made on automating
formance of food detection.                                                 this process [10, 11, 12, 13, 14, 15, 16, 17]. The process of ex-
                                                                            tracting nutrient content in an image involves 3 sub-tasks, food
Introduction                                                                detection and segmentation, food classification and portion size
      In 2016, $7.5 trillion was spent on healthcare worldwide,             estimation [6, 18, 19, 20].
which is approximately 10% of the world GDP [1]. At the same
time, over $50 billion per year was spent on diet-related car-                   Mobile telephones are ubiquitous in today’s society and used
diometabolic disease [2]. Understanding the factors that influence          by all age groups of the population. Using mobile telephones for
health can help prevent this unnecessary expenditure and associ-            image-based dietary assessment makes the process simple, cheap
ated illness. It is well-known that dietary habits have a profound          and easy to use. However, taking out the mobile telephones dur-
impact on health [3]. Poor dietary habits can contribute to ail-            ing eating requires manual effort and may be inconvenient. To
ments such as heart diseases, diabetes, cancer and obesity. Di-             overcome this challenge, we will describe the Automatic Inges-
etary studies have shown that an unhealthy diet, such as skipping           tion Monitor (AIM) that provides a hands-free approach to auto-
meals, can also be linked to stress, depression and other mental            matically capture food images during an eating occasion.
illness [4]. Because poor diet could have such a severe impact
on our health, it is important that we study and understand the                   AIM is a passive food intake sensor which requires no self-
complex relationship between dietary habits and health.                     reporting during the eating occasion and can be easily mounted
      To achieve this goal, nutrition practitioners and dietary re-         on eyeglasses. Additionally, this device also automated the entire
searchers conduct dietary studies to collect data about the dietary         image extraction process. Food intake is detected by the built-in
habits of people. The collected data is used to analyzed and to             accelerometer [21, 22, 23, 24, 25]. The images are stored on a SD
understand how dietary patterns influence health. A challenging             card and can be exported by USB interface or Bluetooth. While
aspect of conducting these dietary studies is the data collection           AIM automatically captures eating scene images, these images
                                                                            are sometimes affected by motion blur. Blurry images can poten-
      Research reported in this publication was partially by the National   tially reduce the performance of image analysis such as food de-
Institute of Diabetes and Digestive and Kidney Diseases (grants number:     tection, food segmentation, food classification and portion size es-
R01DK100796) and by the endowment of the Charles William Harrison
Distinguished Professorship. The content is solely the responsibility of    timation. In this paper, we propose a method to automatically de-
the authors and does not necessarily represent the official views of the    tect and remove extremely blurry images from the training dataset
National Institutes of Health.                                              to improve the accuracy of food detection.

IS&T International Symposium on Electronic Imaging 2021
Imaging and Multimedia Analytics in a Web and Mobile World 2021                                                                              286-1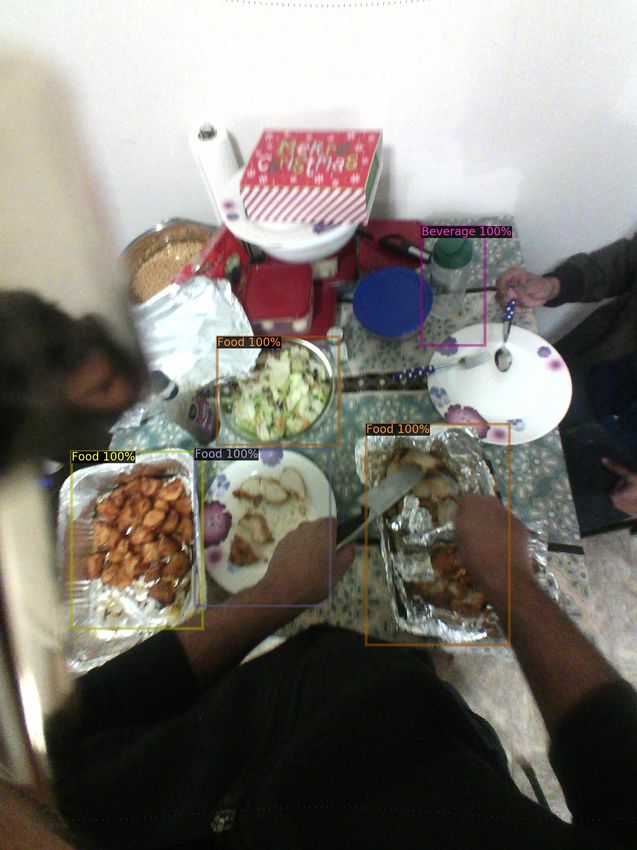
Number of objects        Training     Validation      Testing
                                                                            food                     4,033        570             472
                                                                            beverage                 2,239        288             264
                                                                        Table 1: Number of food, beverage objects in Training, Validation, and
                                                                        Testing subsets

                                                                                 Figure 2: Block diagram of our blur detection method

Figure 1: a) AIM mounted on eyeglasses. b) A child wearing AIM. c)
Electronics of AIM.

Automatic Ingestion Monitor (AIM)
     AIM is a device that clips on to eye glasses. It consists of the
following sensors (see Figure 1)

   • 5 Megapixel camera
   • Accelerometer
   • Curved strain sensor                                                       (a) variance > BT                    (b) variance < BT
                                                                        Figure 3: Examples of images with variance less than the Blur Threshold
      The camera sensor is aligned with the person’s eye gaze and       (BT) and greater than BT. BT = 10.
is used to capture images of the eating scene. The accelerom-
eter is used for food intake detection. The curved strain sensor        free-living day with no restrictions being imposed on food intake
is in contact with the temporalis muscle and privides a precise         or other activities. A total of 90170 images were captured by the
estimate of the chew count. Images are captured periodically ev-        AIM device during the free-living day with 5418 images captured
ery 15s. The on-board SD card has a capacity of storing images          when AIM detected a food-intake session. Our dataset comprises
captured continuously for more than 4 weeks. Recent commu-              of these 5418 images. We manually labelled the foods and bev-
nity studies demonstrated that AIM is able to detect food-intake        erages in them via bounding boxes. The dataset is randomly split
with an accuracy (F1 score) of 96% [24]. In addition, AIM’s chew        into 3 subsets namely training (4,333 images), validation (585 im-
count estimate has a very low mean absolute error of 3.8%. Chew-        ages), and testing (500 images). We report the frequency of ap-
ing and swallowing are directly related to food-intake and chew         pearance of different objects in each of the subsets of the dataset
count data can serve as estimators of ingested mass and energy          in Table 1.
intake [26, 27, 28]. AIM is also safe to use for regular food in-
take study, it is based on low power, low-voltage (3V) and poses        Blur Detection
no more than minimal risk, comparable to a consumer electronic               Before we describe our method, we will briefly describe how
device.                                                                 blurring occurs in images. Let Y denote a blurry image and I its
                                                                        non blurry counterpart then Y and I are related by Equation 1
Dataset Description
     The image dataset was collected from thirty volunteers us-               B = b ∗ I +W                                                  (1)
ing AIM. It contained 20 male and 10 female, mean ± SD age of
23.5 ± 4.9 years, range 18-39 years, mean body mass index (BMI)         Here b is the blur kernel and W is white Gaussian noise. ∗ de-
23.08 ± 3.11 kg/m2 , range 17.6 to 30.5 kg/m2 . The University of       notes the convolution operation. The blur kernel is a low pass
Alabama’s Institutional Review Board (IRB) approved the study.          filter which suppresses the high frequency information in an im-
Each volunteer wore AIM for 2 days, the second day being the            age. The extent of loss of information depends on the frequency

                                                                                      IS&T International Symposium on Electronic Imaging 2021
286-2                                                                      Imaging and Multimedia Analytics in a Web and Mobile World 2021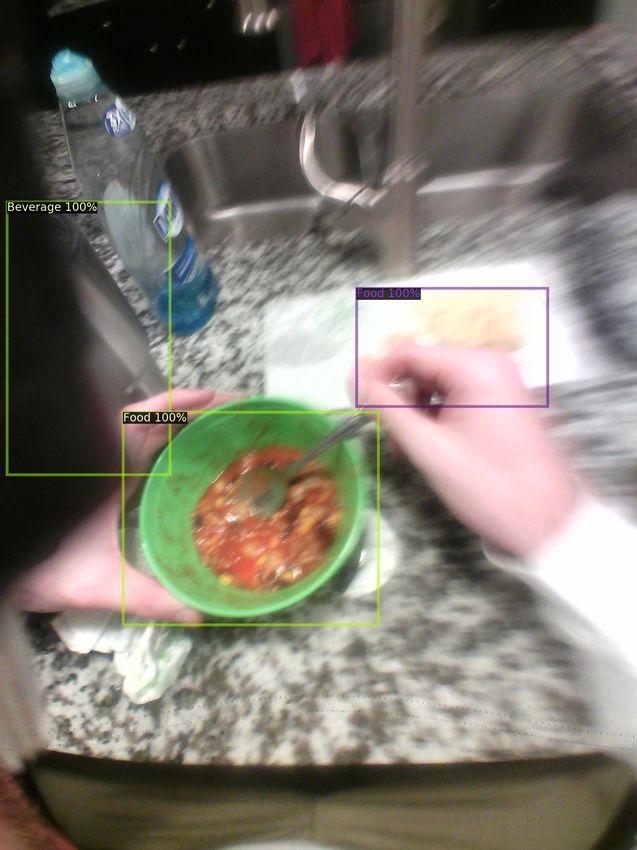
BT=0       BT=5      BT=10      BT=15       BT=20
                                                                        #images         4,333      4,276     3,943      3,240       2,690
                                                                        #food           4,033      4,012     3,790      3,207       2,704
                                                                        #beverage       2,239      2,235     2,145      1,875       1,651
                                                                       Table 2: Number of image, food, beverage object in training subset with
                                                                       different BTs

       Figure 4: The block diagram of our food detection system

characteristics of b. This loss of high frequency information can
be detected visually from inspecting the edge characteristics in the
image. In blurry images, edges are hard to detect and extremely                 Figure 5: The block diagram of Faster RCNN network
blurry images have no relevant object features . When designing
a learning based food detection method, presence of extremely
blurry images in the training set could hamper the performance of      AP [31].
image analysis.
      Our blur detection process is summarized in Figure 2. We         Experiments
first estimate the blur in the image using an approach proposed in          Based on the proposed blur image detection described in
[29]. Blur in an image is estimated by using the Laplacian oper-       Section Blur Detection, the only threshold that needs to be se-
ator on the image and then estimating the variance of its output.      lected is the Blur Threshold (BT). In this section, we describe our
The Laplacian operator has characteristics similar to a high pass      experimental design to select BT.
filter and hence amplifies edge pixels in an image. If the variance
is low, then it is likely that image has blurry or ”unsharp” edges.    BT Selection
Thresholding the variance can be used to decide if an image is               The Faster R-CNN was used as our learning-based method
blurred or not. We refer to this threshold as the Blur Threshold       to detect food/beverage objects from the AIM captured images. In
(BT). The selection of BT will be selected experimentally and          order to obtain better recognition results, we adopt transfer learn-
will be discussed in the food detection section. If the variance       ing and used the model pre-trained on ImageNet [32] as our start-
is less than BT, then the image is discarded from further image        ing point for training. Figure 5 shows the structure of our Faster
analysis. Figure 3b shows an example image with variance less          R-CNN network. The ResNet [33] is used to extract feature maps
that BT and Figure 3a shows an image with variance greater than        from the input image, which are then used by the region proposal
BT. Its obvious that there are no relevant object (food/beverage)      network (RPN) to identify areas of interest in the image. The ROI
features in Figure 3b. Figure 3a has some blurry regions because       pooling layers crop and wrap feature maps using the extracted and
of hand motion but regions belong to objects of food is still clear    generated proposal boxes to obtain fine-tuned box locations and
enough for image analysis.                                             classify the food objects in the image.
                                                                             As described in Section Dataset Description, the dataset is
Food Image Analysis                                                    split into training, validation and testing. We vary the BT from 0
      Visual food-related information from eating occasion plays       to 20 in steps of 5 to create different training datasets. The val-
an important role for automatic dietary analysis. In this paper, we    idation and testing sets remain unchanged. For a given value of
describe a ”food/no food” detection task, detecting whether an         BT, all images in the training set with a variance below BT are
AIM captured image has food/beverage present using the Faster-         discarded. As BT increases, the size of our training dataset de-
RCNN network [30]. By training on blurry images, we are forc-          creases. We show how the number of images in the training set
ing the model to learn from data that has no relevant features in      varies as BT is varies in Table 2. Different instances of Faster
them. We used our blur detection technique described above to          R-CNN model are trained on each of these training sets for 150
reject blurry images from the training set. Our food detection sys-    epochs with a batch size of 64. The validation set is used to select
tem is summarized in Figure 4. The training set images will first      model threshold of all Faster R-CNN instances. We use Aver-
go through image blur rejection with several pre-selected thresh-      age Precision (AP) from COCO to evaluate the performance of
olds. Then the images not rejected will be used as training data       the object detection model. AP ranges between 0 and 100, with
for the Faster-RCNN network for food detection. The system will        100 referring to perfect classification. AP is the COCO’s standard
be tested on the validation set and evaluated using the COCO-          evaluation metric that averages mean Average Precision (mAP)
style Average Precision(AP) [31]. The selected threshold, BT,          over different Intersection of Union(IoU) thresholds, from 0.5 to
will be based on the performance of the food detection system on       0.95. More details of AP calculation can be found in [31]. We
the validation set. We then choose the system with the selected        report the AP over validation dataset as BT varies in Table 3. The
BT threshold as the food detector used to detect the food on the       selection of BT is BT = 10 for our experiments since it gives the
testing set, Finally, we evaluate the results using the COCO-style     best performance on the validation subset.

IS&T International Symposium on Electronic Imaging 2021
Imaging and Multimedia Analytics in a Web and Mobile World 2021                                                                             286-3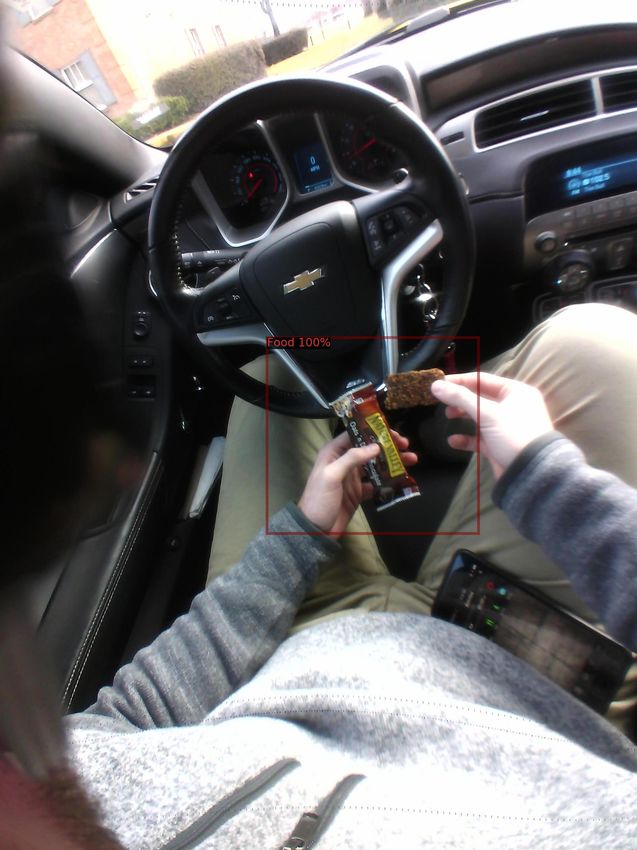
BT=0 BT=5 BT=10 BT=15 BT=20 References
Overall AP 46.37 47.07 52.72 46.10 44.12 [1] “Public spending on health: A closer look at global trends,”
AP of food 43.47 43.95 50.98 43.38 41.31 2018, World Health Organization, Geneva, Switzerland.
AP of beverage 49.26 50.19 54.45 48.82 46.92 [2] Thiago Jardim, Dariush Mozaffarian, Shafika Abrahams-
Table 3: Evaluation of detection using the validation subsets with various Gessel, Stephen Sy, Yujin Lee, Junxiu Liu, Yue Huang,
BT values. Colin Rehm, Parke Wilde, Renata Micha, and Thomas
Gaziano, “Cardiometabolic disease costs associated with
suboptimal diet in the united states: A cost analysis based
BT=10
on a microsimulation model,” PLOS Medicine, vol. 16, pp.
Overall AP 51.97 e1002981, December 2019.
AP of food 50.13 [3] A. E. Mesas, M. Muñoz-Pareja, E. López-Garcı́a, and
AP of beverage 53.81 F. Rodrı́guez-Artalejo, “Selected eating behaviours and ex-
Table 4: AP on testing subset with BT = 10. cess body weight: a systematic review,” Obesity Reviews,
vol. 13, no. 2, pp. 106–135, February 2012.
[4] Esra Tajik, Latiffah Latiff, Hamidin Awang, Siti Nur’Asyura
Food Detector Testing Adznam, Yitsiew Chin, Abu Shah, Chai Koh, and Che
Hariz, “Unhealthy diet practice and symptoms of stress and
From Table 3 we can see that as BT increases from 0 to 10
depression among adolescents in pasir gudang, malaysia,”
the performance of the Faster-RCNN improves across all object
Obesity Research & Clinical Practice, vol. 10, no. 2, pp.
categories and as BT increases from 10 to 20 the performance de-
114–123, July 2015.
creases. We believe that as BT increases from 0 to 10, our object
[5] Jee-Seon Shim, Hai-Rim Shin, Kyungwon Oh, and Cherian
detection method is seeing a performance increase because it sees
Varghese, “Dietary assessment methods in epidemiologic
less and less extremely blurry images. However, as BT inreases
studies,” Epidemiology and Health, vol. 36, pp. e2014009,
from 10 to 20 the performance decreases because of decrease in
July 2014.
the number of the images in training dataset. This can be verified
[6] Fengqing Zhu, Marc Bosch, Insoo Woo, SungYe Kim,
from Table 2. As BT increases from 10 to 15, the training set sees
Carol J. Boushey, David S. Ebert, and Edward J. Delp, “The
a decrease of 700 images. While BT = 15 removes blurry images
use of mobile devices in aiding dietary assessment and eval-
from the training set, it does so very aggressively thus removing
uation,” IEEE Journal of Selected Topics in Signal Process-
some images that contain relevant object (food/beverage) features.
ing, vol. 4, no. 4, pp. 756–766, August 2010.
We show AP on the testing set in Table 4 for the empirically se-
[7] Kiyoharu Aizawa and Makoto Ogawa, “FoodLog: Multi-
lected value of BT=10. By removing extremely blurry images
media Tool for Healthcare Applications,” IEEE MultiMedia,
from the training set, we are able to improve the performance of
vol. 22, no. 2, pp. 4–8, April 2015.
our object detection system and thus improve the performance of
[8] Fanyu Kong and Jindong Tan, “Dietcam: Automatic dietary
the food detection. Results of our object detection model on some
assessment with mobile camera phones,” Pervasive and Mo-
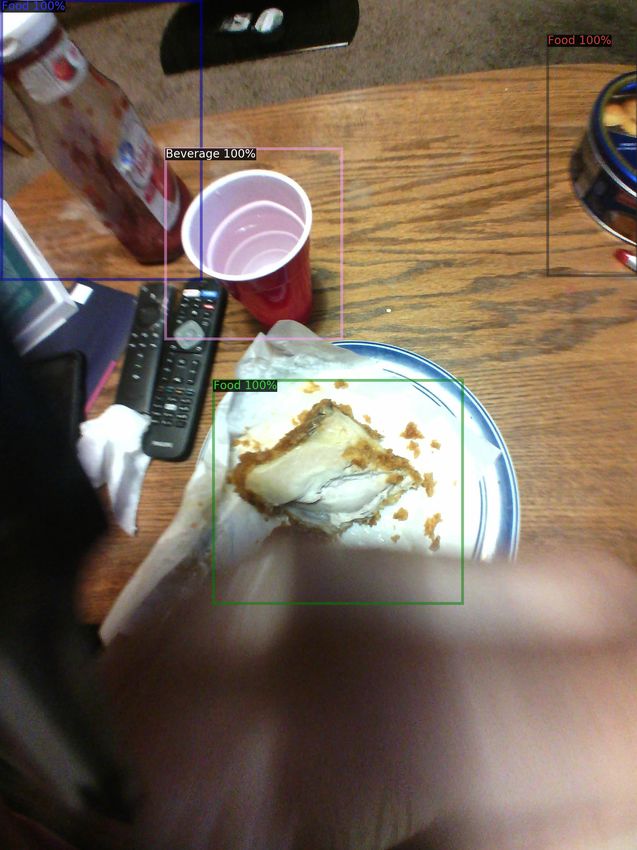
sample images in the test subset are shown in Figure 6. Figure
bile Computing, vol. 8, no. 1, pp. 147 – 163, February 2012.
6(a) and Figure 6(b) show the detector is still able to locate and
[9] Yoshiyuki Kawano and Keiji Yanai, “Foodcam: A real-time
classify the item is food/beverage correctly in partial blurry image
mobile food recognition system employing fisher vector,”
although some blurry images are excluded from the training set,
Proceedings of the International Conference on Multimedia
Figure 6(c) and Figure 6(d) show the detector provides accurate
Modeling, pp. 369–373, January 2014, Dublin, Ireland.
detection result in both scene with single item and complex scene
[10] Shaobo Fang, Zeman Shao, Runyu Mao, Chichen Fu, Ed-
with multiple items.
ward J Delp, Fengqing Zhu, Deborah A Kerr, and Carol J
Boushey, “Single-view food portion estimation: Learning
Conclusion image-to-energy mappings using generative adversarial net-
In this paper, we introduced a food intake sensor, AIM, works,” Proceedings of the IEEE International Conference
which captures eating scene images for the purpose of dietary as- on Image Processing, pp. 251–255, October 2018, Athens,
sessment. AIM provides a hands-free automated approach to cap- Greece.
ture images of eating scene and to provide a precise estimate of [11] Shaobo Fang, Fengqing Zhu, Carol J Boushey, and Edward J
the chew count. Images from AIM device are sometimes affected Delp, “The use of co-occurrence patterns in single image
by blur artifacts which could reduce the performance of various based food portion estimation,” Proceedings of the IEEE
image analysis tasks. We proposed a a simple method to improved Global Conference on Signal and Information Processing,
the food detection performance of images captured by AIM. Ex- pp. 462–466, November 2017, Montreal, Canada.
periments were conducted on a dataset consisting of 5,418 eating [12] Shaobo Fang, Chang Liu, Fengqing Zhu, Edward J Delp,
scene images. We demonstrated that when only extremely blurry and Carol J Boushey, “Single-view food portion estima-
images are removed, performance of the food detection model can tion based on geometric models,” Proceedings of the IEEE
be improved. In the future, we plan to further investigate other de- International Symposium on Multimedia, pp. 385–390, De-
blurring methods including machine learning based methods that cember 2015, Miami, FL.
can be combined for the food analysis task. In addition, we will [13] Koichi Okamoto and Keiji Yanai, “An automatic calorie
study how to mitigate the affect of blur on other tasks such as food estimation system of food images on a smartphone,” Pro-
segmentation, food classification and portion size estimation. ceedings of International Workshop on Multimedia Assisted
IS&T International Symposium on Electronic Imaging 2021
286-4 Imaging and Multimedia Analytics in a Web and Mobile World 2021
(a)                                  (b)                                   (c)                               (d)
                                   Figure 6: Object detection results on sample images from the testing subset.

       Dietary Management, pp. 63–70, October 2016, Amster-                 [22] Juan Fontana, Muhammad Farooq, and Edward Sazonov,
       dam, The Netherlands.                                                     “Automatic ingestion monitor: A novel wearable device for
[14]   Parisa Pouladzadeh, Shervin Shirmohammadi, and Rana Al-                   monitoring of ingestive behavior,” IEEE Transactions on
       maghrabi, “Measuring calorie and nutrition from food im-                  Bio-medical Engineering, vol. 61, no. 6, pp. 1772–1179,
       age,” IEEE Transactions on Instrumentation and Measure-                   June 2014.
       ment, vol. 63, pp. 1947–1956, August 2014.                           [23] Muhammad Farooq and Edward Sazonov, “A novel wear-
[15]   Marios Anthimopoulos, Joachim Dehais, Peter Diem, and                     able device for food intake and physical activity recogni-
       Stavroula Mougiakakou, “Segmentation and recognition of                   tion,” Sensors, vol. 16, no. 7, pp. 1067, July 2016.
       multi-food meal images for carbohydrate counting,” 13th              [24] Muhammad Farooq and Edward Sazonov, “Accelerometer-
       IEEE International Conference on BioInformatics and Bio-                  based detection of food intake in free-living individuals,”
       Engineering, pp. 1–4, February 2013, Chania, Greece.                      IEEE Sensors Journal, vol. 18, no. 9, pp. 3752–3758, March
[16]   Stergios Christodoulidis, Marios Anthimopoulos, and                       2018.
       Stavroula Mougiakakou, “Food recognition for dietary as-             [25] Abul Doulah, Tonmoy Ghosh, Delwar Hossain, Masudul
       sessment using deep convolutional neural networks,” Pro-                  Imtiaz, and Edward Sazonov, ““Automatic Ingestion Mon-
       ceedings of the International Conference on Image Analy-                  itor Version 2” — A novel wearable device for automatic
       sis and Processing, pp. 458–465, September 2015, Genoa,                   food intake detection and passive capture of food images,”
       Italy.                                                                    IEEE Journal of Biomedical and Health Informatics, vol.
[17]   Eduardo Aguilar and Petia Radeva, “Food recognition by                    25, no. 2, pp. 568–576, February 2021.
       integrating local and flat classifiers,” Proceedings of the          [26] Oliver Amft, Martin Kusserow, and Gerhard Tröster, “Bite
       Iberian Conference on Pattern Recognition and Image Anal-                 weight prediction from acoustic recognition of chewing,”
       ysis, pp. 65–74, July 2019, Madrid, Spain.                                IEEE Transactions on Biomedical Engineering, vol. 56, no.
[18]   Parisa Pouladzadeh, Pallavi Kuhad, Sri Vijay Bharat Peddi,                6, pp. 1663–1672, April 2009.
       Abdulsalam Yassine, and Shervin Shirmohammadi, “Food                 [27] Juan M Fontana, Janine A Higgins, Stephanie C Schuck-
       calorie measurement using deep learning neural network,”                  ers, France Bellisle, Zhaoxing Pan, Edward L Melanson,
       Proceedings of the International Instrumentation and Mea-                 Michael R Neuman, and Edward Sazonov, “Energy intake
       surement Technology Conference, pp. 1–6, May 2016,                        estimation from counts of chews and swallows,” Appetite,
       Taipei, Taiwan.                                                           vol. 85, pp. 14–21, February 2015.
[19]   Prabha Sundaravadivel, Kavya Kesavan, Lokeshwar Kesa-                [28] Xin Yang, Abul Doulah, Muhammad Farooq, Jason Par-
       van, Saraju P Mohanty, and Elias Kougianos, “Smart-log: A                 ton, Megan McCrory, Janine Higgins, and Edward Sazonov,
       deep-learning based automated nutrition monitoring system                 “Statistical models for meal-level estimation of mass and en-
       in the iot,” IEEE Transactions on Consumer Electronics,                   ergy intake using features derived from video observation
       vol. 64, no. 3, pp. 390–398, August 2018.                                 and a chewing sensor,” Scientific Reports, vol. 9, December
[20]   Joachim Dehais, Sergey Shevchik, Peter Diem, and                          2019.
       Stavroula G Mougiakakou, “Food volume computation for                [29] Jose Luis Pech Pacheco, Gabriel Cristobal, J. Chamorro-
       self dietary assessment applications,” Proceedings of the                 Martinez, and J. Fernandez-Valdivia, “Diatom autofocusing
       IEEE International Conference on BioInformatics and Bio-                  in brightfield microscopy: A comparative study,” Proceed-
       Engineering, pp. 1–4, 2013, Chania, Greece.                               ings of the 15th International Conference on Pattern Recog-
[21]   Edward Sazonov and Juan Fontana, “A sensor system                         nition, vol. 3, pp. 314–317, February 2000, Barcelona,
       for automatic detection of food intake through non-invasive               Spain.
       monitoring of chewing,” IEEE Sensors Journal, vol. 12, no.           [30] Shaoqing Ren, Kaiming He, Ross Girshick, and Jian Sun,
       5, pp. 1340–1348, May 2012.                                               “Faster r-cnn: Towards real-time object detection with re-

IS&T International Symposium on Electronic Imaging 2021
Imaging and Multimedia Analytics in a Web and Mobile World 2021                                                                             286-5
gion proposal networks,” IEEE Transactions on Pattern           development of wearable devices for monitoring of food intake;
     Analysis and Machine Intelligence, vol. 39, no. 6, pp. 1137–    physical activity and gait; and cigarette smoking. This research
     1149, June 2017.                                                was recognized by several awards and supported by the NIH,
[31] Tsung-Yi Lin, Michael Maire, Serge Belongie, James Hays,        NSF, NAS, and other agencies, industries and foundations.
     Pietro Perona, Deva Ramanan, Piotr Dollár, and C. Zitnick,
     “Microsoft COCO: Common Objects in Context,” Proceed-                Edward J. Delp is the Charles William Harrison Distin-
     ings of the European Conference on Computer Vision, vol.        guished Professor of Electrical and Computer Engineering and
     8693, pp. 740–755, April 2014, Zurich, Switzerland.             Professor of Biomedical Engineering at Purdue University. His
[32] Olga Russakovsky, Jia Deng, Hao Su, Jonathan Krause,            research interests include image and video processing, image
     Sanjeev Satheesh, Sean Ma, Zhiheng Huang, Andrej Karpa-         analysis, computer vision, image and video compression, multi-
     thy, Aditya Khosla, Michael Bernstein, Alexander C. Berg,       media security, medical imaging, multimedia systems, communi-
     and Li Fei-Fei, “ImageNet Large Scale Visual Recognition        cation and information theory.
     Challenge,” International Journal of Computer Vision, vol.
     115, no. 3, pp. 211–252, April 2015.
[33] Kaiming He, Xiangyu Zhang, Shaoqing Ren, and Jian Sun,
     “Deep residual learning for image recognition,” Proceed-
     ings of the IEEE Conference on Computer Vision and Pat-
     tern Recognition, pp. 770–778, June 2016, Las Vegas, NV.

Author Biography
     Yue Han received his B.S degree with distinction from Pur-
due University in 2019. He is currently pursuing a Ph.D. degree
at Purdue University and working as a research assistant in the
Video and Image Processing Laboratory at Purdue University.
His research interests include image processing, computer vision,
and deep learning.

     Sri Kalyan Yarlagadda is a machine learning scientist at
Overjet. He received his B.Tech in Electrical Engineering from
Indian Institute of Technology Madras in July 2015 and his Ph.D
in Electrical and Computer Engineering from Purdue University
in 2020. His research interests include image processing and
computer vision.

     Tonmoy Ghosh received the B.Sc. and M.Sc. degree in
Electrical and Electronic Engineering from the Bangladesh
University of Engineering and Technology, Dhaka, Bangladesh,
in 2012 and 2016, respectively. Currently, he is doing his Ph.D.
in Electrical and Computer Engineering at The University
of Alabama, Tuscaloosa, USA. His research interests include
applying signal processing and machine/deep learning-based
method to address engineering problems in images, wearable
sensors, with a focus on computer-aided detection and health
monitoring applications.

     Fengqing Zhu is an Assistant Professor of Electrical and
Computer Engineering at Purdue University, West Lafayette,
Indiana. Dr. Zhu received the B.S.E.E. (with highest distinction),
M.S. and Ph.D. degrees in Electrical and Computer Engineering
from Purdue University in 2004, 2006 and 2011, respectively.
Her research interests include image processing and analysis,
video compression and computer vision. Prior to joining Purdue
in 2015, she was a Staff Researcher at Futurewei Technologies
(USA).

      Edward Sazonov received the Ph.D. degree in Computer
Engineering from West Virginia University in 2002. Currently he
is a James R. Cudworth endowed Professor in the ECE Depart-
ment at the University of Alabama. His research is focused on

                                                                                   IS&T International Symposium on Electronic Imaging 2021
286-6                                                                   Imaging and Multimedia Analytics in a Web and Mobile World 2021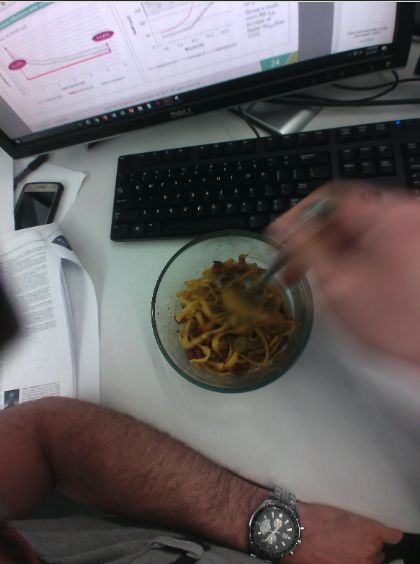
JOIN US AT THE NEXT EI!

 IS&T International Symposium on

 Electronic Imaging
 SCIENCE AND TECHNOLOGY

Imaging across applications . . . Where industry and academia meet!

• SHORT COURSES • EXHIBITS • DEMONSTRATION SESSION • PLENARY TALKS •
• INTERACTIVE PAPER SESSION • SPECIAL EVENTS • TECHNICAL SESSIONS •

                  www.electronicimaging.org
                                                             imaging.org
You can also read