In this issue LATEST DUBLIN ECONOMIC DATA IHS MARKIT DUBLIN PMI MASTERCARD SPENDINGPULSE IN SEARCH OF THE GREEN SHOOTS OF RECOVERY - Dublin City ...
←
→
Page content transcription
If your browser does not render page correctly, please read the page content below
issue 22
                                September 2020

In this issue
LATEST DUBLIN
ECONOMIC DATA
IHS MARKIT DUBLIN PMI
MASTERCARD SPENDINGPULSE
IN SEARCH OF THE GREEN SHOOTS
OF RECOVERY

PAGE 12                                    PAGE 14
STABILISE, RESET, RECOVER                  RECOVERY OFFERS
                                           OPPORTUNITIES FOR MORE
                                           SUSTAINABLE PRACTICES

EOGHAN HANRAHAN
REGIONAL DIRECTOR, ENTERPRISE              JULIET PASSMORE
IRELAND                                    ECONOMIST, DUBLIN CITY COUNCIL
WELCOME

   HIGHLIGHTS
       Employment levels in Dublin fell by
       over 33,000 YoY in Q2 2020 with
       a particularly acute reduction in
       employement in the accommodation
       & food sector. Unemployment rose to
       5.3% in the quarter, though it is likely
       to be higher and close to the current
       national COVID-19 adjusted rate of
       15.4%.
                                                    WELCOME TO THE SEPTEMBER
       Office vacancy rates increased in
       both Dublin 2/4 and the Capital’s            2020 ISSUE OF THE DUBLIN
       suburbs with many proposed
       transactions delayed or cancelled
       due to COVID-19.
                                                    ECONOMIC MONITOR

                                                    T
                                                             he Dublin Economic Monitor                   for the economy remain highly
       Public transport usage fell by over
                                                             is a joint initiative on behalf              challenging, and far from clear.
       76% YoY to 14 million passenger trips
                                                             of the four Dublin Local                         The articles this quarter continue
       in Q2 2020. All four modes of public
                                                    Authorities, and is designed to be                    a focus on COVID-19. The first,
       transport in Dublin were impacted by
                                                    of interest to those living and doing                 from Eoghan Hanrahan of Enterprise
       domestic travel restrictions and trends
       towards remote working.                      business in Dublin or considering                     Ireland, highlights the various
                                                    locating here. This report is produced                Enterprise Ireland supports which are
       Activity at Dublin Port continued to         by Grant Thornton. IHS MARKIT                         available to help SMEs through this
       decline in the second quarter of 2020,       deliver the Dublin Purchasing                         crisis. The second article is by Juliet
       falling by over 17% YoY. Imports were        Managers' Index (PMI).                                Passmore, an Economist at Dublin City
       most strongly affected and reduced               We also partner with MasterCard                   Council, and centres on the results of
       by more than 20% YoY.                        to use their SpendingPulse reports to                 the latest “Your Dublin Your Voice”
                                                    better understand retail and tourism                  survey which looks at the type of city
       Residential property prices in the           spending patterns in Dublin and                       Dubliners would like to see emerge
       Capital fell for a second consecutive        nationally (see centrefold supplement).               from the crisis.
       quarter as transaction levels in the             The data presented in this Monitor                    The next edition will be published
       market receded. Construction activity        is beginning to provide a clearer picture             in December 2020.
       also contracted in Q2 and will be            of the severe impact that COVID-19 is
       expected to further affect housing           having on our economy. As we move                           www.dublineconomy.ie
       supply in the coming quarters.               tentatively away from restrictions
                                                    towards re-opening, the prospects                           @DCCEconDev
       Passenger throughput at Dublin
       Airport contracted from 6.7 million in
                                                    Dublin City          South Dublin County            Fingal County           Dún Laoghaire Rathdown
       Q1 2020 to just 156,000 in Q2 as             Council              Council                        Council                 County Council
       international travel restrictions severely
                                                    This document provides general information on the Dublin economy. It is not intended to be used
                                                    as a basis for any particular course of action or as a substitute for financial advice. The document is
                                                    produced independently by Grant Thornton and Packed.House; the views and opinions expressed are
       cover image: peter kavanagh
                                                    those of the relevant author, and do not necessarily reflect the views of the Dublin Local Authorities.
                                                    The Dublin Local Authorities disclaim all liability in connection with any action that may be
                                                    taken in reliance of this document, and for any error, deficiency, flaw or omission contained in it.

2 //
ECONOMY

GLOBAL ECONOMY                                                             NATIONAL ECONOMY
Initial hopes for a 'V' shaped global economic recovery as the             Ireland’s economy entered 2020 in robust form. Labour market
COVID-19 restrictions were initially relaxed have faded rapidly,           growth had continued in the face of Brexit uncertainty and the
with a growing body of opinion forming around a positon that               pressing economic questions were about whether the economy
the economic recovery will take time and significant intervention          had reached full employment. The contrast between then and
from governments. The sheer scale of the economic decline, and             now remains difficult to comprehend. From a low point in January
tentative nature of how economies are emerging (and potentially            when c.120,000 people were unemployed, the live register and
re-entering) lockdowns makes forecasting exceptionally difficult.          people in receipt of the Pandemic Unemployment Payment or
The uncertainty has prompted the OECD to prepare an economic               Temporary Wage Subsidy scheme peaked at 1,083,352 people
outlook based on two possible scenarios: one where the pandemic            at the beginning of May. The split across age groups has been
remains under control (a single hit scenario) and one where a second       consistent across the pandemic, with approximately half of
wave gathers pace later this year (a double hit scenario). In the single   claimants aged 25-44. Watching how this evolves over the
hit scenario, global economic activity falls 6% in 2020 and OECD           coming months will help determine if any one age cohort is being
unemployment climbs to 9.2% from 5.4% in 2019. Five years of               particularly impacted more than others.
income growth across the OECD economy is lost in this scenario              unemployment rate, ireland, august 2020
by 2021.
    A double hit scenario would see economic output fall by close
to 7.6% this year, before climbing back and growing by 2.8% in
2021. This scenario sees the unemployment rate hit 10% with little
recovery in employment in 2021.
    The economic impact of strict and relatively lengthy lockdowns
in Europe will be particularly harsh. Euro area GDP is expected to
plunge by 11.5% this year if a second wave breaks out, and by over
9% even if a second hit is avoided. GDP growth in the United States
is forecast to decline by 8.5% in a double hit scenario, and by 7.3%
with a single hit. In Japan, growth is expected to fall by 7.3% in a
double hit, and by 6% if a second wave of the virus is averted.
    In both scenarios, the recovery, after an initial, rapid resumption         60 years old          Total Live
                                                                                                                                             Register
pandemic levels, and the crisis will leave long-lasting scars - a fall
in living standards, high unemployment and weak investment. Job            While the number of people on various labour market supports is
losses in the most affected sectors, such as tourism, hospitality and      declining, the labour market is a long way from recovery, further
entertainment, will particularly hit low-skilled, young, and informal      removing hopes of a ‘V’ shape recovery. The precise path for the
workers. Aware of the potential for lasting economic damage from           economy is uncertain. Much will depend on consumer confidence
the pandemic, governments are injecting significant sums into job          and how willing we are to re-engage in spending. The extent to
protection and economic stimulus measures in an effort to instil           which the July stimulus initiatives prevent lasting or permanent
confidence back into consumers and businesses. The success or              scarring on the economy have a significant role to play also. As
otherwise of these initiatives will play a crucial role in determining     such, providing an economic forecast is exceptionally difficult. The
                                                                           Central Bank’s current estimate is that the Irish economy is set to
oECD Economic Forecast                                                     experience a substantial decline in both economic output (-9.0%)
                                                                           and employment (-11.9%) in 2020. The unemployment rate is
                                                                           expected to reach 14.5% and Investment is predicted to decline by
                                                                           -34.7%. The Irish economy has now entered into a recession, but
                                                                           a bounce back of 5.7% growth in GDP is expected in 2021 with
                                                                           the unemployment rate falling to 9.2%.
                                                                           irish macroeconomic growth forecasts
                                                                                                                                      2020           2021
                                                                                                                                       %F             %f
                                                                            gDp                                                  -9.0%               5.7%
                                                                            underlying domestic demand                            -9.5%              4.6%
                                                                            private consumption                                  -10.1%              3.9%
                                                                            government consumption                                 8.0%            -0.3%
                                                                            investment                                          -34.7%              9.0%
                                                                            exports                                               -4.2%             5.0%
                                                                            imports                                              -12.3%              4.7%
               Ireland - Double Hit        OECD - Double Hit
                                                                            unemployment rate                                     14.5%              9.2%
               Ireland - Single Hit        OECD - Single Hit
                                                                            employment                                           -11.9%              7.6%
source: oecd

                                                                           source: Central Bank of Ireland

                                                                                                                                                          // 3
DUBLIN ECONOMY
IN SEARCH OF THE GREEN
SHOOTS OF RECOVERY
Q2 indicators show the depth of the economic decline but there are glimpses of reignition
The COVID-19 pandemic has wreaked havoc on society and has
thrown the economy into a deep and damaging decline. The early
Few could have evidence of the impact of the shutdown on the economy, which was
coming through in the last Dublin Economic Monitor, is further
predicted the severity
evident in this issue.
The Q2 Purchasing Manager’s Index (PMI) for Dublin, which
of the shutdown on the covers the deepest phase of lockdown, was 25.2 (where a figure
below 50 represents a contraction). This, unsurprisingly, is the
sharpest contraction on record. As the economy went into
Dublin economy but deep freeze, new orders also collapsed, falling to 24.3.
Take up of office space in Q2 was the lowest ever recorded, with
there are tentative proposed transactions delayed or cancelled due to COVID-19.
Key sectors for the Dublin economy suffered dramatic declines
in Q2, as feared, leaving employment in Q2 2020 35,000
signs of a recovery lower than in Q1. Almost 4 in 10 of the Q2 losses came in the
accommodation and restaurant sector which lost 13,700 jobs.
starting.”
Total retail sales were significantly lower in Dublin during Q2,
especially on entertainment (-80% YoY) and discretionary
goods (-65% YoY).
4 //
DUBLIN ECONOMY

      The economy is now at a point of inflection. Key indicators
have recorded downturns that surpass or are broadly equivalent
to the worst of the Global Financial Crash a decade ago and
as the economy begins re-opening, there is uncertainty around
the type of recovery and its likely duration. In Dublin, the live
register plus pandemic supports peaked at 310,000 at the end
of May. For context, that is about 10 times the number of
people who were unemployed in Dublin in 2019 and two and
a half times more than unemployment in the whole State at the
end of 2019. Since that May peak, and the gradual reopening
of the economy, 112,000 people have been removed from the
live register/pandemic payments across Dublin. There are now
just below 200,000 people claiming income support in Dublin
as the economy edges back towards full re-opening. The CSO’s
Business Impact of COVID-19 survey shows that more than 96%
of enterprises were trading in some capacity at the end of July.
Almost a fifth of trading businesses had reopened in the preceding
four weeks. There were obviously variances across different
sectors, with 20% of accommodation and food service businesses
still closed.
      Continued progress will depend on how successful we are at
containing COVID-19, and whether we avoid the ‘double hit’
scenario that the OECD has modelled as a potential path for
the economy. Much will also depend on consumer and business
confidence.

PATCHY CONFIDENCE
    Following three consecutive monthly increases in confidence,
the Bank of Ireland Economic Pulse index posted a lower
reading of 59.3 in August at the State level. The index, which
combines the results of the Consumer and Business Pulses was
2.5 points lower than July and 19.8 points lower than a year
ago. Households are more subdued about their current financial
situation this month and less minded to consider it a good time
to purchase big-ticket items. 21% considered it a good time to
purchase furniture or electrical goods compared to 26% in July.
In Dublin, the sentiment index is calculated on a 3 month moving         withdraw from a proposed lease of 18,000m2 of office space in the
average basis, and showed that sentiment increased markedly in           Docklands is a prime example of this.
the June to August period (+7.4 points to 60.7) compared with                Revitalising the city and bringing people back is a key
the May to July period.                                                  challenge for Dublin. Initiatives such as the pedestrianisation
    The Dublin MasterCard SpendingPulse data bears out a                 of some of the Capital’s streets has been successful in providing
picture of a nervy consumer. Total retail sales in Dublin are 12%        safe spaces for social distancing and increased footfall. There is a
lower in Q2 than the same quarter one year ago. Spending on              long climb back to pre-COVID-19 levels of city centre activity.
necessities did increase by 16.7% in Q2 compared to declines in          Public transport usage statistics show 45 million fewer trips were
entertainment (-79%), discretionary spend (-57%) and household           taken in Q2 than one year previously. Hotels, used to operating
goods (-21%). As is well documented, the shift to online retail          at occupancy levels in excess of 80% in recent years, filled 16% of
gathered momentum during the lockdown. MasterCard’s data                 their rooms in July.
records a 43% YoY increase in ecommerce by Dubliners.
                                                                         A MUCH NEEDED STIMULUS PACKAGE
A CHANGING CITY?                                                              The downturn in our economic fortunes has prompted a
    The shift to online retail and the extent to which a trend towards   series of stimulus support packages from the Government, aimed
home working had to accelerate due to the lockdown is prompting          at protecting jobs and businesses through a recovery. The July
questions about the future of city centres and commercial spaces.        Stimulus contains a package of initiatives such as the employment
While it is too early to predict how commercial property demand          wage support scheme, increased funding for restart grants and
will evolve, there has been an increase in vacancy levels in Dublin      extensions to commercial rates waivers. Active travel initiatives
during Q2. There are reports of activity that was delayed in Q1          will be supported and, on the demand side, a tax credit for
and Q2 coming back in Q3 but in the medium to long term, there           spending on ‘staycationing’ is on offer. Quarter 3 and beyond
could be a downward shift in demand as people continue with a            will determine how effective these various stimulus measures are
blend of home and office working. Google's recent decision to            at rebooting the Dublin economy.

                                                                                                                                         // 5
DUBLIN ECONOMIC INDICATORS

       DUBLIN ECONOMIC
       INDICATORS

Employment slowdown in q1                                                 dublin & national unemployment rate % (sa)
turns to job slump in q2
                                                                                                                             National Max 16%
                                                                q2 '20
                                                                                                                             Dublin Max 13.7%
 dublin unemployment (sa)                                         5.3%
 year on year change % points                                     +0.9
 dublin employment '000s (sa)                                    683.1
 year on year change '000s (sa)                                  -33.6
source: cso labour force survey (lfs). dublin seasonally adjusted by
grant thornton

Employment levels in the Dublin economy fell by over 33,000
YoY in Q2 2020 as the full impact of COVID-19 related job
losses began to emerge. The Capital’s unemployment rate rose
above the national rate to 5.3% in Q2, erasing two years of
labour market growth. This rate is not a full reflection of the
labour market situation however, as it excludes those on income
supports. It is likely to be closer to the monthly, inclusive                                       Dublin               National

national rate of 15.4% recorded in August 2020.                           source: cso lfs. dublin seasonally adjusted by grant thornton

Employment takes some heavy                                                        employment by broad sector '000s (sa)
hits but some bright spots
                                                                                                                                                   Max:
                                                                                                                                                 712,680
                                                                q2 ' 20                                                                                    683,208

 services employment '000s                                       605.2
 year on year change '000s                                       -27.6
 industry & constr, employment '000s                              78.0
 year on year change '000s                                         -1.9
source: cso lfs. seasonally adjusted by grant thornton
note: this series has been re-calibrated since the last issue

Key sectors for the Dublin economy suffered dramatic declines
in Q2, as feared, leaving employment in Q2 2020 35,000
lower than in Q1. Almost 4 in 10 of the Q2 losses came in
the accommodation and restaurant sector which lost 13,700
jobs. Transport and storage (-9,900) and Administrative jobs
(-9,800) declines made up the top three most affected sectors.
                                                                             Private Sector Services         Public sector         Industry      Construction
Some sectors (e.g ICT, health and education) did post increases
in employment. The largest YoY increase was in ICT which
                                                                           source: cso lfs. seasonally adjusted by grant thornton
increased by 9,000.                                                        note: individual sector values may not sum to total due to rounding

6 //
DUBLIN ECONOMIC INDICATORS

Transactions returning with                                                   residential property price index (2005 = 100)
some decline in prices evident
                                                                                                                             Dublin Max 107.8
                                                            jun ' 20
 property price index dublin                                  104.3
 year on year % change                                         -0.7
 property price index national excl dublin                    102.9
 year on year % change                                         +1.0
source: cso.

Property transactions bounced back well since the lockdown
lifted but are down 33% YoY to June across Ireland. In Dublin,
property prices recorded a quickening decline of -0.7% YoY
compared to -0.3% in May. The Dublin property price index,
at 104.3, has returned to the December 2019 level. It is
also diverging from the rest of the country with the national
index excluding Dublin posting YoY growth of 1% in June,
continuing a run of growth stretching back to the start of 2014.                                      Dublin                 National excl. Dublin
                                                                              source: cso.

Downward pressure on rents                                                                              residential rents € per month
                                                                                                                    Dublin Max: €1,709

                                                            q1 ' 20
 dublin avg residential rent € per month                     1,709
 year on year change €                                         +73
source: rtb.

Residential rent inflation in Dublin slowed to 4.5% YoY in Q1
2020. This was the weakest rate of growth since Q2 2014. Further
declines may be expected in Q2 as COVID-19 has seen holiday
units move into the private rented sector, and has prompted
the introduction of a rent increase moratorium. Rent growth
accelerated in the GDA excl. Dublin to 6% YoY in Q1 2020, but
slowed considerably to 5.8% YoY outside the GDA.

                                                                                     Dublin             Greater Dublin Area (excl. Dublin)           Outside GDA

                                                                              source: rtb. note: gda (ex dublin) is kildare, meath and wicklow.

restrictions will eclipse                                                   dublin housing commencements & completions
strong start to the year                                                                                     Commencements Max: 3,218

                                                            q2 ' 20
 total house commencements                                    1,154                                            Completions Max: 2,043

 year on year change                                         -435
 total house completions                                       840
 year on year change                                         -648
source: dhplg, cso
note: house commencement data is not seasonally adjusted

Across Dublin, 840 homes were completed in Q2, 43% lower than
in Q2 2019. A rapid increase in commencements at the start of
the year (in Q1 3,218 commencements was over 40% more than a
year previous) fell away to 1,154, a decline of over 2,000 QoQ. The
outlook remains highly uncertain for the rest of the year. To match
2019's figures, 4,447 completions would be needed in the second
half of 2020. Achieving this rate of completions is unlikely given                                   Completions                 Commencements

the average per quarter of the past five years is 1,254 and the sector is     source: cso, dhplg

adjusting to socially distanced working practices.

                                                                                                                                                              // 7
DUBLIN ECONOMIC INDICATORS
Stagnation in Dublin office rent dublin office rents index (2006 = 100)
growth continues into 2020
q2 '20
city centre office rent index 118.2
year on year % change +0.0
south suburbS office rent index 118.0
year on year % change +0.0
source: CBRE
For the tenth consequtive quarter, office rents in Dublin's
city centre remained unchanged in Q2 2020, marking the
longest spell of stagnation in the history of the series. Rents also
remained unchanged in the South Dublin Suburbs in the quarter,
marking a year of unchanged prices. COVID-19 restrictions
mean that demand will be softer for the rest of the year, but the
pause in construction activity should guard against oversupply City Centre South Suburbs
and price declines in the short-term. However, the outlook could
weaken with a prolonged downturn in the economy. source: cbre.
dublin office vacancy rates rise dublin office space vacancy rates %
substantially
q2 '20
vacancy rate % dublin 2/4 5.7
year on year change % points +0.2
vacancy rate % dublin suburbs 7.6
year on year change % points +0.7
source: cbre.
Office vacancy rates in Dublin 2/4 rose to 5.7% in Q2 2020,
back to levels last seen in Q1 2019. Vacancy rates in the Dublin
suburbs followed a similar trajectory to stand at 7.6%. Take-up
of office space in Q2 was the lowest ever recorded, with the
city centre accounting for over two-thirds of activity, and many
proposed transactions delayed or cancelled due to COVID-19.
There are reports that activity has picked up in Q3, with a Dublin 2/4 Dublin Suburbs
number of proposed deals re-emerging. source: cbre.
travel restrictions limit public public transport million trips (sa)
transport usage
q2' 20
public transport million trips (sa) 14.0
Year on Year % Change -76.5%
source: nta. seasonally adjusted by grant thornton.
14 million passenger trips (SA) were undertaken in Dublin
in Q2 2020. This was 45.7 million fewer trips (-76.5%)
on the same period in 2019 and reflects a fuller impact of
COVID-19 prevention measures on the Irish economy.
Passenger trips on all four modes of public transport fell in
Q2 as people respected the lockdown and requirement for
essential travel only. Irish Rail recorded the largest decrease
in trips (-84%), followed by Luas (-80.5%), while trips on
Dublin Bus and Bus Eireann fell by -72.3% and -71.6% Bus Éireann Dublin City Bus Irish Rail Luas
respectively.
source: nta. seasonally adjusted by grant thornton.
note: provisional data verified by all operators
8 //September 2020
DUBLIN
Mastercard SpendingPulse
TM
Dublin Mastercard SpendingPulse Delivering Unique
Insights for Consumer and Tourism Spend.
KEY HIGHLIGHTS YEAR-ON-YEAR Q2 2020*
-12.0%
OVERALL
-80.0%
OVERSEAS
SALES TOURISM SPEND
+16.7% -56.7% -21.0% -79.1%
NECESSITIES DISCRETIONARY HOUSEHOLD GOODS ENTERTAINMENT
*RETAIL SALES VALUE (SA)
+43.0%
ECOMMERCETM
DUBLIN Mastercard SpendingPulse | September 2020
PANDEMIC DRIVES SEVERE REDUCTIONS IN DUBLIN
RETAIL SPENDING
TOTAL RETAIL SALES INDEX (SA)
110
-12.0%
YoY
103
-14.1%
YoY
DUBLIN IRELAND
Retail spending in the Capital’s economy contracted dramatically Similar patterns were evident on a QoQ basis, with retail
in Q2 2020 as restrictions related to the COVID-19 pandemic truly spending declining by 13.8% QoQ in Dublin, and 16% nationally.
took hold. Sales fell by 12.0% YoY (SA*), the first contraction in Discretionary and entertainment expenditure fell substantially, but
retail spending since the SpendingPulse series began in Q2 2014. eCommerce and spending on necessities rose to new peaks in the
The pandemic impacted most bricks-and-mortar retail expenditure, quarter. When coupled with the fact that the Irish population has
with significant YoY declines recorded in the discretionary and been saving considerable amounts since the pandemic began,
household good categories in particular. The contractions in retail deep reductions in overall consumer spending of this nature will be
spending patterns in Dublin were less severe than those at the expected to have had significant deflationary effects on domestic
national level, where consumer expenditure reduced by over 14% economic activity.
YoY. This was a common theme in countries across the world in
the quarter.
Restrictions on bricks and mortar retail activity contributed to declines in retail sales growth rates in Q2 2020
across both Dublin and Ireland. Sectoral divergences were stark with discretionary spending under extreme
pressure while expenditure on necessities surged.
Michael McNamara
GLOBAL HEAD OF SPENDING PULSE, MASTERCARD
DUBLIN RETAIL SALES VALUE INDEX (SA)
-12.0% 109.9 -13.8%
Q2 2020 100 = Q1 2014 Q2 2020
YoY CHANGE DUBLIN SALES QoQ CHANGE
IN DUBLIN SALES INDEX INDEX VALUE IN DUBLIN SALES INDEX
METHODOLOGY
A macro-economic indicator, SpendingPulse™ reports on national and Dublin retail sales and is based on aggregate sales activity in the MasterCard
payments network, coupled with estimates for all other payment forms, including cash and cheque. This information has been grossed up to present
an estimate of the total retail sales of retail businesses in Ireland and Dublin to both residents and tourists. Data is seasonally adjusted but is not
adjusted for inflation. MasterCard SpendingPulse™ does not represent MasterCard financial performance. SpendingPulse™ is provided by MasterCard
Advisors, the professional services arm of MasterCard International Incorporated. See www.dublineconomy.ie for more info on methodology.
2 *All values are Seasonally Adjusted by Grant ThorntonTM
DUBLIN Mastercard SpendingPulse | September 2020
METHOD: ECOMMERCE COVID-19 RESTRICTIONS
266 ACCELERATE SHIFT TO
ECOMMERCE
+43.0%
YoY
COVID-19 restrictions have decimated retail spending across
237 many sectors of the Dublin economy, while accelerating the
+41.0%
YoY pre-existing trend towards eCommerce. Consumers in the
Capital have switched from spending in hotels, bars and
restaurants (Entertainment, -79.1% YoY), in favour of grocery
outlets (Necessities, +16.7% YoY) in response to restrictions on
travel, hospitality and retail. Worryingly, spending on big-ticket
household goods has also drastically reduced, and this suggests
that Dublin consumers expect the crisis to last beyond the short-
to- medium terms. Expenditure in department and clothing stores
also declined (Discretionary, - 56.7% YoY), and may be linked to
IRELAND DUBLIN
a shift to eCommerce, where sales grew by 43% YoY. Dublin
Non store Retailers including Electronic Shopping and Mail-Order Houses,
Direct Selling Establishments.
mirrors the national picture, where expenditure on necessities
and online shopping also grew exponentially, and bricks-and-
mortar sales generally dropped significantly in Q2 2020.
RETAIL CATEGORY: DISCRETIONARY RETAIL CATEGORY: NECESSITIES
145
+16.7%
YoY
54 135
-56.7% +15.2%
YoY YoY
38
-67.6%
YoY
IRELAND DUBLIN IRELAND DUBLIN
Discretionary Retail: Department Stores and Clothing Stores. Grocery: all food and beverage stores.
RETAIL CATEGORY: ENTERTAINMENT RETAIL CATEGORY: HOUSEHOLD GOODS
125
30 -21.0%
YoY
-79.1%
YoY
32 113
-75.8%
YoY -24.0%
YoY
IRELAND DUBLIN IRELAND DUBLIN
Hotels, restaurants and bars. Household furniture, electronics and hardware.
*All values are Seasonally Adjusted by Grant Thornton 3TM
DUBLIN Mastercard SpendingPulse | September 2020
OVERSEAS TOURISM SPENDING FALLS TO NEGLIGIBLE
LEVELS
Overseas tourism spending in the Dublin economy collapsed 97.3% YoY nationally. The Chinese market is smaller than the
in Q2 2020 as international travel restrictions and quarantine other markets listed, and so negligible expenditure levels by
requirements impacted overseas visitor numbers. Just 156,000 tourists from this market will have materialised in Q2.
passengers passed through Dublin Airport in Q2 2020, while Of greater significance are the drastic reductions in
Dublin Port also recorded significant YoY declines in passenger expenditure amongst tourists from Europe and the US.
numbers. As a result, the seasonally adjusted index for tourism Spending in Dublin by tourists from our closest neighbour
spending fell to just 34.8 in the Capital in Q2 2020. This in the UK fell by 73.3% YoY, while the French and German
represented a steep reduction compared to the index readings indices fell by 84.1% and 63.6% respectively. A similar
for both Q1 2020 (202.0) and the same quarter in 2019 (179.5). scenario emerged for the US market, with spending falling by
The national index also descended rapidly, falling from 166.8 in over 57% YoY. In all instances Dublin fared worse than Ireland
Q1 2020 to 31.7 in Q2. It is worth noting that tourism spending as a whole.
did not fall closer to zero as citizens of overseas countries Such weak index readings will be expected to extend in to
residing in Ireland are categorised as ‘tourists’ by MasterCard. Q3 as travel restrictions have remained in place through the
On a country basis, the index for China fell by the largest major tourism months of summer, though ‘staycationing’ by
proportion, reducing by 94.3% YoY in the Capital and by Irish residents may provide some respite for the sector.
DUBLIN AND IRELAND TOURIST SPEND BY ORIGIN - Q2 2020 (SA)
OVERALL
-81.4% -80.6% -72.9% -73.3% -52.7% -57.3%
YOY CHANGE IN YOY CHANGE IN YOY CHANGE IN YOY CHANGE IN YOY CHANGE IN YOY CHANGE IN
SPENDING IN SPENDING IN SPENDING IN SPENDING IN SPENDING IN SPENDING IN
IRELAND DUBLIN IRELAND DUBLIN IRELAND DUBLIN
-54.9% -63.6% -75.6% -84.1% -97.3% -94.3%
YOY CHANGE IN YOY CHANGE IN YOY CHANGE IN YOY CHANGE IN YOY CHANGE IN YOY CHANGE IN
SPENDING IN SPENDING IN SPENDING IN SPENDING IN SPENDING IN SPENDING IN
IRELAND DUBLIN IRELAND DUBLIN IRELAND DUBLIN
IRELAND DUBLIN
IRELAND TOURISM SPEND SALES INDEX (SA) DUBLIN TOURISM SPEND SALES INDEX (SA)
Q1 2014 = 100 Q1 2014 = 100
31.7 34.8
Q2 2017 Q2 2018 Q2 2017 Q2 2018
Q2 2019 Q2 2020 Q2 2019 Q2 2020
4 *All values seasonally adjusted by Grant Thornton.DUBLIN ECONOMIC INDICATORS
Signs of renewed passenger dublin airport passangers '000s (sa)
movement in July
Max: 8.22 million
q2 '20
total passengers '000s (sa) 156
year on year change '000s (sa) -8,009
source: cso.
In normal times, more than 8 million passengers travel
through Dublin airport each quarter. Data for Q1 and Q2
2020 shows a profound impact of COVID-19 on this typical
figure. Q1 2020 figures were 6.7m, a decline of close to 20%
on Q4 2019, and CSO data for Q2 2020 points towards a
mere 156,500 passengers travelling through the airport. Data
from Dublin Airport suggests that July traffic is improving on
the Q2 position as 381,000 passengers moved through the
airport. While this is an improvement on Q2, it was still 89%
lower than the previous July. source: cso.
continued decline in throughput at dublin port tonnage million tonnes (sa)
dublin port
Max: 9.75 million tonnes
q2 ' 20
dublin port exports million tonnes (sa) 3.46
yoy change million tonnes (sa) -0.46
dublin port imports million tonnes (sa) 4.50
yoy change million tonnes (sa) -1.18
source: dublin port. seasonally adjusted by grant thornton.
note: imports and exports may not add to total throughput due to seasonal
adjustment and rounding.
Volume declines at Dublin Port continued into a 5th successive
quarter, surpassing the 4 quarter decline of 2008/09. A YoY decline
of -17.1% was recorded in Q2 2020 as COVID-19 shutdowns
across import and export markets gripped. Import activity declined
by over 1m tonnes, or 21% QoQ while exports posted a 12%
decline. Monthly data suggests some bounce back in activity. A Total Tonnage Imports Exports
26% decline in tonnage in April was followed by a smaller decline in
May of 20.5% and 5.5% in June. source: dublin port. seasonally adjusted by grant thornton.
Hotels make tentative steps to dublin hotel average daily rates (sa)
welcoming back guests
Max: €156
jul '20
hotel occupancy rate % (sa) 16.1%
year on year change %age point -66%
index of hotel room supply (sa, july 2013=100) 108.8
year on year change % -1.9%
source: str global. seasonally adjusted by grant thornton.
The vast majority of Dublin’s hotels are receiving guests again
after their closures. Having peaked in March 2020 at 118,
the supply index fell to 52 in April before climbing back to
108.8 in July. On the demand side, the tentative steps back
to welcoming guests saw occupancy come back up to 16% in
July, a massive distance from the occupancy levels of over 80%
the city’s hotels have consistently enjoyed for at least the past
Average Daily Rate € Index of Supply
five years. The demand and supply factors this year have seen
Average Daily Rates for hotel rooms fall as low as €76 but have
now started to climb back, reaching €90 in July, -40% YoY. source: str global seasonally adjusted by grant thornton.
// 9DUBLIN IHS MARKIT PMI
decline in business activity overall ihs markit pmi (sa)
most severe on record 50 = no change increasing rate of growth ▲
rest of
overall ihs markit pmi dublin ireland
q2 2020 25.2 28.4
year on year change -29.1 -26.2
quarter on quarter change -24.7 -17.4
The contraction in Dublin’s PMI in Q2 2020, which covers the
deepest phase of lockdown, is unsurprisingly the most severe
on record and mirrors the contractions in many other markets.
Manufacturing, which had only returned to positive sentiment
in Q4 2019 after three quarters in contraction, declined in both increasing rate of contraction ▼
Q1 and Q2. Services and construction remained positive in Q1
before plummeting in Q2. The decline in the PMI was steeper
for Dublin compared to the rest of Ireland, but will be expected
to rebound in Q3 as the Capital's economy reopens. Dublin National excl. Dublin
new orders fall for first time in overall pmi new orders (sa)
a decade 50 = no change increasing rate of growth ▲
rest of
new orders dublin ireland
q2 2020 24.3 30.3
year on year change -30.0 -23.9
quarter on quarter change -25.5 -15.0
As the economy went into a deep freeze, it follows that new
orders in Dublin decreased dramatically in H1 2020. The
decline reflects a shuddering halt to a decade of expansion
of new orders. Dublin fared worse than the Rest of Ireland,
though encouragingly the lifting of the lockdown resulted in
increasing rate of contraction ▼
a stabilisation of new orders in June. Q3 data will provide a
strong indication of how sustained this rebound is, or whether
it represents a one-off release of pent up demand. Dublin National excl. Dublin
firms significantly reduce overall pmi employment growth (sa)
staffing levels 50 = no change increasing rate of growth ▲
rest of
employment growth dublin ireland
q2 2020 37.7 33.4
year on year change -15.0 -21.0
quarter on quarter change -14.2 -15.
The labour market entered 2020 in growth mode amidst
concerns over skills shortages hindering expansion in key
sectors. The contrast by the end of Q2 is hence more striking,
with the Dublin employment index falling to just below 38.
While the index has not quite reached the lows of 2009, the Q2
increasing rate of contraction ▼
figure is in the same region. The re-opening of the economy and
initiatives in the July Stimulus package will determine much of
how the series develops over the coming quarters.
Dublin National excl. Dublin
about
The Dublin Purchasing Managers’ Index® (PMI) series is produced by IHS Markit Economics, an independent research
company that produces highly-regarded surveys of business conditions in nations around the world www.markit.comDUBLIN’S INTERNATIONAL RANKINGS
INTERNATIONAL REPUTATION OF THE
DUBLIN REGION REMAINS STRONG
Internationally published benchmarks significant drawback cited, though as Irish universities’ rankings improved but
are a useful means of measuring a city’s demonstrated on page 7 of this issue, it is underperformance for research impact
performance relative to its peers, and recent reported that such costs have declined in was highlighted. Concerns also surround
indicators for Dublin confirm the city’s Dublin recently. Dublin is still considered to the maintenance of the universities’ strong
strong showing across a range of dimensions be an attractive proposition for re-location focus on internationalisation, as travel and
(see table below). by Mercer, and any reduction in rental costs mobility restrictions imposed to curb the
Dublin’s reputation as a startup hub would be expected to further improve the spread of COVID-19 are likely to impact
was recognised in the 2020 Global Startup city region’s attractiveness. upon the ability of the universities to attract
Ecosystem Report where the city was ranked The 2021 QS World University Rankings staff and students from overseas.
in a tie for 36th globally. This represented a placed Trinity College Dublin (TCD) in the In relation to the ongoing COVID-19
decline compared to 2019, but the city did highest position of universities in Ireland pandemic, innovation is a key factor in
rank in relatively high positions in a number (101st globally). The university climbed 8 addressing the challenges posed. According
of categories including local connectedness places when compared to the 2019 rankings, to a recently-developed Coronavirus
and talent. The Capital had poor scores and a significant improvement in the Innovation Map, Dublin has outperformed
compared to other locations for research, academic reputation of TCD was cited as a many of its peers in generating innovative
ecosystem value, and market reach; which core driver. This improvement followed two medical solutions and structures to support
may be linked to a reported dearth of years in which TCD’s ranking declined, with businesses through the crisis. The city was
globally leading, high value scaleup/unicorn the university falling outside the top 100 for initially ranked at 13th out of 80 cities
companies. the first time in 2019. UCD rose 8 places to worldwide in Q2 due to its swift response
The Mercer Cost of Living Survey for rank at 177th in the world in the most recent to the crisis. It has fallen back in Q3, likely
2020 found Dublin to be the most expensive publication. The rankings for DCU (439th) due to increasing rates of innovation in other
city for expatriates in the Eurozone. Rental and TU Dublin (801st-1000th bracket) cities across the world, but remains in the
accommodation costs were the most both fell in the 2021 rankings. Overall, top 40 globally.
D U B L I N ' S L AT E S T I N T E R N AT I O N A L R A N K I N G S
SOURCE BENCHMARK CRITERIA YEAR RANKING CHANGE‡
Weighting of fDi Markets data (since 2015) against locations'
fDi Market Top Headquarter Locations
population size
2020 1 ▲
Coronavirus Innovation Map Innovative responses and solutions to COVID-19 pandemic 2020 26 ▼
fDi performance, connectivity, cost effectiveness, economic
fDi European Cities & Regions of the Future
potential, innovation & attractiveness
2020 3 ▲
FDI performance, connectivity, cost effectiveness, economic
fDi Fintech Locations of the Future
potential, innovation & attractiveness
2020 3 ▲
Average rental prices for a three-bedroom apartment in the
ECA International Accommodation Survey
mid-range of the expatriate market
2020 26 ▲
Place, people, product, prosperity, programming and
Resonance World's Best Cities
promotion
2020 42 -
Includes economic, legal, sustainability and competitiveness
Global Financial Centres Index
indicators
2020 30 ▲
Regulatory, market and business/labour landscape, external
Global Talent Competitiveness Index and international openness, education and access to growth 2020 13 ▲
opportunities and sustainability and lifestyle
Mercer Cost of Living City Rankings Cost of consumer goods and services 2020 46 ▼
Mercer Quality of Living City Rankings Environmental/ socio-economic 2019 33 ▲
ECA International Cost of Living Survey Most liveable locations for European expatriates 2020 9 ▲
Startup Genome Global Startup Ecosystem Performance, funding, market reach, connectedness, talent,
Report experience
2020 36 ▼
TomTom Traffic Index Congestion levels 2019 17 ▼
QS World University Rankings University quality 2021 101* ▲
IMD World Talent Rankings Developing, attracting and retain high skilled workers 2019 18 ▲
332 competitiveness criteria related to competitiveness, digital
IMD World Competitiveness Ranking
competitiveness and talent
2020 12 ▼
‡change on previous publication of the relevant benchmark. an upward-pointing arrow denotes an improvement. *tcd.
// 11COMPETITIVENESS STRATEGIES
STABILISE, RESET,
RECOVER
EOGHAN HANRAHAN
REGIONAL DIRECTOR FOR DUBLIN,
ENTERPRISE IRELAND.
Support for companies to resume business efficiently is key
The Dublin region has been severely impacted by COVID-19 and The Sustaining Enterprise Fund (SEF) is a significant fund
saw a significant decline in activity. With the process of ‘stabilise, designed to support companies deal with the impact of COVID-19
reset and recover’ underway, companies are looking to the future and and plan for a better future. Up to €800,000 per undertaking is
assessing the steps they need to take. available to support companies, with 50% up to a maximum of
Enterprise Ireland assists companies to develop and improve their €200,000 in the form of non-repayable support. So, for example, if
products and processes to become more competitive in international you are approved for funding of €300,000, then €150,000 is available
markets. As a consequence of COVID-19 there are a number of as a non-repayable grant.
new initiatives to support companies in navigating this challenging The SEF is available to eligible companies which:
environment. These initiatives help companies assess their current • Employ 10 or more full-time employees
positions before they embark on their next stage. • Are operating in the manufacturing and internationally traded
The Business Financial Planning Grant is a very effective resource service sectors
that allows companies to access consultants to provide an insight into • Have seen (or expect to see) a 15% or greater reduction in
their financial situation and deliver a strong business plan. actual or projected turnover or profit, or a significant increase
The Lean Business Continuity voucher assists companies to get in costs, as a result of COVID-19.
back to reviewing the efficiency and effectiveness of operations in a The SEF will be used to support the implementation of a
COVID-19 working environment. Sustaining Enterprise Project Plan which should be provided by the
12 //company outlining the stabilisation of the business and a return to
viability. The COVID-19 Business Financial Planning Grant can help The highly popular
companies to develop their plan.
This is a time-limited scheme so it is important that companies Lean Business offer
can provide the
look at this option now.
Enterprise Ireland’s existing suite of supports will also be of
interest to companies looking to stabilise and recover. The most
effective innovation can be accomplished from within a company, ideal framework for a
and the popular Lean business supports, which comprise of three
levels, provide guidance on this journey. Lean provides the ideal
framework for companies to digitalise, something that COVID-19
digitisation journey for
has highlighted as essential.
Getting a product or service from idea and concept to
companies to map out
commercialisation is challenging for companies, particularly when
facing additional costs such as staffing levels and resources. Enterprise
and measure processes
Ireland’s Research and Innovation Supports are there to assist getting
ideas, concepts or processes to a marketable, profit making, globally
that can enable the
competitive product. Also, with 40 offices worldwide Enterprise
Ireland, with its Market Discovery Fund, will help companies find a
automation of repetitive
route to market anywhere in the world.
tasks, freeing up and
POWERING THE
ENTREPRENEURSHIP IN DUBLIN
REGIONS AND BUILDING
equipping staff to
Enterprise Ireland is fortunate to be involved with several
structural entrepreneurship programmes in Dublin and has provided work on value-adding
funding of €11.5m to seven Regional Enterprise Development Fund
(REDF) projects. In June Enterprise Ireland announced a REDF activities."
(3rd call) contribution of €2m for the Collaboratory with TU Dublin
- Blanchardstown, which is an Industry Solutions Hub, focusing The services within these centres and hubs are invaluable. They not
on the areas of Cyber Security, Internet of Things, and Artificial only help entrepreneurs develop their ideas; they provide employment
Intelligence. nationwide and co-working space. The National Association of
The extension project on the Guinness Enterprise Centre (GEC), Community Enterprise Centres (NACEC) members alone employ
supported under the REDF (1st call) continues apace, after re- over 5,500 people across 120 centres and hubs nationally.
commencing in line with Government COVID-19 Guidelines, and These projects are a great example of collaboration between regional
is due for completion towards the end of this year. This expansion stakeholders, Technological Universities and Irish entrepreneurship.
will increase capacity for its function as an incubator, co-working Another is that of New Frontiers which, in conjunction with TU
and innovation space, and support businesses post the COVID-19 Dublin, put 58 participants through its program in 2019, and 27 so
restrictions. far in 2020.
Fostering entrepreneurship is critical to the success of the Irish Enterprise Ireland launched its Women in Business strategic plan
economy. Projects such as those mentioned above, together with in January with the overall aim of increasing participation of women
a wide group of Community Enterprise Centres (CEC), provide in starting, scaling and leading Irish enterprise.
opportunities for the commercialisation of new ideas, products and The demands of the last few months have been substantial for
services. The recently announced CEC fund of €12m nationally companies, adapting and diversifying to new ways of doing business.
provides an opportunity for private and public centres in Dublin Support in charting a new course for the future of your company
to seek support for sustainability and growth, while recognising the is available from your Local Enterprise Office or Enterprise Ireland.
importance of the centres. https://enterprise-ireland.com, https://localenterprise.ie/response
// 13SPECIAL REPORT
RECOVERY OFFERS
OPPORTUNITIES FOR
MORE SUSTAINABLE
PRACTICES
JULIET PASSMORE
ECONOMIST
DUBLIN CITY COUNCIL
As COVID-19 restrictions are eased there is an opportunity for greener practices to be
adopted across the city.
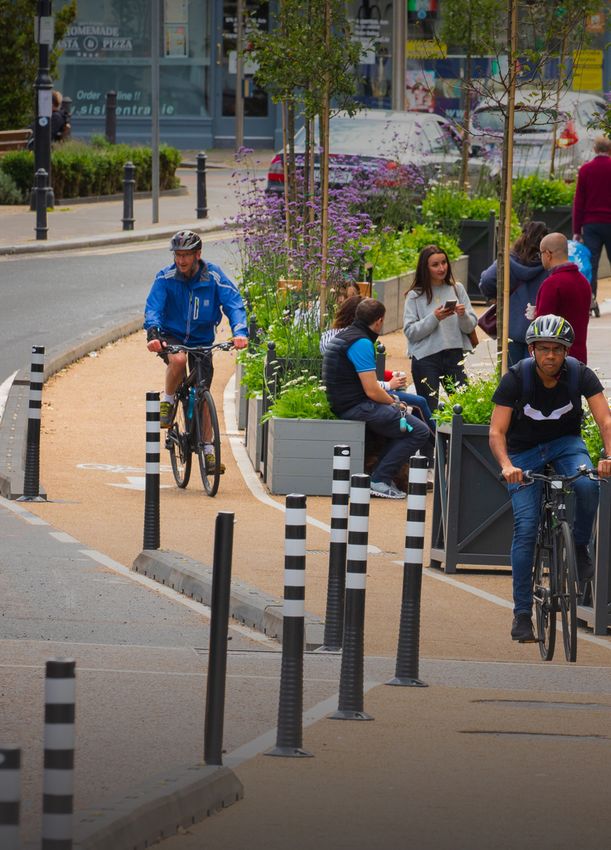
COVID-19 has caused huge disruption to everyday life. those that say they will cycle has risen to 24%, from 19%, making
Government restrictions to contain the virus have seen many it the most popular post-pandemic commuting choice. There is,
businesses re-configure to a remote working model or cease however, no change in the commuting intentions of motorists with
operations altogether on a temporary or even permanent basis. As is the overall proportion of those intending to drive remaining at the
often the case disruption illuminates new, and often better, ways of 20% pre-pandemic level.
doing things and as restrictions are eased the opportunities to build Clearly more needs to be done to convince motorists to use
back in a more sustainable way are being progressed. more sustainable methods of transport. To this end improving
In our most recent Your Dublin Your Voice Survey, we asked the cycle network in the city was by far the most cited means of
Dubliners what they see as the future for the city as it emerges from encouragement in the survey at 59%. This was followed by less
the pandemic. traffic on the roads at 46%. While public policy has been aimed
One of the most obvious effects of the restrictions was the at the former, the survey findings suggest that there is going to be
reduction in traffic on the city’s roads. With 41% of those surveyed little change to the number of car commuters in the medium term.
expecting to be mainly working from home in the medium to The survey also highlighted the fact that the positive
long term (currently 56% but was 6% before the restrictions), a environmental impact of less movement of people is offset to
reduction in both the numbers and a change in the methods of some degree by increased use of energy in the home. 61% of those
commuting is inevitable. surveyed indicated that their energy use had increased since the
What the survey results show is that the shift in commuting onset of the restrictions although this dropped to 32% for those
intentions is concentrated in those who use public transport. The over 65 years. Charging of devices, of every type, and increased
proportion intending to choose this method of commuting falls to food preparation were the main reasons cited for the increase. If
20% in a post COVID-19 world from 32% pre the pandemic. This remote working is to be part of the new norm then households may
reduction is explained by both a shift to remote working and an need to be incentivised to make their homes more energy efficient,
increase in those who intend to cycle. Indeed, the proportion of something that 46% of survey respondents indicated they would
like to see.
The survey finds that motorists There is a clear positive bias towards businesses that operate pro
environmental practices. 64% of those surveyed indicated that such
are the least likely to change companies were the most important for the government to support
in the recovery, making them the top pick (rises to 74% for under
their method of commuting 35 years olds). This was closely followed by support for sectors most
badly affected by the restrictions (62%).
while a proportion of those COVID-19 has had a profound effect across all sectors of society
and has seen a change in the way we travel and use our homes. As
who previously used public the city reopens there is an opportunity and support for cleaner
practices to be encouraged across households and businesses alike.
transport are planning to cycle Sign up to the Your Dublin Your Voice opinion panel at http://
in the future.” bit.ly/ydyvreg
14 //ECONOMIC SCORECARD
DUBLIN: ECONOMIC SCORECARD SEPTEMBER 2020
Note: These "petrol gauge" charts present the performance of the particular indicator relative to a range of performances from most positive
(green) to least positive (red). Each gauge presents the latest value compared to the peak value and the trough value over the last decade
(except for public transport trips & MasterCard SpendingPulse which cover the past 5 years, and housing completions which cover the past 6
years). The Commercial Property gauges are red at the high and low extremes, in recognition of the undesirability of rents that are either too high
or too low as well as vacancy rates.
economy
ihs markit business unemployment rate mastercard spendingpulse
pmi q2 2020 q2 2020 sales index q2 2020
41 49 8 10 113.8 119.2
33 57 6 12 108.4 124.6
25
25.2 63 4
5.3 14 103
110 130
3 month moving average (sa) % (sa) index (2014 = 100) (SA)
travel
hotel occupancy rate jul 2020 seaport cargo q2 2020 public transport trips q2 2020
37.02 52.58 7.96 8.54 34 44
21.46 68.14 7.38 9.12 24 54
5.9
16.1 83.7 6.8
7.9 9.7 14
14.0 64
% of total rooms million tonnes/quarter (sa) million trips/quarter (sa)
residential property
average residential residential property housing completions
rents q1 2020 price index JuN 2020 q2 2020
1,306 1,440 77 88 1,058 1,372
1,171 1,575 66 99 744 1,686
1,037 1,709 1,709 55
104.3 110 430
840 2,000
€/Month index (2005 = 100) units/quarter
commercial property
dublin city centre dublin 2/4 office dublin suburbs office
office rent q2 2020 vacancy rate q2 2020 vacancy rate q2 2020
78 92 10.8 14.2 13.2 16.8
64 106 7.4 17.6 9.6 20.4
50
118 118.2 4
5.7 21 6
7.6 24
index (2006 = 100) % %
sources: cso, pmi IHS markit; seaport cargo dublin port; public transport nta; residential rents rtb; commercial property cbre research, hotel occupancy str.
// 15You can also read