In-vitro Anticancer and Antioxidant Activity of Green Coffee Beans Extract
←
→
Page content transcription
If your browser does not render page correctly, please read the page content below
Asian Food Science Journal

                            17(2): 24-35, 2020; Article no.AFSJ.59254
                            ISSN: 2581-7752

                In-vitro Anticancer and Antioxidant Activity of
                                  Green Coffee Beans Extract
              Dileep Polamuri1*, CH. Grace Valentina1, R. Suresh2 and Aminul Islam3
                  1
                   Department of Food Technology and Management, Loyola Academy, Secunderabad,
                                                                         500 010, Telangana, India.
                                                                2
                                                                 Greensmed Labs, Chennai, India.
                                                          3
                                                           Allovedic Life Sciences, Chennai, India.

                                                                                             Authors’ contributions

  This work was carried out in collaboration among all authors. All authors read and approved the final
                                                                                          manuscript.

                                                                                                  Article Information

                                                                                     DOI: 10.9734/AFSJ/2020/v17i230188
                                                                                                                  Editor(s):
                                                            (1) Dr. Ho Lee Hoon, Universiti Sultan Zainal Abidin, Malaysia.
                                        (2) Dr. Abd Elmoneim Osman Elkhalifa, University of Hail, Kingdom of Saudi Arabia.
                                                                                                                Reviewers:
                                                                     (1) Adawiya J. Haider, University of Technology, Iraq.
                                                               (2) Maryam Akram Butt, Quaid I. Azam University, Pakistan.
                                                                       (3) Sorush Niknamian, Liberty University (LU), USA.
                                             Complete Peer review History: http://www.sdiarticle4.com/review-history/59254

                                                                                              Received 04 July 2020
                                                                                             Accepted 27 July 2020
  Original Research Article
                                                                                             Published 29 July 2020

ABSTRACT
 The main objective of this article is to analyze the efficacy of polyphonic compounds, especially
 Chlorogenic Acid in anti-obesity and anticancer. Overweight and obesity became severe global
 health issues in all sex and age groups respectively according to WHO, this is the significant risk
 factors for several chronic illnesses this is increasing from recent decades, due to lifestyle changes
 intake of food lack of proper healthcare particularly in urban communities. According to the India
 Council of Medical Research (ICMR), more than 1300 Indians die every day due to cancer,
 especially Basal cell carcinoma (BCC), squamous cell carcinoma (SCC) and malignant melanoma
 are primary skin cancers. This research aims to help anti-obese and anticancer by providing health
 benefits of green Coffee. The ethnobotanical study proved that green coffee beans of Coffee
 Robusta variety have significant medicinal properties, which are essential for the human diet. In
 vitro results showed that high free radical scavenging activity with IC50 towards DPPH 30.99µg/mL
 ABTS0.83 µg/mL, Alpha-amylase 31.75 µg/mL, MTT assay 101.26 µg/mL and Anti-obesity activity
 33.34 µg/mL respectively. In conclusion, more in vivo and in vitro experimental studies are required
 to understand the full use of the extract in the prevention of lethal diseases.
_____________________________________________________________________________________________________

*Corresponding author: Email: polamuridileep@gmail.com;
Polamuri et al.; AFSJ, 17(2): 24-35, 2020; Article no.AFSJ.59254
Keywords: Anti-cancer; anti-obesity; overweight; coffee robusta.
1. INTRODUCTION There are different ranges of concentrations in
different plant parts, such as root, peel, leaf, fruit
Coffee origin is Ethiopia, then it came into the pulp, and tuber [8]. Generally, Chlorogenic Acid
north way across the red sea into Yemen in is high in two main commercial species of C.
15thcentury [1].In the 17th century by Dutch in Sri arabica and C. canephora showed quantitative
Lanka European first owned the coffee and qualitative differences. In GCB (5-
production. The bear fruit of the coffee plant was Caffeoylquinic Acid), the amount of CGA is 2%
collected after 3-4 years. This fruit, which bearing DM, 1% DM in 3-caffeoylquinic acid. GCB of C.
seed, is called coffee cherry; initially, it is green arabica contains less CGA6.5% DM than
in color, then changes its color to a deep red, C. canephora10% DM [9]. The amount of
which is ripped fruit. Coffee fruits are typically Chlorogenic Acid decreases with increasing of
harvested in one of three ways: picking, roasting till now 85 Chlorogenic Acids have been
stripping, or mechanical harvesting. identified in green beans of C. canephora and 45
in C. arabica. Compared to C. arabica,
Green coffee beans are purest and rawest form. C. canephora has the highest feruloylquinic and
Raw beans are used to make the extract. dicaffeoylquinic Acids [10]. Chlorogenic Acid
Harvested green coffee beans are collected, content reduces up to nearly 50% when it is
sorted, and graded to remove immature, over roasted for 230°C to 250°C for 12 to 21 min [11].
ripped, spoiled, and damaged seeds. Low-quality
seeds contain a high fraction of immature seeds Compared to roasted coffee beans, unroasted
with low chlorogenic acid. Robusta coffee is green coffee beans contain a high amount of
more robust and healthier, which is resistant to Chlorogenic Acid. Many experimental studies
diseases and pests. It provides a high amount of proved that CGA has new health benefits in
antioxidant compounds and Caffeine, the diabetes, metabolic syndrome, hypertension,
presence of high chlorogenic Acid in Coffee cardiovascular diseases, neuroprotection [12].
robusta protects the plant more against the
microorganisms, insects, and UV radiation 2. MATERIALS AND METHODS
compared to Coffee arabica.
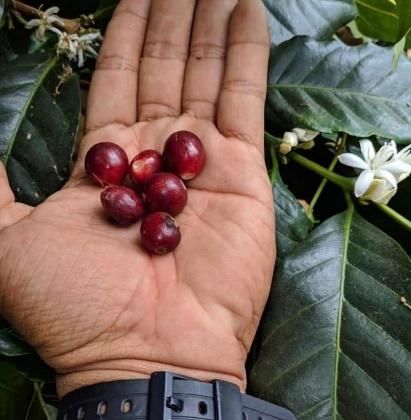
2.1 Sample Collection
In cold, dry conditions, green coffee beans can
be stored up to two years in a burlap bag (made Raw Green Coffee Beans average weight of 2kg
of the skin of the jute plant) [2]. Ideal storage was collected from Kodagu, Fig. 1 (Coorg) which
conditions for green Coffee are 55 to 80 degrees is a rural district in the southwestern Indian state
Fahrenheit, with ambient humidity 60%-75% (to of Karnataka.
maintain 10-12% bean humidity). Burlap (or
cotton) bags are used when there are humidity
changes so that the Coffee can "breathe."
Mostly, green coffees stay best in conditions that
people would also like to sleep in.
Coffee contains many bioactive compounds
which are helpful to reduce the risk of
Hepatocellular carcinoma [3], Alzheimer' disease
[4], and anti-proliferative effect against some
human cancer cell lines [5].Caffeine (C8H10N4O2)
an alkaloid that is chemically known as 1,3,7-
trimethylxanthine; it raises levels of physiological
or nervous activity in the body.
In Coffee chlorogenic Acid is the primary
polyphenolic compound, and this is also known Fig. 1. Coffee cherry
as an antioxidant that decreases the release of
glucose into the bloodstream after a meal [6]. 2.2 Sample Preparation
CGA is the ester of Caffeic Acid and quinic Acid.
Chlorogenic acid is the 5-caffeoylquinic acid; Green Coffee Beans of 500gm were taken and
according to the IUPAC-IUB nomenclature [7]. pulverized (one bean 4-5 pieces) with the help of
25Polamuri et al.; AFSJ, 17(2): 24-35, 2020; Article no.AFSJ.59254
pastel and mortar. Added 2.5Lit 90% methanol precipitate appears, it indicates the presence of
and Extracted for 3 hrs under 60℃, 70rpm with a phenolic compounds.
rotatory evaporator, repeated the above process
three times and accumulated all the extracts. 2.4.7 Test for steroids
Concentrated under reduced pressure and
temperature and separated oil layer overnight at 1 mL sample was dissolved in 10 mL of
room temperature. Chlorogenic acid was chloroform &an equal volume of concentrated
extracted by the solvent extraction process. H2SO4 was added from the side of the test tube.
The upper layer turns red, and the H2SO4coat
2.3 Phytochemical Analysis showed yellow with green fluorescence. This
indicates the presence of steroids.
2.3.1 Solubility test
2.4.8 Test for terpenoids
A pinch of test samples was mixed with a
different solvent system. The appearance of a
Salkowski test: 5 mL of sample was mixed in 2
clear solution or turbidity was observed in the
mL of chloroform, and concentrated sulphuric
tubes.
acid was carefully added to form a layer. A
reddish-brown coloration of the interface
2.4 Qualitative Phytochemical Analysis
indicates the presence of terpenoids.
2.4.1 Test for alkaloids
2.4.9 Test for quinones
Mayer's Test: To the sample, 2 mL of Mayer's
reagent was added; formation of a reddish-brown Sample was treated separately with Alc. KOH
precipitate indicates the presence of alkaloids. solution. Change in colour ranges from red to
blue indicates the presence of quinones.
2.4.2 Test for saponins
2.4.10 Test for Proteins
1 mL of the sample and 5 mL of water
wastakeninto the test tubeand shaken vigorously. Nin-hydrin test: The sample was taken, and few
Copious lather formation shows the presence of drops of freshly prepared Ninhydrin reagent were
saponins. added and heated. If pink colour or purple colour
appears, it indicates the presence of proteins,
2.4.3 Test for tannins peptides, or Amino Acids.
Ferric chloride was added to 1mL of sample; the 2.5 Total Phenolic Content
development of a dark bluecolor or greenish-
black color indicates the presence of tannins. Samples (250 µg) were mixed with 0.5 mL of
water (H2O) and 0.2 mL of Folin-Ciocalteu's
2.4.4 Test for glycosides phenol reagent (1: 1). After 5 min, 1 mL of
saturated Na2CO3 sol (8% w/v in water) was
Keller-Killani test: 1 mL of the sample, 2 mL of taken into the mixture and the volume made up
glacial acetic acid containing a drop of FeCl3. An to 5 mL with distilled water. The reaction was
equal volume of conc. Sulphuric Acid (H2SO4) kept in the darkroom for 30 min. And the
was added from the sides of the tube. If a brown absorbance of blue colour from different samples
color ring appears, it indicates the presence of was measured at 765 nm. It is calculated as
cardiac glycosides. Gallic Acid equivalents GAE/g of dry plant
material based on a standard curve of Gallic Acid
2.4.5 Test for flavonoids (10-320 µg/mL), y = 0.0033x - 0.0231,R² =
0.9895.[13]
Alkaline reagent test: sample was treated with
10% NaOH solution; formation of intense yellow 2.6 Thin Layer Chromatography
color indicates the presence of flavonoid.
The extract was subjected to thin-layer
2.4.6 Test for phenols chromatography (TLC) as per the conventional
method using silica gel 60F254; 5x3 cm (Merck)
Lead acetate test: Into the sample, 3 mL of 10% was cut using the TLC cutter. Plate markings
lead acetate solution was added. If bulky white were made with a soft pencil. Glass capillary
26Polamuri et al.; AFSJ, 17(2): 24-35, 2020; Article no.AFSJ.59254
tubes were used to spot the extract in TLC ABTS radical scavenging effect (%) = [(A0 -
plates. The solvent system was tested for the A1)/A0] ×100. Where, A-0 is the control; A-1 is
separation of bioactive components. In the TLC the test.
chamber, the solvent system viz butanol: acetic
acid: water was used. After pre-saturation with 2.8 Total CFU
the mobile phase for 30 min, the plate was kept
inside the chamber, and the elution was The diluted sample is pipetted on the surface of a
performed using the solvent as mentioned above solidified agar medium and spread with a
system. After completion of the elution, the plate sterilized, bent glass rod (glass spreader) for the
was dried and subjected to visualize under the determination of heterotrophic plate count using
UV chamber and sprayed using different spray the spread–plate method. Make a 10-fold dilution
reagents. Rf values determined by using the series from a sample: measure 1 g sample into a
following formula: flask containing 99 mL sterile water (or 1 mL
water sample to 99 mL pure water) mix
Rf = Distance travelled by the solute/ Distance thoroughly with a vortex mixer, pipette 1 mL from
travelled by the solvent. this suspension into a test tube containing 9 mL
sterile water, mix thoroughly with vortex, pipette
2.7 Antioxidant Activity 1 mL from this latter suspension into another test
tube containing 9 mL pure water, mix thoroughly.
2.7.1 DPPH (2, 2-diphenyl-1-picrylhydrazyl) Spread 0.1 mL from the given dilution onto the
radical scavenging assay) surface of agar plates: pipette 0.1 mL from the
appropriate member of the dilution series onto
DPPH radical scavenging assay of test samples the centre of the agar surface; rinse the glass
GCBE and MRKT were prepared in different spreader with alcohol and sterilize the rod by
concentrations of samples were mixed with 2.5 flaming; cooling down the glass spreader by
mL of DPPH solution. The reaction mixture was touching the medium surface; spread the liquid
vortexes thoroughly and kept at room evenly over the surface. Incubate Petri dishes at
temperature for 30 minutes. It is observed at a 28°C for 24 and count the number of discrete
rangeof517 nm. For reference, standard Ascorbic colonies, in case of parallel plates, average the
Acid was used. The ability of extracts to numbers and calculate the CFU value of the
scavenge DPPH radical and control was sample. The results of different dilutions should
calculated from the following formula, which is a also be averaged. Give the CFU values
modified method described by Perumal et al., of the original sample in CFU/mL or CFU/g units
[14]. [15].
% DPPH inhibition = [(OD of control - OD of test)/ 2.9 Alpha-amylase Assay
(OD of control)] ×100 The α-amylase inhibitory activity of the test
samples GCBE and MRKT were carried out
2.7.2 ABTS (2, 2'-azino-bis (3- according to the standard method with minor
ethylbenzothiazoline-6-sulphonic acid) modification [16]. 100 µl of α-amylase solution
radical scavenging assay) (0.1 mg/mL) were mixed with different
concentrations (10, 20, 40, 80, 160, and 320
ABTS radical scavenging assay of test samples µg/mL) of test samples, standard (acarbose),
GCBE and MRKT was prepared in different and control (without standard/test samples) and
concentrations. ABTS reagent (7 mM, 25 mL in pre-incubated at 37°C for 15 min. Then, 100 µl of
deionized water), a stock solution was prepared the starch solution was added to initiate reaction
with potassium persulfate (140 mM, 440 μL). and incubation was done at 37°C for 60 min.,
Different concentrations of test samples and then 10 µl of 1 M HCl and 100 µl of iodine
standard (Ascorbic Acid) were mixed with the reagent were added to the test tubes. It was
ABTS working solution (2.0 mL), and the reaction absorbed and measured at 580 nm. α-amylase
mixture could stand at ambient temperature for inhibitory activity was measured using the
20 minutes; then, the ABTS was observed at 734 formula.
nm. ABTS radical scavenging effect was
calculated by the following formula, which is a % of Inhibition = [(OD of test - OD of control)/OD
modified method described by Perumal et al., of test] x 100
[14].
27Polamuri et al.; AFSJ, 17(2): 24-35, 2020; Article no.AFSJ.59254
2.10 Anticancer Activity Studies Using using the same concentrations as mentioned
MTT above. The established tests were performed in
triplicates.
The monolayer cell culture was replanted (well),
and the cell count was adjusted to 1.0 x 10⁵ 2.12 Statistical Analysis
cells/mL using respective media containing 10%
FBS. To each well of the 96 well microtiter plate, Measurements were carried out in triplicates, and
100μl of the diluted cell suspension the obtained data is gathered using the inhibitory
(50,000cells/well) was added. After 24 h, when a concentration (IC50) and calculated using
partial monolayer was formed, the supernatant GraphPad Prism version 5.
was flicked off, washed the monolayer once with
medium, and 100μl of different test 3. RESULTS AND DISCUSSION
concentrations of test drugs were added on to
the partial monolayer in microtiter plates(well).It 3.1 Solubility Test
is incubated at 37oC for 24hrs in a 5% CO2
atmosphere. After incubation, the test solutions After testing of GCBE with different solvent
in the wells were discarded, and 100μl of MTT (5 systems, they were soluble in Methanol, DMSO,
mg/10 mL of MTT in PBS) was added to each and partially soluble in Ethanol (Table 1)
o
well. It is incubated for 4h at 37 C in a 5% CO2 insoluble in Chloroform and Aqueous,
atmosphere. The supernatant was removed, and respectively.
100μl of DMSO was added, and the plates were
gently shaken to solubilize the formed formazan. 3.2 Qualitative Phytochemicals
It is observed at a wavelength of 570 nm [17,18], After testing, the alkaloids were present in GCBE
and the concentration of test drug needed to are tannins, glycosides, flavonoids, phenols,
inhibit cell growth by 50% (IC50) values is steroids, and terpenoids (Table 2), respectively.
generated from the dose-response curves for
each cell line. 3.3 Total Phenolic Content
2.11 Anti-obesity Activity (Pancreatic Total phenol content in the plant extracts GCBE
Lipase Inhibition) and MRKT using the calibration curve was found
to be 211.34, and 134.37 mg of Gallic Acid
The porcine pancreatic lipase inhibitory assay equivalents/g dry weight of extract (Table 3).
adapted from Zheng et al., 2010, and Bustanji et
al.,[19]it was done by 1 mg/mL plant extract 3.4 Thin Layer Chromatography
stock solution in 10% DMSO was used, from
which five different solutions were prepared with After performing the experiment on GCBE of TLC
the following concentrations: 10–320 µg/mL. 1 the Rf value for GCBE is 1.66; 0.56; 0.73; 0.86;
mg/mL stock solution of pancreatic lipase and for MRKT Rf values are 1.66; 0.56; 0.73;
enzyme was prepared immediately before being 0.86 observed respectively under laminar (Table
used. This procedure was carried for the ten 4).
studied plant species. A stock solution of PNPB
(p-nitrophenyl butyrate) was prepared by 3.5 DPPH (2, 2-diphenyl-1-picrylhydrazyl)
dissolving 20.9 mg of PNPB in 2 mL of Radical Scavenging Assay
acetonitrile. 0.1 mL of porcine pancreatic lipase
(1 mg/mL) was added to test tubes containing The IC50 values of the given samples GCBE and
0.2 mL of the various concentrations (10–320 MRKT were found to be 30.99, and 118.57
µg/mL) of plant extract. The resulting mixtures µg/mL and the standard drug (Ascorbic Acid)
were then made up to 1 mL by adding Tri-HCl was 19.96 µg/mL, (Table 5) respectively.
solution (pH 7.4) and incubated at 25°C for 15
min. After the incubation period, 0.1 mL of PNPB 3.6 ABTS (2,2'-azino-bis(3-
solution was then added to each test tube. The ethylbenzothiazoline-6-Sulphonic
mixture was again incubated for 30 min at 37°C. Acid) Radical Scavenging Assay
Pancreatic lipase activity was determined by
measuring the hydrolysis of p-nitrophenyl The IC50 values of the given samples GCBE and
butyrate to p-nitrophenol at 405 nm using a UV- MRKT were found to be 0.83, and 23.98 µg/mL
visible spectrophotometer. The same procedure and the standard drug (Ascorbic Acid) was
was repeated for Orlistat (a positive control) 4.22µg/mL, (Table 6) respectively.
28Polamuri et al.; AFSJ, 17(2): 24-35, 2020; Article no.AFSJ.59254
Table 1. Properties of GCBE in solubility test
Extract Solvent
Chloroform Methanol Ethanol Aqueous DMSO
GCBE Insoluble Soluble Partial soluble Insoluble Soluble
MRKT Insoluble Insoluble Insoluble Soluble Soluble
Table 2. Qualitative phytochemicals properties of Green coffee beans extract
GCBE MRKT
Alkaloids - -
Saponins - -
Tannins + -
Glycosides + -
Flavonoids + +
Phenols + +
Steroids + +
Terpenoids + -
Quinones - -
Proteins - -
Where + Present; - Absent
Table 3. Properties of total phenolic content in GCBE
Test sample concentration Singlate Duplicate Triplicate Mean OD TPC
GCBE 250 µg 0.673 0.676 0.674 0.674333 211.3434
MRKT 250 µg 0.421 0.418 0.422 0.420333 134.3737
Table 4. Properties of GCBE in TLC test
Extract Solvent system Number of spots Rf value
GCBE Butanol: Acetic Acid: Water (4:1:2) 4 1.66; 0.56; 0.73; 0.86
MRKT 4 1.66; 0.56; 0.73; 0.86
29Polamuri et al.; AFSJ, 17(2): 24-35, 2020; Article no.AFSJ.59254
Table 5. Properties of DPPH assay in GCBE
GCBE
Conc.(µg) Singlet Duplicate Triplicate Singlet Duplicate Triplicate Mean sd IC50
5 0.75 0.75 0.75 6.56 5.93 6.31 6.27 0.31
10 0.57 0.58 0.57 28.48 27.74 28.11 28.11 0.37
20 0.44 0.44 0.44 44.18 44.55 44.18 44.31 0.21
40 0.37 0.38 0.38 53.03 52.40 52.65 52.69 0.31
80 0.15 0.15 0.15 80.81 80.19 80.56 80.52 0.31
160 0.11 0.11 0.11 85.79 86.29 86.04 86.04 0.24
320 0.09 0.08 0.09 88.53 89.16 88.66 88.78 0.32
30.99
Table 6. Properties of ABTS assay in GCBE
Conc.(µg) Singlet Duplicate Triplicate Singlet Duplicate Triplicate Mean Sd IC50
5 0.30 0.31 0.31 58.73 57.79 58.33 58.28 0.47
10 0.17 0.18 0.18 76.34 75.67 75.40 75.80 0.48
20 0.13 0.13 0.13 82.12 81.45 81.72 81.76 0.33
40 0.028 0.034 0.03 96.23 95.43 95.96 95.87 0.41
80 0.02 0.025 0.023 97.31 96.63 96.90 96.95 0.33
160 0.016 0.012 0.015 97.84 98.38 97.98 98.07 0.27
320 0.005 0.003 0.003 99.32 99.59 99.59 99.50 0.15
0.83
Table 7. Properties of CUF in GCBE
-7
Sample name Number of colonies (10 )
NA
GCBE -
MRKT -
where + present; - absent
30Polamuri et al.; AFSJ, 17(2): 24-35, 2020; Article no.AFSJ.59254
Table 8. Properties of alpha-amylase inhibitory assay in GCBE
Conc.(µg) Singlet Duplicate Triplicate Singlet Duplicate Triplicate Mean Sd IC50
5 0.06 0.07 0.06 6.46 12.96 7.84 9.09 3.42
10 0.09 0.09 0.09 32.61 30.37 30.37 31.11 1.29
20 0.10 0.11 0.10 40.31 43.03 41.43 41.59 1.36
40 0.18 0.18 0.19 65.75 66.66 67.01 66.48 0.65
80 0.21 0.22 0.22 71.25 72.02 72.27 71.84 0.53
160 0.27 0.27 0.27 76.96 76.79 77.29 77.01 0.25
320 0.32 0.33 0.32 80.95 81.18 80.77 80.97 0.20
31.75
Table 9. Properties of MTT assay - HT29 cell lines in GCBE
Concentration Unit: µG
GCBE Blank Untreated 3.12 6.25 12.5 25 50 100IC 50
Reading 1 0.004 1.34 1.30 1.20 0.99 0.90 0.86 0.66
Reading 2 0.003 1.35 1.31 1.21 0.98 0.92 0.85 0.65
Reading 3 0.006 1.33 1.31 1.19 1.01 0.91 0.85 0.65
Mean 0.004 1.34 1.31 1.20 0.99 0.91 0.85 0.65
Mean OD-Mean B 1.34 1.30 1.20 0.98 0.91 0.85 0.65
STANDARD DEVIATION 0.011 0.006 0.010 0.015 0.010 0.008 0.009
Viability % 100 97.56 89.55 73.83 67.91 63.69 48.74
101.26
31Polamuri et al.; AFSJ, 17(2): 24-35, 2020;; Article no.AFSJ.59254
3.7 Total CFU From the above results it was clear that Green
coffee bean extract (GCBE) contains phenols,
The activity of microbial count after incubation flavonoids, glycosides, tannins steroids. Whereas
-7 the marketed (MRKT) sample contain flavonoids,
the no. of colonies (10 ) formed in GCBE and
MRKT is purely absent (Table 7). Phenols and steroids only. The total phenolic
content in GCBE was 211.34mg and in MRKT
3.8 Alpha-amylase Assay sample it was 134.37mg. The resul
results of thin layer
chromatography showed same Rf values of four
spots (Rf values are 1.66; 0.56; 0.73; 0.86). The
The IC50 value of the given samples GCBE and
results of DPPH radical scavenging assay of
MRKT was found to be 31.75, and 47.77 µg/mL
GCBE and MRKT are as 30.99, and 118.57
and the standard drug (Acarbose) was10.22
was
µg/mL respectively. The IC50 values of ABTS of
µg/mL (Table 8) respectively.
the given samples GCBE and MRKT were found
to be 0.83, and 23.98 µg/mL respectively and the
3.9 Anticancer Activity Studies Using standard drug (Ascorbic Acid) was 4.22µg/mL.
MTT The activity of microbial count after incubation
the number of colonies formed in GCBE and
The IC50 value of the given samples GCBE and MRKT were absent. The IC50 value of alpha-
MRKT is 101.26, and 152.11 µg/mL, (Table 9) amylase assay was GCBE and MRKT was found
respectively, microscopic images Fig. 2 of HT-29 to be 31.75, and 47.77 µg/mL respectively and
cell lines. the standard drug (Acarbose) was was10.22 µg/mL.
The Anticancer Activity of the given samples of
3.10 Anti-obesity
obesity Activity (Pancreatic
( GCBE and MRKT was 101.26, and 152.11
Lipase Inhibition) µg/mL, respectively; microscopic image
images of HT-
29 cell lines also supported the above results.
The IC50 value of the given samples GCBE The IC50 value of Pancreatic Lipase Inhibition for
and MRKT was found to be and 33.34 and Anti-obesity activity of the given samples GCBE
40.48 µg/mL and the standard drug and MRKT was found to be and 33.34 and 40.48
(Acarbose) was 11.12 µg/mL, respectively (Table µg/mL.
10).
Fig. 2. Microscopic representation of MTT assay-HT29
assay cell line
32Polamuri et al.; AFSJ, 17(2): 24-35, 2020; Article no.AFSJ.59254
Table 10. Properties of anti-obesity in GCBE
Conc.(µg) Singlet Duplicate Triplicate Singlet Duplicate Triplicate Mean SD IC50
10µg 0.87 0.88 0.87 10.76 9.94 11.17 10.62 0.62
20µg 0.55 0.56 0.55 43.05 42.64 43.87 43.19 0.62
40µg 0.37 0.36 0.37 61.79 63.02 61.59 62.13 0.77
80µg 0.22 0.22 0.21 76.97 77.28 77.69 77.31 0.35
160µg 0.12 0.11 0.12 87.16 87.87 87.36 87.47 0.36
320µg 0.08 0.08 0.08 91.64 91.13 91.44 91.40 0.25
33.34
33Polamuri et al.; AFSJ, 17(2): 24-35, 2020; Article no.AFSJ.59254
4. CONCLUSION 2. Available:http://www.coffeeresearch.org/ag
riculture/coffeestorage.htm
Several experimental studies of Green coffee 3. Johnson S, Koh WP, Wang R,
bean extract showed a statistically significant Govindarajan S, Yu MC, Yuan JM, "Coffee
representation, GCBE has brought about a consumption and reduced risk of
revolution in nutraceuticals marketplace, the hepatocellular carcinoma: findings from the
outline of this study is about to understand Singapore Chinese Health Study,"
chemistry, antioxidants, bioavailability effects of Cancer Causes and Control.
GCBE and CGA. Therefore, more trials are 2011;22(3):503–510.
required to assess the helpfulness of green 4. Arendash GW, Cao C. "Caffeine and
coffee extract as a health supplement. Notably, coffee as therapeutics against Alzheimer's
according to the effect of green Coffee on disease," Journal of Alzheimer's Disease.
increasing energy metabolism, reducing 2010;20(1):117–126,2010.
lipogenesis, and additional health benefits over 5. Tai J, Cheung S, Chan E, and Hasman D,
the human body. However, it is very much "Antiproliferation effect of commercially
essential to standardize the extraction technique, brewed coffees on human ovarian cancer
quality assurance, and quality control, and cells invitro," Nutrition and Cancer.
clinical studies on the human to substantiate the 2010;62(8):1044–1057, 2010.
claims and position of the product in the 6. Available:https://pubchem.ncbi.nlm.nih.gov
marketplace. /compound/Chlorogenic-Acid
DISCLAIMER 7. IUPAC Commission on the Nomenclature
of Organic Chemistry (CNOC) and IUPAC-
Authors have declared that no competing IUB Commission on Biochemical
interests exist. The products used for this Nomenclature. Nomenclature of cyclitols,
research are commonly and predominantly use recommendations. Biochem J. 1973-
products in our area of study and country. There 1976;153:23–31.
is absolutely no conflict of interest between the 8. Andrés-Lacueva C, Medina-Remon A,
authors and producers of the products because Llorach R, Urpi-Sarda M, Khan N, Chiva-
we do not intend to use these products as an Blanch G, Zamora-Ros R, Rotches-
avenue for any litigation but for the advancement Ribalta M, Lamuela-Raventós RM.
of knowledge. Also, the research was not funded Phenolic compounds: Chemistry and
by the producing company; instead, it was occurrence in fruits and vegetables. In
financed by the personal efforts of the authors. Fruit and Vegetable Phytochemicals:
Chemistry, Nutritional Value, and Stability,
ACKNOWLEDGEMENT eds. LA de la Rosa, E. Alvarez-Parrilla
The authors are thankful for gratitude to guides and G.A. González-Aguilar, Wiley-
Dr.Aminul Islam and Dr. R Suresh. for providing Blackwell, Oxford. 2009;53–88.
the necessary facilities to carry out this research 9. Arnaud MJ. The metabolism of coffee
work in Greensmeds Labs Chennai-97,as well as constituents. In Coffee. Physiology, eds.
I express my sincere thanks to our beloved Clarke R J and Macrae R, Elsevier
principal Rev Fr Dr. P. Anthony SJ, and vice- Applied Science, London, Chapter.
principal Rev. Fr. L Jojireddy S.J. who gave the 1988;3(2):33–55.
golden opportunity to do this excellent research. I 10. Spiller MA. The chemical components of
am grateful to our HOD, Mr. A. Ravinder, for his Coffee. In the Methylxanthine Beverages
extended help, by rendering suggestions and Foods: Chemistry, Consumption, and
regarding the completion of our research work in Health Effects, eds. Spiller G A, Alan R.
speculated time. Liss, New York. 1984;91–147.
11. Moon JK, Yoo HS, Shibamoto T. Role of
COMPETING INTERESTS roasting conditions in the level of
chlorogenic Acid content in coffee beans:
Authors have declared that no competing correlation with coffee Acidity. J Agric
interests exist. Food Chem. 2009;57(12):5365–9.
12. Kozuma K, Tsuchiya S, Kohori J, Hase T,
REFERENCES
Tokimitsu I. Antihypertensive effect of
1. A Bean That Travelled the World. (n.d.). green coffee bean extract on mildly
Available:https://wol.jw.org/en/wol/d/r1/lp- hypertensive subjects. Hypertens. Res.
e/102006087#h=7 2005;28(9):711–8.
34Polamuri et al.; AFSJ, 17(2): 24-35, 2020; Article no.AFSJ.59254
13. Suman Chandra, Shabana Khan, Bharathi 16. In vitro a-amylase, a-glucosidase,
Avula, Hemant Lata, Min Hye Yang, lipase inhibitory and cytotoxic activities of
Mahmoud A. El Sohly, Ikhlas A. Khan. tuber extracts of Kedrostisafricana(L.)
Assessment of Total Phenolic and Cogn.
Flavonoid Content, Antioxidant Properties, DOI: 10.1016/j.heliyon.2018.e00810
and Yield of Aeroponically and 17. Gonzalez RJ, Tarloff JB. Evaluation of
Conventionally Grown Leafy Vegetables hepatic sub cellular Fractions for alamar
and Fruit Crops: A Comparative Study. blue and MTT reductase activity.
Evid Based Complement Alternat Med. Toxicology in vitro. 2001;15:259-9.
2014;253875. 18. Kangas L, et al. Bioluminescence of
14. Perumal P, Saravanabhavan K. cellular ATP: A new method for Evaluating
Antidiabetic and antioxidant activities of cytotoxic agents in vitro. Med. Biol.
ethanolic extract of Piper betle L. leaves in 1984;62:338–43.
catfish, Clariasgariepinus. Asian J Pharm 19. Bustanji Y, Issa A, Mohammad M,
Clin Res. 2018;11(3):194-198. Hudaib M, Tawah K, Alkhatib H,
15. Practical Microbiology: based on the AlmasriI, Al-Khalidi B. Inhibition of
Hungarian practical notes entitled hormone-sensitive lipase and
"Mikrobiológiai Laboratóriumi Gyakorlatok" pancreatic lipase by Rosmarinus officinalis
Authors of the Hungarian and English extract and selected phenolic constituents.
versions: Erika M. Tóth, Andrea K. J. Med. Plants Res. 2010, 4, 2235–
Borsodi, Tamás Felföldi, Balázs; 2013. 2242.
© 2020 Polamuri et al.; This is an Open Access article distributed under the terms of the Creative Commons Attribution License
(http://creativecommons.org/licenses/by/4.0), which permits unrestricted use, distribution, and reproduction in any medium,
provided the original work is properly cited.
Peer-review history:
The peer review history for this paper can be accessed here:
http://www.sdiarticle4.com/review-history/59254
35You can also read