HPLC-fluorescence detection for assay of tramadol binary mixtures with ibuprofen or chlorzoxazone in tablets and plasma: Analytical Eco-Scale and ...
←
→
Page content transcription
If your browser does not render page correctly, please read the page content below
HPLC-fluorescence detection for assay of
                                       tramadol binary mixtures with ibuprofen or
                                       chlorzoxazone in tablets and plasma: Analytical
                                       Eco-Scale and GAPI tools for green assessment
Acta Chromatographica
                                    MOHAMED M.A. HAMDY and MONA M. ABDEL MONEIMp
DOI:
10.1556/1326.2021.00901
© 2021 The Author(s)                Department of Pharmaceutical Chemistry, Faculty of Pharmacy, Pharos University in Alexandria,
                                    Alexandria, Egypt

                                    Received: February 6, 2021 • Accepted: April 28, 2021

ORIGINAL RESEARCH
                                    ABSTRACT
PAPER
                                    Tramadol, a strong pain killer known for its addictive problems is either co-administrated or co-
                                    formulated with other analgesics or muscle relaxants. The power of fluorescence detection in HPLC is
                                    tested to resolve such mixtures in plasma matrix to reach the required sensitivity with simple sample
                                    treatment using just protein precipitation. The aim of this work was to develop an eco-friendly and
                                    sensitive HPLC method with fluorimetric detection for analysis of Tramadol in its two binary mixtures
                                    with Ibuprofen (mixture 1) and Chlorzoxazone (mixture 2) in two combined dosage forms and spiked
                                    plasma. Separation was done using a C18 column with mobile phase of acetonitrile and water (pH 3.5)
                                    in gradient elution and 1 mL/min flow rate. Detection was carried out with λ excitation/λ emission of
                                    220 and 307 nm, respectively. The method was applied to detect the two binary mixtures in real plasma
                                    samples after invivo application to rats, to assure that the drugs’ metabolites do not affect the sensitivity
                                    or selectivity of the assay. Evaluation of greenness of the proposed method was done using semi-
                                    quantitative Eco-Scale and new Green Analytical Procedure Index which showed that this method can
                                    be a greener alternative with higher sensitivity for analysis of both mixtures. The method (15 min-assay)
                                    was linear over concentrations of 0.1–10 mg/mL and 0.1–33 mg/mL in plasma. In addition, the proposed
                                    method was validated per ICH as well as FDA bioanalytical methods’ validation guidelines.

                                    KEYWORDS
                                    tramadol, binary mixtures, HPLC-fluorescence detection, dosage form, green, plasma

                                    1. INTRODUCTION
                                    Different pain killers together with muscle relaxants are commonly used either over the
                                    counter or prescribed by physicians to relief moderate to severe pain especially associated with
                                    different musculoskeletal conditions. Thus, several combinations of analgesics (with or
                                    without muscle relaxants) are manufactured by different companies and launched in several
                                    markets. However, a lot of these combinations are not FDA approved nor tested for their
                                    pharmacological interactions. Therefore, it is necessary to find suitable analytical tools for
                                    simultaneous determination of these co-administered drugs in the same dosage form and
                                    especially in plasma to be available in hands for testing their pharmacokinetic interactions
p
                                    whenever needed.
  Corresponding author.
                                        Among these combinations found in the Indian market are two combinations of tramadol
E-mail: mona.abdelmoneim@pua.edu.
eg                                  hydrochloride (TM). The first combination is TM with chlorzoxazone (CL) a muscle
                                    relaxant. The second combination is with ibuprofen (IB), especially designed for osteoar-
                                    thritis patients, where TM would be an auxiliary to IB non-steroidal anti-inflammatory ac-
                                    tion. These two mixtures of TM have been co-formulated in tablets dosage forms to be used
                                    generally as a pain reliever, in cases of moderate and severe pain associated with musculo-

                                                                                                   Unauthenticated | Downloaded 09/01/21 01:04 AM UTC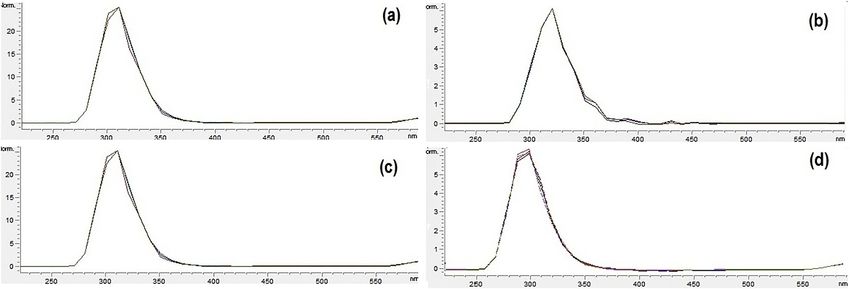
2                                                                                                         Acta Chromatographica

                  Fig. 1. Chemical structures of (a) Tramadol (TM); (b) Ibuprofen (IB); and (c) Chlorzoxazone (CL)

skeletal spasms or cancer diseases. Since, there are not            GlaxoSmithKline Co. (Egypt), respectively. Ibudol® tablets
enough studies for the pharmacological interaction between          containing 400 mg IB and 50 mg TM and MUZOX® tablets
TM and IB or CL when combined in the same dosage forms.             containing 250 mg CL and 50 mg TM (Stedman Pharma-
It was important to develop a pharmacokinetic tool to               ceuticals Pvt Ltd., India) were purchased from the local
analyze the three drugs in plasma for further pharmaco-             Indian market. Acetonitrile HPLC-grade (Sigma-Aldrich
logical testing of the combined drugs when required in the          Chemie GmbH, Switzerland), ortho-phosphoric acid (BDH
future.                                                             Laboratory Suppliers, England) and double distilled water
    TM is an opioid analgesic drug centrally acting that has        have been used.
been used since 1977 for the relief of strong physical pain.[1]
It is official in Indian [2], British [3] and United States [4]      2.2. Instrumentation
Pharmacopoeias. Chemically it is (1RS,2RS)-2-[(dimethyla-
                                                                    Chromatographic analysis was performed using Agilent
mino)methyl]-1-(3-methoxyphenyl)cyclohexanol hydrochlo-
                                                                    1260 device (USA) equipped with auto-injector, quaternary
ride (Fig. 1a). IB, chemically is (2RS)-2-[4-(2-methylpropyl)
                                                                    pump and fluorescence detector (G1321C). Agilent Chem-
phenyl]propanoic acid (Fig. 1b), belongs to the NSAIDs (non-
                                                                    Station Software also has been used for data analysis. A
steroidal anti-inflammatory drugs) and is also official in the
                                                                    reversed phase Agilent Zorbax SB-C18 (150 3 4.6 mm) col-
three pharmacopeias.[2–4] CL is chemically, 5-Chloro-2-
                                                                    umn thermostated at ambient temperature (25 8C) has been
benzoxazolinone (Fig. 1c). It is a centrally acting muscle
                                                                    used for the chromatographic separation with mobile phase
relaxant that is official in United States Pharmacopoeia [4].
                                                                    flow rate of 1 mL/min. The mobile phase used consisted of
    Binary combinations of TM with IB or CL in their
                                                                    acetonitrile and water acidified with orthophosphoric acid to
dosage forms challenging ratios (1:8, TM: IB and 1:5, TM:
                                                                    pH 3.5. Step wise gradient elution system has been used
CL) were estimated in the literature by very few reported
                                                                    starting with 17 and 83% (v/v) acetonitrile and acidified
analytical methods including spectrophotometry [5, 6],
                                                                    water, respectively, from 0 to 2 min then switched to 70 and
HPLC [1, 6, 7], HPTLC [7, 8] and spectrofluorimetry [9].
                                                                    30% (v/v) acetonitrile and acidified water, respectively, and
However, by searching the literature, there were not any
                                                                    this ratio was kept till the end (14 min). The fluorescence
methods reported for the determination of the two binary
                                                                    detector was set to 220/307 nm (λ excitation/λ emission) for
mixtures in biological samples. In a resource limited settings,
                                                                    determination of the three studied analytes (TM, IB and
highly sensitive sophisticated instruments as mass spec-
                                                                    CL).
troscopy would be not available and costly. An HPLC with
fluorescence detector is a good choice to provide high
                                                                    2.3. Methods
sensitivity, compared to commonly used UV detection, and
low quantitation limit (QL) which are essential for plasma
analysis.                                                           2.3.1. Standard stock solutions. Standard stock solutions of
    Therefore, the aim of this work was to establish a fast and     TM, IB and CL (1000 mg/mL) were prepared by dissolving
simple HPLC method with fluorescence detection, due to its          100 mg, accurately weighed, of the authentic material of each
high sensitivity, for the simultaneous determination of TM,         drug in 100 mL methanol. Stability of the three prepared
IB and CL in bulk form, dosage forms and plasma. Vali-              stock solutions was 14 days when stored at 4 8C protected
dation was fulfilled in accordance with the ICH “Interna-           from light.
tional Conference on Harmonization” [10] and the “FDA”
Food and Drug Administration [11].                                  2.3.2. Calibration graphs for TM and IB/CL analysis in
                                                                    dosage forms. TM, IB and CL standards (1000 mg/mL)
                                                                    were diluted by methanol to working solutions of 200 mg/mL
2. EXPERIMENTAL                                                     each. The calibration standards were prepared by trans-
                                                                    ferring accurate micro-volumes (5–500 mL) of each of TM,
                                                                    IB and CL working solutions into three separate sets of
2.1. Chemicals and reagents
                                                                    10 mL volumetric flasks and diluted to volume with meth-
TM (99.0% purity), IB (99.9% purity) and CL (99.9% purity)          anol to obtain a final calibration range of 0.1–10 mg/mL for
were kindly provided by Fluka BioChemika (Switzerland),             all drugs. Triplicates HPLC injections (20 mL) of each drug
EIPICO     Pharmaceutical     Industries   (Egypt)    and           calibration solution were injected using the chromatographic

                                                                                             Unauthenticated | Downloaded 09/01/21 01:04 AM UTC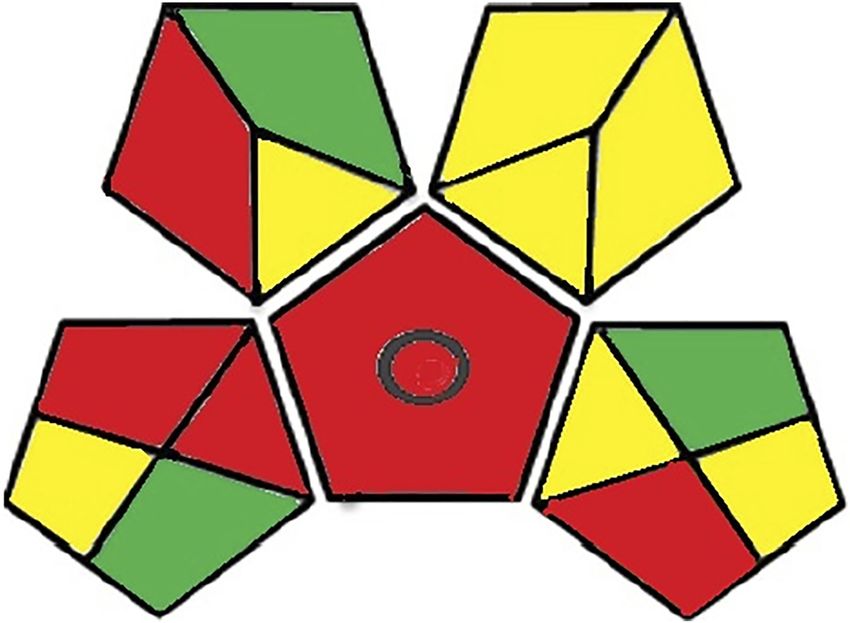
Acta Chromatographica                                                                                                             3

conditions previously mentioned (Section 2.2). The obtained      2.3.6. In vivo application. Two groups each of six male
peak area means were plotted against their corresponding         Wistar rats weighing 200–250 gm were used for the in vivo
concentrations so the calibration curves and regression          study. Animals were housed under controlled conditions
equations would be obtained.                                     (25 ± 10 8C, RH 55 ± 10%). They were allowed to adapt to
                                                                 the housing environment for at least 1 week before the study.
2.3.3. Calibration graphs for TM and IB/CL analysis in           Diet was prohibited for 12 h before the experiment but water
plasma. A series of working standards for plasma calibra-        was freely available. Group (1) was treated with 20 mg/kg
tion curve and quality control samples "QCs" were prepared.      TM [12] and 17.8 mg/Kg IB [13] and group (2) was treated
Five different volumes of each of TM, IB and CL standard         with 20 mg/kg TM [12] and 15 mg/Kg CL [14]. All drugs
stock solutions (1000 mg/mL) were transferred into three         were orally administered once, and then six blood samples
series of five 10 mL volumetric flasks separately and              were collected from each group by retro-orbital bleeding at 3
completed to mark with methanol to achieve a final working        specific time intervals for each drug in its mixture, which are
concentration range of (1–330 mg/mL). Aliquots of 250 mL         tmax, taverage (average time interval between tmax and t1/2) and
plasma were spiked separately with 25 mL of each of the TM       t1/2 of each drug. The blood samples were immediately
and IB or TM and CL working solutions (1–330 mg/mL) and          collected to K2-EDTA tubes and centrifuged at 4000 rpm
25 mL of IS solution, from working solution of 100 mg/mL,        (10 min) to obtain plasma. The plasma samples were then
(CL as IS for TM/IB mixture and IB as IS for TM/CL               stored at 80 8C until analysis time.
mixture) followed by 500 mL of acetonitrile to achieve con-
centrations in the range of 0.1–33 mg/mL plasma for the
three concerned drugs with fixed IS concentration of 10 mg/       3. RESULTS AND DISCUSSION
mL plasma in all samples. After vortex mixing for 2 min,
centrifugation was done for 15 min in a cooling centrifuge       3.1. Chromatographic method development and
(4 8C) at 15,000 rpm. The supernatant was then filtered by
a 0.45 mm syringe adapter. A 20 mL volume was then injected
                                                                 optimization
in triplicate and chromatographed. In addition, QCs were         Several factors affected the separation and resolution of TM
prepared in the same way, 0.1, 0.3, 10 and 30 mg/mL plasma,      in its binary mixtures with IB and CL. All these factors were
by spiking 25 mL of their respective working standards in        optimized independently to achieve the best chromato-
blank plasma to be LLOQ “lower limit of quantification”,          graphic system suitability parameters. For selection of the
LQC “low QC”, MQC “mid QC” and HQC “high QC”,                    stationary phase, some columns have been tried such as C8
respectively. The ratios of peak areas of analyte/IS against     (250 3 4.6 mm),       C18     (150 3 4.6 mm)        and     C18
corresponding drug concentrations were plotted for cali-         (250 3 4.6 mm). However, the best separation in terms of
bration graphs construction.                                     sensitivity, resolution and baseline noise was achieved using
                                                                 the Zorbax SB-C18 (150 3 4.6 mm) column. Different mobile
2.3.4. Analysis of synthetic mixtures. Accurate volumes of       phases were tried in order to achieve the best separation
standard solutions of TM, IB or CL were transferred into a set   between TM and IB and/or CL in a reasonable analysis time.
of five 10 mL volumetric flasks then dissolved to volume with    Mobile phases of different organic modifiers in different ra-
methanol. Portions of 20 mL of each mixture in triplicates       tios (methanol, ethanol or acetonitrile) were tried. Acetoni-
were chromatographed and the % recoveries were calculated.       trile gave the best results in terms of separation and peak
                                                                 symmetry. A high acetonitrile ratio was essential to elute IB
2.3.5. Analysis of TM and IB/CL dosage forms. Five Ibu-          but that caused TM to co-elute with the solvent front. Several
dol® tablets were weighed and powdered. Into a 25 mL             isocratic trials were attempted to try to reach a mobile phase
volumetric flask, a powder weight equivalent to 25 mg IB         ratio that separated both TM and IB within reasonable
and 3.125 mg TM was transferred using 15 mL methanol.            retention times and also away from early retention times
Five MUZOX® tablets were also weighed and powdered.              were the plasma co-eluting peaks may interfere. However,
Into another 25 mL volumetric flask, accurate powder             none of these trials succeeded due to the huge difference in
weight equivalent to 25 mg CL and 5 mg TM was trans-             retention times of TM and IB, so the only solution was to go
ferred. After 15 min sonication, the flasks were completed to    for gradient programming. After numerous trials to reach the
volume with methanol and filtered using filter paper             optimum gradient system to achieve the required separation
(Whatman). Aliquots of 80 and 50 mL from each of the             between the drugs of interest, the system of choice was to
Ibudol® tablet sample solution (mixture 1) and the               start with 17 and 83% (v/v) acetonitrile and acidified water,
MUZOX® tablet sample solution (mixture 2), respectively,         respectively, till 2 min then switched to 70 and 30% (v/v)
were transferred separately into two 10 mL volumetric flasks      acetonitrile and acidified water, respectively. Different buffers
and diluted to mark with methanol. The concentrations            such as phosphate, acetate and formate buffers at different
achieved after dilution were 8 mg/mL of IB and 1 mg/mL of        pH values (pH 3.0–7.0) were tried in the beginning of the
TM (mixture 1) and 5 mg/mL CL and 1 mg/mL TM (mixture            study. Using buffers resulted in peaks tailing and distortion
2). Aliquots of 20 mL were injected and chromatographed as       of the baseline. Also, pure water caused broadening of the
previously. The percentage recoveries were calculated using      peaks due to its neutral pH value so water with the addition
the previously computed regression equation (section 2.3.2).     of phosphoric acid to maintain the pH acidic (3.5) was used.

                                                                                        Unauthenticated | Downloaded 09/01/21 01:04 AM UTC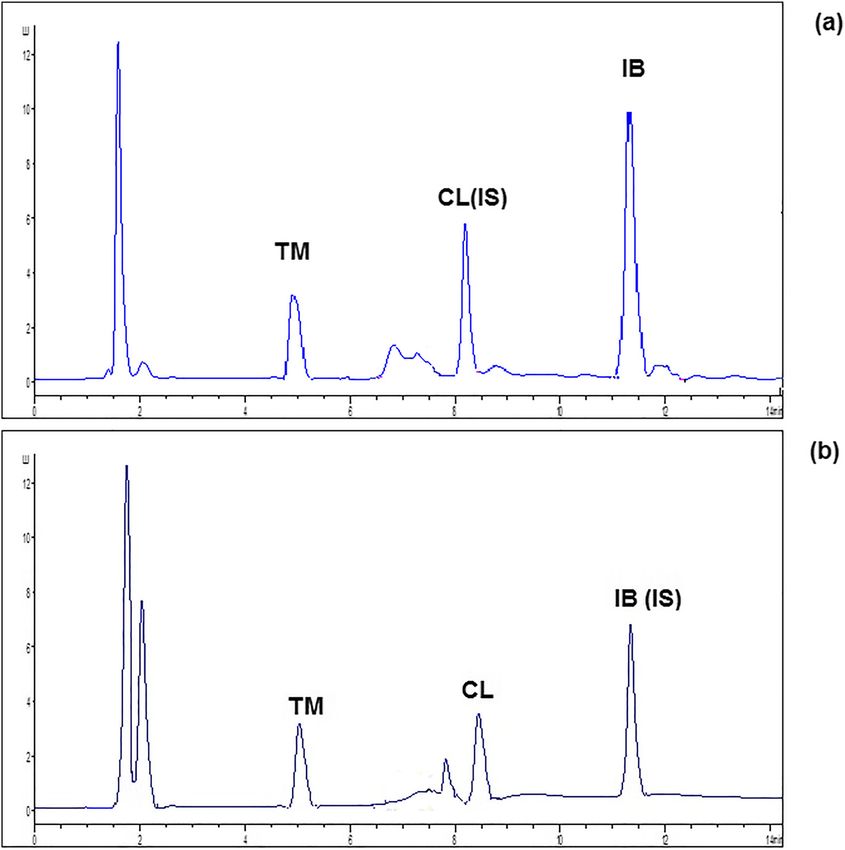
4                                                                                                              Acta Chromatographica

                                      Table 1. System suitability parameters of the HPLC system used
                         Retention time                                                                                          Efficiency
Mixture      Analyte       (Rt), min          Capacity factor (k0 )   Selectivity (a)   Resolution (Rs)    Asymmetry (Af)        (plates/m)
Mixture 1      TM              4.92                   2.04               2.96               49.01                 0.92            25,978.79
               IB             11.38                   6.03              ————               ————                   1.11           103,488.39
Mixture 2      TM              4.92                   2.04               2.04                27.6                 0.91            25,809.41
               CL              8.37                   4.17              ————               ————                   1,10            68,952.58
k0 (210), a > 1, Rs > 2, Af (0.8–1.2) and plates.m1 (> 2000)

    It was important to optimize the pH of acidified water so           3.4. Method Validation
pH 3 to 9 was tried. The optimum pH was 3.5 as it gave the
best separation and least tailing for TM and CL and also                The ICH [10] and the FDA [11] for bioanalytical method
after optimizing the gradient system and flow rate, this pH             validation guidelines have been followed for validation.
was also optimum for IB separation and peak symmetry.
    Flow rate was also optimized to enhance the resolution of           3.4.1. Linearity and range validation. Linearity has been
peaks. The flow rate has been adjusted over the range of 0.5–           studied to determine the range in which the analytes’ re-
2 mL/min. The optimum chosen flow rate was 1 mL/min,                    sponses are linear with their concentrations (n 5 5). By
which gave the best separation in reasonable retention time.            plotting peak areas (for dosage form analysis) or peak areas/
Flow rates below 1 mL/min caused prolonged retention time.              IS peak area (for plasma analysis) against drugs’ concen-
Increasing the flow rates caused resolution and retention               trations (Table 2), the graphs obtained showed linear re-
time to decrease. After optimization of chromatographic                 lationships. The slopes, intercepts, and correlation
parameters, all system suitability parameters have been                 coefficients obtained by the linear least squares regression
measured and compared to reference values as they are                   treatment of the results together with the standard de-
essential for validation of the analytical method (Table 1).            viations of intercept (Sa), slope (Sb) and residuals (Sy/x),
                                                                        indicating the closeness of the points to the line, are pre-
                                                                        sented for each compound in Table 2. All obtained results
3.2. Sample extraction optimization                                     were within the acceptable limits indicating the validity of
Protein precipitation is the method of choice for extraction            the method. The correlation coefficients (r ≥ 0.9990)
in several reports [15, 16] due to its simplicity and green-            together with the low F-values indicate the good linearity of
ness. Protein precipitation does not involve extraction with            the calibration graphs.
amounts of organic solvents nor huge number of steps like                   Generally, the proposed method offered a LLOQ
liquid-liquid or solid-liquid extractions. Both methanol and            0.1 mg/mL in plasma for the three drugs. The reported Cmax
acetonitrile were tried; but acetonitrile was a stronger pro-           of TM, CL and IB after oral administration in plasma is
tein precipitating agent. There was no need to add strong               within the linearity range of the three drugs [17-19] and
acids nor pH adjustment nor evaporating the solvent to                  higher than the LLOQ of this assay. Thus, this method is
dryness. The 2:1 acetonitrile/plasma ratio was sufficient to             enough sensitive for the simultaneous quantitation of TM
precipitate the proteins and obtain good recovery for all               and IB or TM and CL in routine pharmacokinetic studies.
drugs with the required sensitivity without breaching the               Representative chromatograms of plasma spiked with LLOQ
rules of green analysis.                                                levels are shown in Fig. 2.

3.3. Fluorescence sensitivity and internal standard                     3.4.2. Detection Limit (DL) and Quantitation Limit (QL)
                                                                        validation. Signal to noise ratio “S/N” method was used to
selection                                                               calculate DL and QL where the S/N ratio is 3/1 and 10/1 for
Fluorescence detection offers higher selectivity and sensi-             DL and QL, respectively. The DL/QL values of the proposed
tivity compared to UV. So this advantage was used in this               HPLC method are proposed in Table 2.
study, as the three drugs have native fluorescent nature.
Several excitation and emission wavelengths were tried. The             3.4.3. Accuracy and precision validation. In order to
best λ excitation was found to be 220 nm that gave highest              assess the accuracy and precision of the proposed method in
fluorescence signals for the three drugs especially the minor            separating and resolving the two studied binary mixtures in
component (TM) and the three drugs had acceptable cor-                  different ratios. Five different synthetic mixtures were cho-
responding emission at 307 nm. Regarding internal standard              sen and prepared as mentioned above in section 2.3.4.
selection, it was difficult to find a fluorescent sensitive                including the dosage form ratio of the two mixtures and
compound at an appropriate retention time, with minimum                 analysed. The mean percentage recoveries, the relative error
interference of the plasma matrix and high resolution under             values and relative standard deviation values indicate
the proposed chromatographic conditions. Thus, CL was                   excellent accuracy and precision (Table 3) and proved no
chosen as IS for TM/IB mixture and IB was chosen as an IS               matter the concentration of each drug relative to the other,
for TM/CL mixture.                                                      the method separate the drugs accurately and precisely.

                                                                                                  Unauthenticated | Downloaded 09/01/21 01:04 AM UTC
Acta Chromatographica 5
Table 2. Parameters of regression for TM/IB and TM/CL determination by the proposed method
For dosage form analysis For plasma analysis
Parameter TM IB CL TM IB TM CL
Linearity range, (mg/mL) 0.1–10 0.1–10 0.1–10 0.1–33* 0.1–33* 0.1–33* 0.1–33*
QL (mg/mL) 0.10 0.10 0.10 0.10* 0.10* 0.10* 0.10*
DL (mg/mL) 0.03 0.03 0.03 0.03* 0.03* 0.03* 0.03*
Intercept 35.76 21.29 8.03 0.11 0.06 0.24 0.03
Slope 122.98 97.98 49.28 0.07 0.15 0.15 0.03
Correlation Coefficient, r 0.9995 0.9991 0.9996 0.9990 0.9993 0.9991 0.9995
Sa 12.14 12.65 3.92 0.03 0.05 0.06 9.21 x 10³
Sb 2.34 2.43 0.75 1.89 x 10³ 3.24 x 10³ 3.75 x 10³ 5.50 x 10⁴
Sy/x 18.40 19.17 5.94 0.05 0.08 0.10 0.01
F 2770.69 1620.59 4270.17 1561.72 2093.67 1669.57 2871.82
Significance F 1.51 x 10⁵ 3.37 x 10⁵ 7.90 x 10⁶ 3.57 x 10⁵ 2.30 x 10⁵ 3.23 x 10⁵ 1.43 x 10⁵
“Sa” standard deviation of intercept, “Sb” standard deviation of slope and “Sy/x” standard deviation of residuals (*mg/mL plasma)
Fig. 2. HPLC with fluorescence detection chromatograms of TM and IB (mixture 1) and CL (IS) (a) and TM and CL (mixture 2) and IB (IS)
(B) in extracted plasma spiked at the LLOQ levels
In plasma, validation of accuracy and precision was 3.4.6. Selectivity validation. Selectivity of the proposed
done at the four QC levels. Replicates (n 5 6) of each HPLC method for TM and IB/CL combined tablets analysis,
concentration were analyzed on same day or on several was previously assessed in the results where the percentage
days for intra- and inter-day evaluation of precision, relative errors < 2% proves the selectivity well. The absence
respectively (Table 4). of interference from the tablets’ excipients, also demon-
strates the selectivity of the method (Table 6).
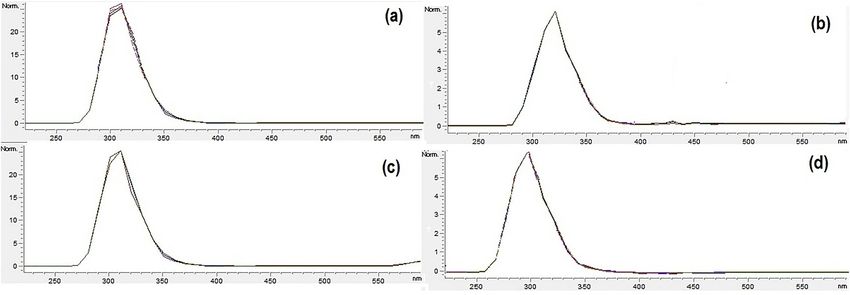
3.4.4. Recovery validation. Recoveries of TM, IB and CL The HPLC peak purity of the TM, IB and CL was also
spiked to plasma, at LQC and HQC levels, were calculated checked. The purity angle was within the purity threshold
by comparing the results of the spiked samples to the limit for all drugs. In addition, the emission spectra of TM,
standards’ drugs solutions. All extraction recoveries were IB and CL were recorded at different time intervals across
between 96 and 99% and the mean recovery of IS of mixture their peaks indicates the purity of the peaks in their dosage
1 was 98% and of mixture 2 was 96.5%. These results forms (Fig. 3) and also in plasma samples (Fig. 4).
indicate successful complete extraction just after simple In plasma samples, no evidence of interfering peaks was
protein precipitation pretreatment step. noticed throughout the analysis. Chromatograms showing
blank plasma and plasma spiked only with the ISs of the two
3.4.5. Robustness validation. Robustness of the proposed mixtures are shown in Fig. 5a and b, respectively where no
method was assessed through analysis of synthetic mixtures interference is noticed.
with deliberate variation of selected chromatographic pa-
rameters including pH of the acidified water and its per- 3.4.7. Stability. The stability results of TM, IB and CL were
centage, flow rate and temperature. All deliberate variations obtained at LQC and HQC (n 5 6) under freeze–thaw,
showed no influence on resolution or recoveries of the postpreparative, short-term and long-term stability condi-
studied drugs (Table 5). tions in Table 7. The stock solutions and working standard
Unauthenticated | Downloaded 09/01/21 01:04 AM UTC6
Table 3. Precision and accuracy assessment of the proposed method for determination of TM/IB and TM/CL in synthetic mixtures
Mixture 1 Mixture 2
TM IB TM CL
TM IB TM CL
Concentration Mean % Concentration Mean % Mean %
(mg/mL) Mean % Recovery ± %RSD %Er Recovery ± %RSD %Er (mg/mL) Recovery ± %RSD %Er Recovery ± %RSD a
%Er
Results of accuracy and Intra-day precision, (n 5 5)
1.00 8.00 99.20 ± 1.30 0.80 100.97 ± 0.99 0.97 1.00 5.00 101.07 ± 1.50 1.07 98.10 ± 1.20 1.90
0.10 2.00 100.30 ± 1.20 0.30 100.50 ± 1.79 0.50 0.10 2.00 100.77 ± 1.00 0.77 100.04 ± 1.99 0.04
3.50 10.00 100.05 ± 1.94 0.05 99.99 ± 1.02 0.01 3.50 10.00 101.09 ± 0.89 1.09 100.75 ± 1.80 0.75
2.00 0.10 98.20 ± 1.00 1.80 100.19 ± 0.90 0.19 2.00 0.10 99.87 ± 0.99 0.13 99.05 ± 1.09 0.95
8.00 0.50 100.55 ± 1.25 0.55 100.50 ± 1.99 0.50 5.00 0.50 99.90 ± 0.87 0.10 100.65 ± 0.60 0.65
Grand mean 99.66 ± 1.34 0.34 100.43 ± 1.34 0.43 Grand mean 100.54 ± 1.05 0.54 99.72 ± 1.34 0.28
Results of accuracy and Inter-day precision, (n 5 5)
1.00 8.00 98.22 ± 1.80 1.78 99.59 ± 0.90 0.41 1.00 5.00 100.99 ± 1.00 0.99 100.40 ± 1.74 0.40
0.10 2.00 99.10 ± 0.89 0.90 99.67 ± 1.87 0.33 0.10 2.00 99.91 ± 1.50 0.09 99.55 ± 1.99 0.45
3.50 10.00 101.30 ± 0.99 1.30 98.30 ± 1.20 1.70 3.50 10.00 102.00 ± 1.99 2.00 99.90 ± 1.23 0.10
2.00 0.10 100.44 ± 0.88 0.44 100.09 ± 0.85 0.09 2.00 00.10 100.50 ± 1.98 0.50 100.55 ± 1.83 0.55
8.00 0.50 99.99 ± 1.78 0.01 99.50 ± 1.11 0.50 5.00 00.50 101.35 ± 1.01 1.35 101.59 ± 0.99 1.59
Grand mean 99.81 ± 1.27 0.19 99,43 ± 1.19 0.57 Grand mean 100.95 ± 1.50 0.95 100.40 ± 1.56 0.40
Unauthenticated | Downloaded 09/01/21 01:04 AM UTC
•“%Er” percentage of relative error
•“%RSD” percentage of relative standard deviation
Acta ChromatographicaActa Chromatographica 7
Table 4. Precision and accuracy assessment of the proposed method for determination of TM/IB and TM/CL in plasma
Intra-day Inter-day
Theoretical Calculated Calculated
concentration concentration Mean % % concentration Mean % %
Concentration (mg/mL) (mg/mL) Recovery ± SD* RSD %Er (mg/mL) Recovery ± SD* RSD %Er
TM
LLOQ 0.1 0.301 100.33 ± 1.00 1.00 0.33 0.305 101.67 ± 1.68 1.65 1.67
LQC 0.3 0.605 101.83 ± 1.35 1.33 1.83 0.609 101.50 ± 1.22 1.20 1.50
MQC 10.0 10.110 101.10 ± 1.25 1.24 1.10 10.255 102.55 ± 0.88 0.86 2.55
HQC 30.0 30.051 100.17 ± 1.29 1.29 0.17 30.005 100.02 ± 1.77 1.77 0.02
IB
LLOQ 0.1 0.318 102.25 ± 1.55 1.52 2.25 0.350 105.00 ± 1.89 1.80 5.00
LQC 0.3 0.656 102.55 ± 1.99 1.94 2.55 0.625 102.00 ± 1.25 1.26 2.00
MQC 10.0 5.355 103.04 ± 0.85 0.82 3.04 10.077 101.55 ± 0.97 0.96 1.55
HQC 30.0 30.089 100.07 ± 1.00 1.00 0.07 30.187 104.10 ± 1.34 1.29 4.10
CL
LLOQ 0.1 0.321 103.88 ± 1.90 1.83 3.88 0.334 100.50 ± 1.00 1.00 0.50
LQC 0.3 0.678 101.66 ± 0.99 0.97 1.66 0.622 102.60 ± 1.69 1.65 2.60
MQC 10.0 10.550 104.07 ± 0.23 0.22 4.07 10.902 101.99 ± 1.25 1.23 1.99
HQC 30.0 30.099 100.67 ± 1.50 1.49 0.67 30.561 100.44 ± 1.00 1.00 0.44
*standard deviation of six determinations
Table 5. Robustness assessment for determination of TM/IB and TM/CL
HPLC–FD method*
TM IB CL
RSD % of RSD % of RSD % of
Parameters tested peak areas Rt ± SD peak areas Rt ± SD peak areas Rt ± SD
2 2
1) Mobile phase ratio 0.50 4.92 ± 2.0 3 10 1.50 11.38 ± 1.5 3 10 1.80 8.36 ± 2.2 3 102
[±1 % organic phase]
2) Flow rate 0.41 4.91 ± 2.5 3 102 0.80 11.38 ± 3.9 3 102 1.00 8.37 ± 4.5 3 102
[1 ± 0.1 mL/min]
3) Column temperature 0.12 4.92 ± 3.4 3 102 1.50 11.36 ± 5.5 3 102 1.97 8.36 ± 5.5 3 102
[25 oC ± 2 oC]
4) pH of the aqueous 0.90 4.93 ± 3.6 3 102 0.65 11.39 ± 3.1 3 102 1.55 8.37 ± 1.54 3 102
phase [3.5 ± 0.5]
* Mean of 3 concentrations levels 0.5, 5 and 10 mg/mL of TM, IB and CL
of TM, IB and CL were stable for 14 days at refrigerator 3.6. Application for determination of TM and IB/CL in
temperature and for at least 6 h at ambient temperature. The plasma samples
RSD% not exceeding 4% and Er% not exceeding 10% indi-
cate good stability of the drugs under all the studied con- The developed method was applied successfully for deter-
ditions. Further forced degradation studies will be conducted mination of TM and IB/CL in plasma with only simple
by the authors in a future study to investigate the stability of protein precipitation step with excellent correlation co-
the combinations under different conditions as done in their efficients for the calibration curves (0.1–33 mg/mL plasma)
previous assays [20]. and very low LLOD below the reported Cmax of the three
studied drugs.
3.5. Application for determination of TM and IB/CL in
their combined tablets dosage form 3.7. In vivo application
The proposed method was implemented for the analysis The applicability of the method to real clinical practice was
of TM in its co-formulated tablets with either IB or CL. assessed by therapeutic drug monitoring of the two binary
Figure 6 shows the HPLC chromatograms, of the assayed mixtures in plasma samples from laboratory rats orally
pharmaceutical preparations with no interferences. The treated with the concerned drugs. The proposed method was
obtained results were not only in agreement with the labeled applied for the determination of TM and IB or CL in plasma
claims but also compared with those of the comparison after a single oral dose of TM in combination with IB or CL.
methods [1, 6] (Table 6). Real plasma samples were obtained at different intervals as
Unauthenticated | Downloaded 09/01/21 01:04 AM UTC8 Acta Chromatographica
Table 6. Assay results for the determination of TM, IB and CL in their drug products using the proposed method
% Found ± SDa, n 5 5
TM IB
Proposed HPLC Comparison HPLC-UV Proposed HPLC Comparison HPLC-UV
method method [6] method method [6]
Mixture 1 (TM/IB)
Ibudol® tablets 99.71 ± 0.87 100.78 ± 0.54 100.39 ± 0.91 100.51 ± 0.49
Students' t-test (t) * 0.07 0.82
Variance ratio F-test (F) * 2.62 3.47
% Found ± SDa, n 5 5
TM CL
Proposed HPLC Comparison HPLC-UV Proposed HPLC Comparison HPLC-UV
® method method [1] method method [1]
Mixture 2 (TM/CL) MUZOX
tablets 101.13 ± 0.83 101.56 ± 0.96 100.72 ± 1.18 100.48 ± 1.06
Students' t-test (t) * 0.58 0.81
Variance ratio F-test (F) * 0.20 0.13
* Theoretical values, at 95% confidence limit, of t and F are 2.31 and 6.39, respectively
Fig. 3. Emission spectra illustrating peak purity of (a) TM and (b) IB (mixture 1) and (c) TM and (d) CL each is obtained from their tablets
solutions for the HPLC method
Fig. 4. Emission spectra illustrating peak purity of (a) TM and (b) IB (mixture 1) and (c) TM and (d) CL in plasma samples for the HPLC
method
Unauthenticated | Downloaded 09/01/21 01:04 AM UTCActa Chromatographica 9
Fig. 5. HPLC with fluorescence detection chromatograms for treated blank plasma (A) and treated blank with IS plasma (B)
Table 7. Stability tests of TM, IB and CL in plasma (n 5 6)
TM IB CL
QC Mean % Mean % Mean %
Stability samples Recovery ± %RSD %Er Recovery ± %RSD %Er Recovery ± %RSD %Er
Short-term room LQC 103.02 ± 1.90 3.02 99.00 ± 1.67 1.00 102.43 ± 0.70 2.43
temperature (6 h) HQC 102.22 ± 0.90 2.22 103.89 ± 1.70 3.89 100.50 ± 1.20 0.50
Freeze-thaw (3 cycles, at LQC 102.40 ± 1.77 2.40 100.34 ± 1.09 0.34 99.00 ± 0.71 1.00
70 8C) HQC 101.09 ± 1.50 1.09 101.99 ± 1.20 1.99 101.76 ± 0.50 1.76
Post preparative 5 8C for LQC 101.56 ± 1.45 1.56 98.50 ± 0.90 1.50 100.40 ± 1.99 0.40
24 h HQC 100.21 ± 0.87 0.21 97.20 ± 0.99 2.80 99.01 ± 1.98 0.99
Long-term 45 days at LQC 103.44 ± 1.12 3.44 100.60 ± 0.92 0.60 97.54 ± 0.98 2.46
70 8C HQC 100.46 ± 1.00 0.46 101.16 ± 1.66 1.16 100.09 ± 0.43 0.09
collected in Table 8. At the day of analysis, calibration one (treated with TM/IB) or group two (treated with TM/
standards and QC samples were analyzed in parallel with the CL) were in compliance with the previously reported
real plasma samples. Figure 7 shows representative chro- pharmacokinetic studies for each single drug. [12–14, 21,
matogram of real rat plasma samples with no interference 22].
from any metabolites that may have not appeared in spiked
plasma samples. The peak shape and chromatographic res-
olution of the analytes were identical to those obtained from
3.8. Assessment of greenness of the method
spiked plasma samples. The obtained results in Table 8 and Green chemistry gained huge concern recently as it can be
Fig. 7 ensures the ability of the method to assay the drugs perceived as a contribution of analysts to the sustainable
after their administration with no interference and with the development trend. The analytical methods’ green evalu-
required selectivity and accuracy. All determined concen- ation can be challenging due to the many factors to be
trations were within the proposed calibration range. In considered in method development as eliminating or
addition the Cmax of all drugs obtained either from group reducing the use of reagents and decreasing energy
Unauthenticated | Downloaded 09/01/21 01:04 AM UTC10 Acta Chromatographica
Fig. 6. HPLC with fluorescence detection chromatograms of (a) Ibudol® tablet sample solution containing 1 mg/mL of TM and 8 mg/mL of IB
(mixture 1) and (b) MUZOX® tablet sample solution containing 1 mg/mL of TM and 5 mg/mL CL (mixture 2)
Table 8. Data regarding drug posology and the corresponding plasma concentration of TM, IB & CL collected from male Wistar rats after
applying the developed method
Monitored Dose (mg/Kg) Time sample Mean plasma
Mixture Drug (single oral dose) collection (min) concentration ± SD (mg/mL)
Mixture 1 (TM, IB) TM 20 Tmax (60) 1.15 ± 2.09
(n 5 6) Taverage (180) 0.91 ± 1.98
t1/2 (300) 0.50 ± 2.50
IB 17.8 Tmax (32) 35.0 ± 1.50
Taverage (70) 25.56 ± 0.99
t1/2 (108) 11.67 ± 1.50
Mixture 2 (TM, CL) TM 20 Tmax (60) 1.18 ± 1.22
(n 5 6) Taverage (180) 1.03 ± 2.00
t1/2 (300) 0.55 ± 2.66
CL 15 Tmax (20) 1.60 ± 0.87
Taverage (60) 1.09 ± 0.99
t1/2 (99) 0.77 ± 1.09
consumption and wastes. Some measures may be adopted some cases, it is very difficult to reach full green chemistry
to make greener approaches such as using safer and more in certain aspects. For example, one of the main chal-
degradable solvents and reducing hazardous wastes and lenges is the multi-step nature of most analytical pro-
number of steps in analytical procedures. However, in cesses. Also, Tobiszewski et al. [23] pointed out that the
Unauthenticated | Downloaded 09/01/21 01:04 AM UTCActa Chromatographica 11
Fig. 7. HPLC with fluorescence detection chromatograms of the two binary mixtures in extracted real rat plasma samples at 60 min after oral
administration of 20 mg/kg TM and 17.8 mg/Kg IB (a) and 20 mg/kg TM and 15 mg/Kg CL (b), each spiked with its respective IS
Table 9. Points of penalty according to the Eco Scale of the
proposed HPLC method
Reagents Penalty points
Acetonitrile 4
Phosphoric acid 2
Instrumentation Penalty points
LC 1
Occupational hazard 0
Waste 6
Centrifuge 1
Sonicator 1
Sum of penalty points 15
Final score 85
least green step in analytical process is sample preparation Fig. 8. Green assessment profile for the proposed HPLC with
step which is sometimes would be difficult to simply or fluorescence detection method using the GAPI tool
eliminate.
To assess greenness of analytical methods, in a qualita-
tive approach, several Internet databases are useful such as Van-Aken et al. [24] developed an interesting semi-
the NEMI “National Environmental Methods Index”, or the quantitative approach to greenness evaluation of organic
Green Chemical Alternatives Wizard developed by Massa- synthesis, that is called the Eco-Scale, this scales assumes that
chusetts Institute of Technology. an ‘‘ideal’’ system, has a score of 100, which is 100% safe for
Unauthenticated | Downloaded 09/01/21 01:04 AM UTC12 Acta Chromatographica
both the analyst and the environment. Penalty points are used REFERENCES
for parameters deviating from the ideal value are which lower
the overall score. The higher the score, the greener the pro-
cedure is. In 2012, an Eco-Scale for evaluation of green anal- 1. Dutta, M.; Wakode, S. Anal. Chem. Indian J. 2018, 18, 127.
ysis was developed in the same approach.[25] The Eco-Scale 2. The Indian Pharmacopoeia, Controller of publications, New Delhi,
result of the proposed HPLC method is 85 showing excellent 1996.
greenness (Table 9). This high score is due to using only one 3. The British Pharmacopoeia Commission, The British Pharmaco-
organic modifier in a very low percentage which is acetonitrile, poeia, TSO, London, United Kingdom, 2018.
a low toxicity solvent, instead of the commonly used hazard 4. USP-NF The United States Pharmacopeia, 33rd ed.—The National
combination solvents. In addition, the sample pretreatment Formulary, 28th ed. United States Pharmacopeial Convention, Inc,
was done by simple protein precipitation using also acetoni- USA, 2011.
trile only. 5. Puranik, M.; Hirudkar, A.; Wadher, S.; Yeole, P. Indian J. Pharm.
Another new green assessment tool is the Green Sci. 2006, 68, 737.
Analytical Procedure Index “GAPI”. It uses pentagrams to 6. Thomas, A.; Dumbre, N.; Nanda, R.; Kothapalli, L.; Chaudhari, A.;
evaluate the environmental impact of each step in the pro- Deshpande, A. Chromatographia 2008, 68, 843.
cedure using colors of three: red, yellow and green to 7. Ahmed, H.M.; Elshamy, Y.S.; Talaat, W.; Labib, H.F.; Belal, T.S.
represent high, medium and low impacts, respectively. This Microchem. J. 2020, 153, 104505.
visual presentation allows researchers to make judgments 8. Gandhimathi, M.; Ravi, T.K. JPC-J. Planar Chromat. 2008, 21, 305.
about conflicting green criteria and compare between 9. Abdel Moneim, M.M.; Hamdy, M.M.A. Luminescence 2020.
different methods to choose the greenest one for a particular 10. ICH Guidelines Validation of Analytical Procedures: Text and
purpose.[9] Figure 8 shows the pentagrams of the proposed Methodology Q2 (R1), International Conference on Harmonization,
method having low environmental impact based on the used Geneva, Switzerland, 2005, pp 11–2.
reagents and instrumentation. 11. Food, U., Administration, D., Guidance for Industry, Bioanalytical
Methods Validation, 2001.
12. Zhang, H.; Zhao, Y.; Wang, X.; Zhang, Q. Biopharm. Drug Dispos.
4. CONCLUSION 2014, 35, 525.
13. Medina, J.R.; Jung, H.; Hurtado, M.; Soria, O.; L opez-Mu~ noz, F. J.
Int. J. Pharm. Sci. Res. 2017, 8, 1.
This work proposes a robust and valid HPLC method with
14. Wang, X.; Hu, L.; Tong, S.; Zheng, Y.; Ye, F.; Lin, D.; Lin, G.; Zhang,
fluorescence detection for simultaneous analysis of TM
X.; Wu, H. Anal. Lett. 2010, 43, 2424.
and IB (mixture 1) and TM and CL (mixture 2) either in
15. Lu, W.; Zhao, S.; Gong, M.; Sun, L.; Ding, L. J. Pharm. Anal. 2018,
their combined tablets or in ] plasma samples. The HPLC
8, 160.
method proposed showed many advantages, the main of
16. El-kimary, E.I.; Khamis, E.F.; Belal, S.F.; Abdel Moneim, M.M. J.
which is the novelty of the method; as the literature lacks
Chromatogr. B Biomed. Appl. 2018, 94, 1097.
the presence of any method for analysis of these two
17. Ardakani, Y.H.; Rouini, M.R. Biopharm. Drug Dispos. 2007, 28, 527.
mixtures in plasma matrix and/or using fluorimetric de-
18. Prompila, N.; Wittayalertpanya, S.; Komolmit, P. J. Med. Assoc.
tector. It was proved that the suggested method can be
Thai 2007, 90, 160.
applied for future pharmacokinetics of these drugs due to
19. Rainsford, K. Inflammopharmacology 2009, 17, 275.
its low sensitivity which was indicated by lower DL and QL
20. Ragab, M.A.; El Yazbi, F.A.; Hassan, E.M.; Khamis, E.F.; Hamdy,
values and invivo rat application. In addition the proposed
M.M. Anal. Chem. Lett. 2018, 8, 331.
method is eco-friendly and green. The greenness of the
21. Shin, D; Lee, S.J.; Ha, Y.M.,;Choi, Y.S.; Kim, J.W.; Park, S.R,; Park,
method has been assessed by two different scales which are
M.K. Drug Des. Devel. Ther. 2017,11,135.
the new tool GAPI and the analytical Eco-Scale. These
22. Gola, S.; Gupta, A.; Keshri, G.K.; Nath, M.; Velpandian, T. J. Pharm.
advantages make this method superior for the routine
Biomed. Anal. 2016, 121, 114.
analysis of such combination in commercially available
23. Tobiszewski, M.; Mechli nska, A.; Zygmunt, B.; Namiesnik, J. Trac-
tablets and also plasma samples.
Trend Anal. Chem. 2009, 28, 943.
24. Van Aken, K.; Strekowski, L.; Patiny, L. Beilstein J. Org. Chem.
Conflicts of interest/Competing interests: Not applicable.
2006, 2, 3.
25. Gałuszka, A.; Migaszewski, Z.M.; Konieczka, P.; Namiesnik. Trac-
Funding: Not applicable.
trend Anal. Chem. 2012, 37, 61.
Open Access. This is an open-access article distributed under the terms of the Creative Commons Attribution-NonCommercial 4.0 International License (https://
creativecommons.org/licenses/by-nc/4.0/), which permits unrestricted use, distribution, and reproduction in any medium for non-commercial purposes, provided the
original author and source are credited, a link to the CC License is provided, and changes – if any – are indicated.
Unauthenticated | Downloaded 09/01/21 01:04 AM UTCYou can also read