AL An Introduction to DLS Microrheology - TITLE continued Whitepaper - American Laboratory
←
→
Page content transcription
If your browser does not render page correctly, please read the page content below
Whitepaper                                                                                                                               by author
TITLE continued

AL
          An Introduction to DLS Microrheology
Microrheology techniques involve tracking the motion of dispersed                  have a non-Newtonian shear rate-dependent viscosity). Depending on the
probe (or tracer) particles in a complex fluid, to extract local and bulk          timescale of the applied deformation, these materials can both store
rheological properties of the matrix. Analogous to mechanical rheome-              energy (an elastic response) and dissipate energy (a viscous response).
try techniques, a stress is applied to the system by motion of the probe
                                                                                   Consider the class of materials termed “complex fluids”—including
particle, and the deformation (or strain) is measured through changes in
                                                                                   synthetic and biopolymer or protein solutions, surfactant systems (with
the probe particle position.
                                                                                   their wide variety of self-assembled phases), and dispersions (colloidal
Dynamic Light Scattering (DLS) Microrheology is classified as a passive            and non-colloidal suspensions and emulsions). While these complex
technique, whereby the colloidal probe particles undergo thermal fluc-             fluids have a liquid-base, they also encompass supramolecular struc-
tuations in a system at thermodynamic equilibrium. The Mean Square                 tures formed by the constituent polymer molecules or dispersed-phase
Displacement (MSD) of the probe particles with time is followed by DLS,            particulates, and it is these microstructures that convey viscoelastic
to enable linear viscoelastic parameters for the complex fluid matrix to           properties. Not only do such fluids have a range of rich dynamics (over
be extracted.                                                                      multiple length scales and timescales) that continue to drive academic
DLS Microrheology offers significant measurement advantages for                    studies—they are also ubiquitous in many everyday products including
low-viscosity, weakly structured complex fluids since it offers a much             foodstuffs, personal care, household, and industrial chemicals, and their
wider frequency range than conventional mechanical rheometry (fun-                 rheological properties determine processing behavior and end-use
damentally limited by inertia), and can access the very high frequencies           product performance.
required to measure the critical (short timescale) dynamics of such                Conventional rheological techniques, such as a rotational rheometer,
low-viscosity materials. DLS Microrheology also requires very small                measure the bulk shear flow or deformation properties of materials by
sample volumes—microliter-scale volumes are possible—and enables                   using a mechanical system to impose a controlled force or displacement
rheological characterization of material types not available in larger             onto a sample, of typically milliliter-scale volume. The sample response
volumes, e.g., protein-based formulations.                                         to the applied deformation is recorded, enabling properties such as shear
This paper introduces Microrheology techniques for the rheological                 rate-dependent viscosity and frequency-dependent linear viscoelastic
characterization of soft complex fluids, with subsequent emphasis on               moduli to be measured (i.e., G´—the elastic [or storage] modulus and
DLS Microrheology and the underlying theory. It goes on to review the              G´´—the viscous [or loss] modulus). A modern rotational rheometer is
applicability of DLS Microrheology measurements, and some important                a highly sophisticated instrument that is capable of measuring material
practical aspects of method development to ensure robust data. Finally,            properties over multiple decades, but there are inherent limitations to me-
some example measurements are shown, including the high-frequency                  chanical techniques that inhibit certain types of material characterization.
viscoelastic characterization of a polymer solution, and the use of the            Consider low-viscosity materials—of the order of a few mPas, e.g., syn-
technique for protein solutions, both as a method for making viscosity             thetic polymer or protein solutions—where macromolecular relaxation
measurements over an industrially relevant concentration range, and                times are of the order of milliseconds, and therefore high frequencies are
for evaluating the onset of aggregation and structure development in               required to characterize their viscoelastic response. Accessing the dy-
denaturing systems.                                                                namics of such materials is impossible with a rotational rheometer, where
                                                                                   oscillation measurements become dominated by instrument inertia from
Microrheology overview                                                             around 100 rads-1, which is orders of magnitude below the frequencies
Rheological characterization of complex fluids                                     required to probe timescales relevant to molecular relaxation times.
Rheology is the study of flow and deformation of materials under applied           The relatively weak modulus and often highly strain-sensitive structures
stress. The limits of material behavior are the ideal (Newtonian) fluid,           that are developed in many complex fluids require very low stresses for
which is characterized by a viscosity and has negligible elasticity, and the       linear viscoelastic characterization—typically only a tiny fraction of the
ideal (Hookean) solid, which is characterized by an elastic modulus and
                                                                                   lowest torque range available from a rotational rheometer, which is op-
does not flow (in the limits of experimentally accessible timescales).
                                                                                   timized for testing over multiple decades of torque. Now include sample
Between these extremes are a vast array of soft material types that exhibit        volume restrictions down to microliter-scale—as can occur with high-
a combination of viscous and elastic responses, or viscoelasticity (and            value, early-stage protein-based formulations, for example—and the

                                                   AMERICAN LABORATORY         1     JANUARY/FEBRUARY 2019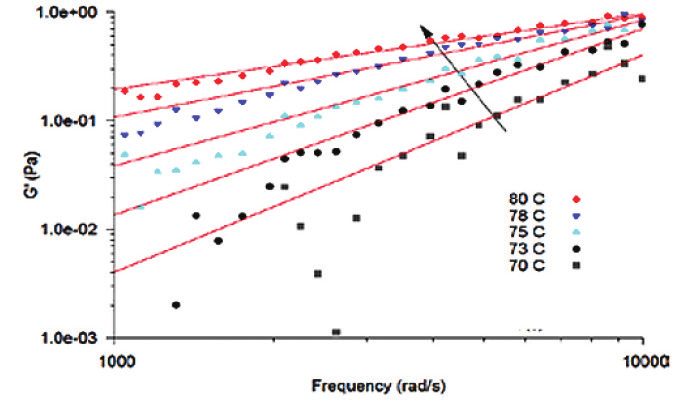
AL

demands on ultralow torque and deformation control are simply outside            • Light scattering Microrheology describes the case where the average
the capabilities of a traditional mechanical rheometer system.                     motion of an ensemble of probe particles is determined by a scattering
                                                                                   technique. Dynamic Light Scattering (DLS) is applicable for samples
Microrheology techniques                                                           with optical characteristics ranging from transparent to slightly turbid,
The term Microrheology is used to describe a range of techniques that              such that the condition of single scattering is maintained from the
extract local and bulk rheological properties of soft materials by mea-            dispersed probe particles. Measurements can be extended into opaque
suring and analyzing the motion of embedded colloidal probe (or tracer)            materials by the use of Diffusing Wave Spectroscopy (DWS), which is
particles in the sample.                                                           applicable in the opposite limit of multiple scattering.

While the “micro” in Microrheology refers to the size of the (typically)         • Particle tracking Microrheology describes the case where the motion of
submicrometer probe particle used to investigate microscale dynamics,              individual probe particles is followed using a video-microscope, and the
it also points to the microliter scale sample volumes that these tech-             probe particle tracks are subsequently analyzed using image processing
niques make accessible. In this latter respect, the term Microrheology             software. The image processing aspects can be the most challenging
can also be used in relation to microfluidic-based measurements, where             practically, although using Microrheology techniques where the imaging
complex fluids are subjected to controlled flow and deformation re-                and tracking of a single probe particle only is required can be much more
gimes in sub-millimeter scale channels to extract rheological properties.          efficient, and offer the benefit of very good spatial resolution.
While microfluidic techniques are another area of microscale rheological
characterization with significant research activity, this paper addresses        Literature reviews
embedded probe particle-type Microrheology techniques only.                      The above brief overview of Microrheology fits with the scope of this
                                                                                 paper, but in an active and developing field of research, several review
Passive and active probe-based Microrheology                                     papers have been published in the scientific literature that provide
From the description of embedded probe-based Microrheology tech-                 extensive background and references to all Microrheology methods and
niques, two types of measurements can be defined:                                the applications that have been targeted.1-4

• Passive Microrheology—linear rheological properties are extracted              Theory of DLS Microrheology
  from the motion of colloidal probe particles undergoing thermal                Dynamic Light Scattering (DLS), sometimes referred to as Photon Cor-
  fluctuations in a system at thermodynamic equilibrium, i.e., no external       relation Spectroscopy (PCS) or Quasi-Elastic Light Scattering (QELS), is a
  forces are exerted on the probe particles. (Passive Microrheology can          commonly used technique for measuring the size of particles suspended
  also be described as thermal diffusion Microrheology.) Relationships           in a liquid, typically in the sub-micrometer regime.5 DLS actually measures
  have been derived that enable quantitative rheological data over a             the Brownian motion of the particles in the liquid, and the technique is the
  wide range of frequencies, and which have been shown to hold, in               founding basis of embedded probe particle Microrheology techniques.
  general, across a variety of complex fluid types.

• Active Microrheology—rheological properties are extracted from the             The Generalized Stokes-Einstein Relation
  forced motion of colloidal probe particles in the system, which can            For a particle moving freely due to thermal fluctuations in an ideal vis-
  extend measurements from the linear into the non-linear regime.                cous (Newtonian) fluid, the Mean Square Displacement (MSD) increases
                                                                                 linearly with time, with the slope of this increase given by the diffusion
Note that moving into the non-linear regime poses challenges for theory
                                                                                 coefficient of the particle6:
and interpretation, as the non-equilibrium state of the sample micro-
structure has to be understood to relate probe motion to the underlying                                       				(1)
rheological properties. External drive forces on the probe particles have        where          is the MSD, d is the dimensionality of the motion (2 for
included the use of laser tweezers to exert optical forces, or magnetic          motion in a plane, 3 for motion in space), and D is the diffusion coeffi-
tweezers. Active Microrheology techniques can also extend into the use           cient of the particle.
of multiple particles (two-particle correlation).
                                                                                 In a purely viscous (Newtonian) system, the diffusion coefficient can be
Generally, passive techniques are advantageous for measuring weakly              written as a function of the size of the particle, the viscosity of the fluid
structured materials which have low values of predominantly viscous              medium, and the temperature using the Stokes-Einstein Relation:
modulus, whereas active techniques better facilitate measurements on                                     				 (2)
materials which have significant elastic properties.

Measuring probe particle behavior                                                where a is the diameter of the particle, η is the viscosity of the fluid
An additional classification for Microrheology measurements can be               medium, T is the temperature, and kB is the Boltzmann constant. The
made based on the method used to measure the behavior of the embed-              Stokes-Einstein Relation therefore links the MSD of the particle to the
ded probe particles in the sample under investigation:                           fluid’s viscosity.

                                                  AMERICAN LABORATORY        2     JANUARY/FEBRUARY 2019
DLS MICRORHEOLOGY continued

However, for viscoelastic (non-Newtonian) complex fluids, where the                                                       			(7)
medium exhibits both dissipation of energy (viscosity) and storage of
energy (elasticity), Eq. (2) does not describe the full behavior of the system.
                                                                                      where n is the refractive index of the medium, λ is the wavelength of the
As the elasticity of the suspending medium becomes significant, particle              light, and θ is the scattering angle. The correlation time τ is related to the
motion becomes sub-diffusive and deviations from linearity in the slope of            time t by τ = 2πt, so that ω =1/τ.
the MSD are evident. The validation of a more general approach to extend              A DLS Microrheology experiment therefore requires the addition of
the strategy of linking MSD to measure the linear viscoelastic moduli of              probe (tracer) particles of a known size into the medium of interest, in
complex fluids using DLS formed the basis of modern Microrheology.7                   order to measure the ACF of the light scattered by the probe particles.
                                                                                      Then, from Eq. (6), the following relation between the MSD of the probe
A generalized Langevin equation is used to describe the thermally driven              particles and the ACF of the scattered light is obtained:
motion of a particle dispersed in a complex fluid8,9:
                                                                                                                                                      (8)
                                              		                 (3)                  where g1(0) is the estimated intercept of the value of the autocorrelation
where m is the mass of the particle, ύ is the particle acceleration, f is the         function, and q is the scattering vector as defined above. In general, a
                                                                                      large value of the intercept (above 0.8) indicates the absence of multiple
total force acting on the particle, and ζ is a time-dependent memory
                                                                                      scattering (scattering from the probe particles is expected to be high in
function that accounts for the elasticity in the system. Solving the equa-            comparison to background scattering from the suspending medium).
tion of motion for the case where the only forces on the particle are due
                                                                                      The viscoelastic modulus can be obtained by calculating the Fourier
to thermal fluctuations in the system yields the Generalized Stokes-Ein-              transform of the MSD and substituting it in Eq. (5). However, since the
stein Relation 7,8 that relates the Mean Square Displacement (MSD) of                 correlation data is usually logarithmically spaced in time, and doesn’t
the tracer to the viscoelastic modulus of the complex fluid medium                    lend itself to the usual methods of obtaining the Fourier transform, a
                                                                                      method based on a power law expansion of the MSD can be used in-
surrounding the particle:
                                                                                      stead.8 This method estimates the complex shear modulus algebraically
                                 			(4)                                               by expanding         locally around t = 1/ω to give:
                                                                                                                                          		          (9)

where the tilde symbol represents the Laplace transformation, and s is
the Laplace frequency; the rest of the variables are as in Eq. (2). G* is the         where          is the magnitude of          at t = 1/ω and:
viscoelastic modulus of the system as experienced by the probe particle.                                               			(10)
Eq. (4) can be recast in Fourier space by using the identity s = iω to obtain:

                                       			(5)                                         is the power law exponent describing the logarithmic slope of              at
                                                                                      t = 1/ω.
                                                                                      For thermally driven motion of the probe particles, the slope of the
where the angular frequency ω is given by ω = 2π/t.
                                                                                      logarithmic time derivative of the MSD will be one in a purely viscous
The Generalized Stokes-Einstein Relation is based on the assumption                   medium (diffusive motion), zero in an elastic medium (completed
that the complex fluid medium is a continuum around the particle, i.e.,               arrested motion), and will lie between these extremes in a complex
the length scales of the microstructures in the complex fluid are small in            viscoelastic fluid medium.

comparison to the size of the particle.                                               Evaluating the Fourier transform of the power law behavior of the MSD,
                                                                                      substituting into Eq. (5) and using Euler’s equation results in expressions
Extracting rheological data from DLS measurements                                     for the frequency-dependent viscoelastic moduli G´, elastic (storage)
                                                                                      modulus, and G´´, viscous (loss) modulus8:
In a Dynamic Light Scattering experiment, the autocorrelation function
(ACF) of the light scattered by particles undergoing thermally driven mo-                                                     			(11)
tion within a material under study is measured. It can be shown that the
ACF, g1(τ), can be written as a function of the Mean Square Displacement              where
(MSD) of the scattering particles thus9:
                                                                                                                                      		              (12)
                                                                 (6)

where g1(0) is the value of the autocorrelation function at zero time (or             and where Γ denotes the gamma function which is a result of the Fourier
intercept), and q, the scattering vector, is given by:                                transform of the power law behavior of the MSD.

                                                     AMERICAN LABORATORY          3     JANUARY/FEBRUARY 2019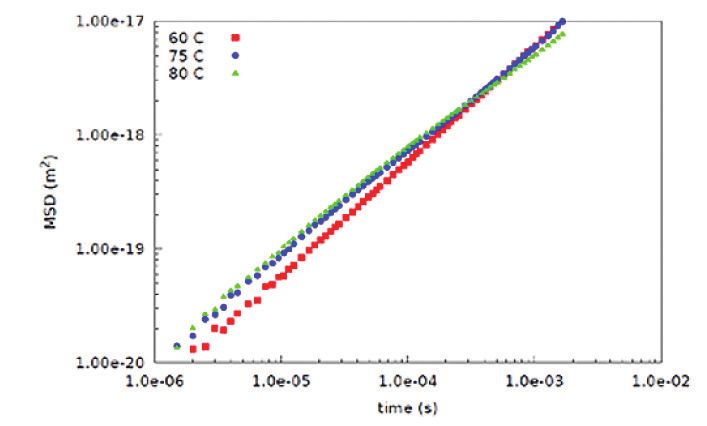
AL

Complex viscosity, η*, can then be calculated by using the following                 It is important to note that the ability to probe local material heteroge-
relation:                                                                            neity on a wide variety of microstructural length scales with targeted
                                                                                     Microrheology techniques enables new information (not available from
                                           		                   (13)
                                                                                     bulk measurements) to be obtained, for further novel insight into mate-
                                                                                     rial microstructures and characterization.

Applicability of DLS Microrheology                                                   Materials with evolving or aging microstructure
Consideration of the conditions where either DLS measurements, or the                A material can be considered as quasi-steady state if the timescale of
assumptions within the Generalized Stokes-Einstein Relation become                   the material structural evolution is slow compared to (experimental)
unreliable, is necessary to ensure robust and consistent DLS Microrheol-             data sampling times—in which case DLS Microrheology can be used to
ogy data.                                                                            monitor material structure evolution.

From a DLS measurement perspective, it is important to ensure that the               Aggregating or gelling systems close to the gel point
dispersed probe particles are the dominant scatterers in the system,                 DLS Microrheology is a valuable technique for tracking the onset of ag-
and that the condition of single scattering is maintained. As mentioned              gregation or gelation, due to its sensitivity to probe very soft structures,
above, there are certain quality criteria that can be applied, for example,          and discern very low values of viscoelastic modulus.11 Beyond the gel
to the autocorrelation function, to highlight appropriate data quality               point, the system becomes nonergodic, and the contribution of the
requirements. The use of defined method development procedures is                    aggregated structures to the overall scattering increases significantly to
also central to performing valid DLS Microrheology measurements, to                  the point of making single scattering DLS measurements unreliable.
evaluate satisfactory dispersion of probe particles, for example.
The Generalized Stokes-Einstein Relation is the underpinning basis of                Benefits of DLS Microrheology measurements
Microrheology techniques, and its general applicability has been shown               For the rheological characterization of weakly structured complex fluids,
                                                                                     which have optical characteristics ranging from transparent to slightly
to hold across a wide range of complex fluid types, enabling quantitative
                                                                                     turbid—the technique of DLS Microrheology, allied to advances in
rheological data to be measured across a wide range of frequencies.
                                                                                     instrument design, provides the following benefits:
However, particular cases have been identified where assumptions in
the Generalized Stokes-Einstein Relation can break down, and where                   • Measurements require very small sample volumes—typically
agreement between Microrheology data and bulk rheological measure-                     microliter-scale volumes—and therefore enable rheological
ments cannot generally be expected.4                                                   characterization of material types not available in larger volumes, e.g.,
                                                                                       protein-based formulations.
For DLS Microrheology measurements, the following are some nota-
ble cases where assumptions within the Generalized Stokes-Einstein                   • Laser-based DLS Microrheology probes a much wider frequency range
Relation may be infringed, and where agreement with bulk (macro)                       than conventional mechanical rheometry (fundamentally limited
rheological measurements may not occur:                                                by inertia), which enables rheological studies into dilute, weakly
                                                                                       structured macromolecular solutions where critical material dynamics
Influence of probe particle-matrix interactions                                        occur on very short timescales (or at very high frequencies).
A key requirement of a Microrheology experiment is to minimize particle              • A DLS Microrheology measurement effectively probes a complete
matrix interactions, since the existence of significant physical (e.g., deple-         range of measurement frequencies simultaneously by measuring
tion or electrostatic) or chemical interactions of the embedded probe with             ensemble statistics arising from thermal (Brownian) motion of probe
the surrounding material can alter the local material environment and                  particles, which allows a much faster frequency-dependent rheological
affect diffusivity in a measureable way. Ensuring an appropriate choice of             characterization method, e.g., for rapid formulation screening.
particle surface chemistry is an essential element of method development
                                                                                     • By utilizing the Brownian motion of tracer particles, a DLS Micro-
for DLS Microrheology measurements for a particular complex fluid.
                                                                                       rheology measurement probes the linear dynamics of materials under
Influence of probe particle size and material heterogeneity                            conditions of very low applied stress (the probe energy is of the order
The probe size used in DLS Microrheology measurements can have a                       of kBT, where kB is the Boltzmann constant and T is the temperature),
                                                                                       which enables measurements in the linear regime of highly strain-
significant impact on the extracted rheological parameters.10 The probe
                                                                                       sensitive systems.
size should be larger than the relevant microstructural length scale, e.g.,
mesh size in a polymer network, such that it probes the bulk response,               • The use of a DLS technique with improved single scattering detection12
i.e., the assumption of continuum viscoelasticity holds. (Note also that               allows the use of a lower concentration of probe particles, which can
the particle size must not be so large that sedimentation becomes                      be an important factor for some biological systems to minimize probe-
significant on the timescale of the experiment.) Ensuring an appropriate               sample interactions.
choice of probe particle size to enable bulk material properties to be               • The use of improved single scattering detection11,12 for DLS Micro-
extracted is another central element of method development for DLS                     rheology also allows measurements of more concentrated and slightly
Microrheology measurements for a particular complex fluid.                             turbid solutions, which can be advantageous for characterizing high

                                                    AMERICAN LABORATORY          4     JANUARY/FEBRUARY 2019
DLS MICRORHEOLOGY continued
concentration protein solutions, for example. DLS Microrheology • Check that the Microrheology data obtained are independent
enables a quick measurement technique for viscosity in protein of probe particle concentration and probe particle size—repeat
solutions over an industrially relevant concentration range, and can measurements at different probe concentrations and with different
also detect the onset of aggregation by following the evolution of probe size (if possible).
elasticity in dilute protein solutions.11
Perform Microrheology measurement at two concentrations of probe
particles higher than the concentration determined above, to check the
Practical aspects of DLS Microrheology measurements MSD obtained is independent of concentration.
The use of a defined experimental procedure is recommended in order
to ensure a reliable method is generated for DLS Microrheology charac- Perform Microrheology measurement with a larger probe size, of the
terization of a particular complex fluid type, which avoids the possible same surface chemistry, to check the MSD obtained is independent of
probe particle size.
measurement pitfalls that have been highlighted as part of the above
review.11 The above DLS Microrheology methodology is relatively straightfor-
ward to implement, and, of course, once a particular sample type has
Method development been assessed as above for a suitable probe particle type, size, and
The following sequential steps are advised for characterization of a new concentration, then only an ACF measurement needs to be run to extract
sample type: Microrheology data. It is at this point that the possibility of rheological
testing of samples quickly and easily, with minimal volumes (below 20 μL
• Assess suitability of probe particle chemistry to minimize particle-
is possible) really opens up.
matrix interactions—measure and compare zeta potential of probe
particles in the base solvent only, and then in the sample.
Example DLS Microrheology measurements
The zeta potential of a colloidal particle is the electrostatic potential Water
between the dispersant matrix and the layer of fluid attached to the
Measurements on an ideal (Newtonian) liquid
dispersed particle.13 Zeta potential can be calculated by measuring the
• Using DLS to obtain the viscosity of a Newtonian liquid, with dispersed
electrophoretic mobility of the colloidal particles.
probe (tracer) particles of known size, is straightforward by simply
The zeta potential of a colloidal particle will change if the surface proper- applying the Stokes-Einstein Relation (Eq. [2]) to obtain the viscosity
ties of the particle change, e.g., if components of the dispersant matrix, from the diffusion coefficient.
such polymer molecules adsorb onto the particle surface. • The measurements on water detailed below utilize the full DLS
For a DLS Microrheology measurement—if the zeta potential of the Microrheology approach to show that there is no frequency
probes in the presence of the sample is significantly different from the dependence of the viscosity.
value obtained without the sample, this may be indicative of particle-ma- • Two probe (tracer) particle sizes —60 nm and 200 nm latex—are
trix interactions, and different probe chemistry should be investigated. dispersed in water, and the ACF of the light scattered by both tracer
• Assess suitable concentration of probe particles for measurement sizes is measured, to enable determination of the MSD.
in single scattering regime and that probe particles are dispersed
properly—add amount of probe particles to sample (e.g., 5 μL of
known probe particle dispersion into 500 μL of sample, for example),
and measure autocorrelation function and intensity Particle Size
Distribution (PSD) of resulting sample.
The intercept of the autocorrelation function with a value >0.8 is in-
dicative of a single scattering regime. The intensity PSD should show
a narrow peak in a position corresponding to the size of the probe
particles, which indicates the probe particles are dispersed properly,
and not aggregated. The scattering signal should be dominated by the
probe particle scattering, as compared to any scattering from a matrix
network, which can be seen by comparing intensity peaks in the PSD. An
appropriate amount of probe particles should be added to the sample to
meet the above conditions.
• Measure autocorrelation function (ACF) and Mean Square Dis-
placement (MSD) of probe particles to extract Microrheology data for Figure 1 – Mean Square Displacement with time for two different
sample under test. probe sizes in water.
AMERICAN LABORATORY 5 JANUARY/FEBRUARY 2019AL
• Linear response on log-log scale indicating purely diffusive motion for • Measurement data shown here was obtained with 700-nm latex tracer
an ideal Newtonian liquid. particles in a 2% by weight solution of PEO in water.
• From the MSD, the procedure described above (using the approach in • The PEO solutions in water were rolled gently until fully dispersed.
Ref. 8) is applied to calculate to viscoelastic moduli. • The tracers were added to the fully dispersed PEO solution and again
rolled until fully dispersed.
Figure 2 – Viscous (loss) modulus, G’ ’, of water measured using 60-nm Figure 4 – Mean Square Displacement with time for 700-nm tracer
and 20-nm tracer particles. probes in 2% PEO solution.
• Both tracer particles produce essentially the same results—the 60-nm
• The MSD of the tracer particles in PEO is not linear with time, due to the
latex extends the data to higher frequencies, whereas the 200-nm viscoelasticity of the sample.
latex gives access to lower frequencies.
• At short timescales, the MSD behavior is sub-diffusive, indicative of
an elastic modulus. At the shortest timescales, the probe particles
experience “hindered” motion, and at longer timescales (where the
MSD curve trends to a plateau) the probe particles are effectively
“trapped” by the elasticity of the system. On the longest timescales,
the probe particles are able to “escape” as the material relaxes, i.e., the
escape time is the timescale beyond which their motion becomes
diffusive in nature, ~ t.
Figure 3 – Complex viscosity, η*, for water for the two probe sizes at 25 °C.
• Frequency-independent behavior as expected from an ideal
(Newtonian) liquid.
• Viscosity data is accessible for frequencies in excess of 105 rads-1. Figure 5 – Viscoelastic moduli (elastic (storage) modulus, G’, and vis-
cous (loss) modulus, G’ ‘) as a function of frequency for a 2wt% PEO
Polyethylene oxide (PEO) solution solution in water.
Viscoelastic polymer solution—PEO can be used as a model system for
comparison of DLS Microrheology data and mechanical (rotational) • Data is shown from mechanical (rotational) rheology and DLS
rheology data. Microrheology measurements (using 700-nm latex probe particles).
AMERICAN LABORATORY 6 JANUARY/FEBRUARY 2019DLS MICRORHEOLOGY continued
• Good agreement is shown for data in the region of overlap for the • Zero Shear Viscosity can be obtained by extrapolating the complex
two techniques. viscosity data to zero frequency.
• DLS Microrheology extends the viscoelastic data into the high-frequency • The Relative Viscosity can then be obtained from a ratio of the Zero
regime (not accessible by mechanical rheology due to inertia limitations), Shear Viscosity (for each BSA concentration) to the viscosity of the PBS
and therefore permits a more complete characterization of rheological (phosphate buffered saline).
properties and dynamics of polymer solutions—from dilute through • The DSV uses a capillary flow measurement technique, and the
semi-dilute and into concentrated regimes. data shows excellent agreement with the DLS Microrheology
measurements.
Figure 6 – Complex viscosity, η*, for a 2wt% PEO solution in water mea-
sured with 700-nm latex tracer particles.
• Frequency-dependent viscosity showing non-Newtonian, shear-
thinning behavior.
Figure 8 – Plot of relative viscosity against concentration for BSA in
Protein solutions: Bovine Serum Albumin (BSA) PBS solutions—data from DLS Microrheology (ref. Figure 4) and Dilute
Solution Viscometer (DSV), at 25 °C.
The use of DLS Microrheology to extend the measurement range for
polymer solutions is, of course, directly applicable to characterizing
protein solutions, which also exhibit weak viscoelastic behavior on short • Once the choice of probe chemistry and probe size has been
timescale (high-frequency) deformations. For protein solutions, in par- optimized, DLS Microrheology can be effectively utilized to make quick
ticular, the benefits of small sample volume and the passive (low stress) measurements on an industrially relevant protein concentration range,
nature of the measurement technique can be particularly advantageous. with much smaller sample volumes than other available techniques.
(a) Viscosity measurements of BSA solutions of varying concentration: (b) Viscoelastic measurements to assess onset of aggregation in BSA solu-
tions following thermal denaturation:
Figure 7 – Plot of complex viscosity against frequency for varying con-
centration BSA in PBS solutions (from 10 mg/mL up to 666 mg/mL),
from DLS Microrheology measurements (using 615-nm carboxylated Figure 9 – Variation of reduced Mean Square Displacement (MSD) with
melamine probe particles). time for 10 mg/mL BSA solution at 60 °C, 75 °C, and 80 °C (using 615-nm
carboxylated melamine probe particles).
• At concentrations above 80 mg/mL, the viscosity is no longer constant
with frequency, and the BSA solutions exhibit (non-Newtonian) shear • At 60 °C, the MSD has a slope of 1—the probe particles are showing
thinning behavior. purely diffusive behavior, i.e., in a viscous medium.
AMERICAN LABORATORY 7 JANUARY/FEBRUARY 2019AL
• At higher temperatures, BSA starts to denature, and a process of • The values and trend of power law exponent, P, for both G' and G' '
aggregation ensues,11 which leads to structure development within (viscous modulus—data not shown in Figure 6), offers further insight
the fluid. into structure development in the denaturing protein solution. The G'
exponent shows a relatively fast monotonic decrease from 2 (at 70 °C)
• Both of the MSDs at 75 °C and 80 °C show curvature away from a slope
to around 0.68 (at 80 °C), whereas the G' ' exponent decreases from
of 1—this short time sub-diffusive behavior is an indication of the
1 to 0.8 over the same range. The overall decrease of the exponents,
presence of elasticity in the system.
and the faster decrease of the G' exponent, is indicative of a sol-gel
• As aggregation progresses, the viscoelastic moduli accessible from DLS transition, with the gel point occurring when the exponent reaches a
Microrheology can provide insight into the possible interconnection of value of 0.5.14
aggregates and subsequent system gelation. • The observation of exponent behavior and the rapid decrease of the G'
• The evolution of the elastic (storage) modulus, G’, in particular exponent are strong indications that network connectivity is evolving
is strongly indicative of the development of an interconnected for this protein solution in this temperature range.
microstructure.
References
1. Waigh, T.A. Rep. Prog. Phys. 2005, 68, 685–742.
2. Gardel, M.L.; Valentine, M.T. et al. Microscale Diagnostic Techniques;
Breuer, K., Ed. Springer-Verlag, Berlin, 2005.
3. Cicuta, P. and Donald, A.M. Soft Matter 2007, 3, 1449–55.
4. Squires, T.M. and Mason, T.G. Ann. Rev. Fluid Mech. 2010, 42, 413–38.
5. Malvern Instruments, Dynamic Light Scattering: An Introduction in 30
Minutes. MRK656-01.
6. Chaikin, P.M. and Lubensky, T.C. Principles of condensed matter physics;
Cambridge University Press, 2000, p. 371.
7. Mason, T.G. and Weitz, D.A. Phys. Rev. Lett. 1995, 74, 1250–3.
8. Mason, T.G. Rheol. Acta 2000, 39, 371–8.
9. Dasgupta, B.R.; Tee, S.-Y. et al. Phys. Rev. E 2002, 65, 051505.
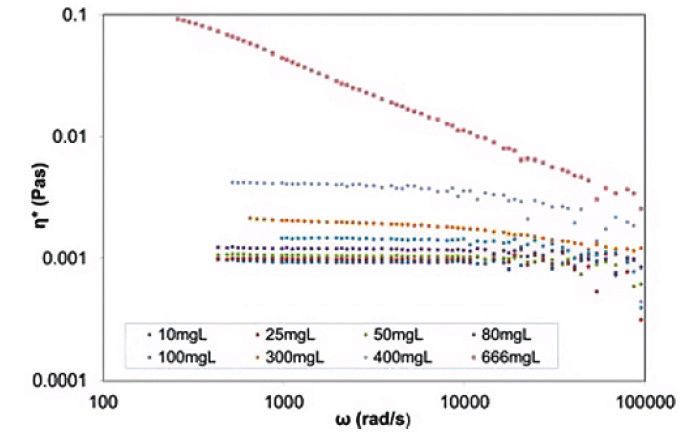
Figure 10 – Evolution of elastic (storage) modulus, G', with temperature 10. Lu, Q. and Solomon, M.J. Phys. Rev. E 2002, 66, 061504.
for 10 mg/mL BSA solution over a range of temperatures (the arrow 11. Amin, S.; Rega, C.A. et al. Rheol. Acta 2012, 51, 329–42.
points toward increasing temperature). Lines on the graph are power 12. Peters, R. Fiber optic device for detecting the scattered light or fluores-
law fits to each data set (G' ωP). cent light from a suspension, 2000. U.S. Patent No. 6,016,195.
13. Malvern Instruments, Zeta Potential: An Introduction in 30 Minutes.
• A weak elastic response from this system can be detected at 70 °C—
MRK654-01.
although the data are noisy due to presence of very weak G' at this
14. Winter, H.H. and Chambon, F. J. Rheol. 1987, 31, 683–97.
temperature.
• Data quality for G' improves with temperature as protein denaturation Micromeritics Instrument Corporation is a global provider of solutions
and subsequent aggregation progresses, and a microstructure with a for material characterization with market-leading instrumentation and
stronger elastic structure evolves. application expertise in five core areas: density; surface area and po-
• G' increases by more than an order of magnitude going from 70 °C to rosity; particle size and shape; powder characterization; and catalyst
80 °C. characterization and process development. Contract testing is offered via
the Particle Testing Authority.
AMERICAN LABORATORY 8 JANUARY/FEBRUARY 2019You can also read