Conversational Tagging in Twitter - Jeff Huang, Katherine M. Thornton, Efthimis N. Efthimiadis
←
→
Page content transcription
If your browser does not render page correctly, please read the page content below
Conversational Tagging in Twitter
                              Jeff Huang, Katherine M. Thornton, Efthimis N. Efthimiadis
                                                             University of Washington
                                                               Information School
                                                                Seattle WA 98195
                                   ht@jeffhuang.com, thornt@uw.edu, efthimis@uw.edu

ABSTRACT                                                                     The concept of a priori tagging may seem counterintuitive, but
Users on Twitter, a microblogging service, started the phenome-              tagging in Twitter is harnessed to achieve goals different from
non of adding tags to their messages sometime around February                those of other social tagging platforms. A user who observes the
2008. These tags are distinct from those in other Web 2.0 systems            rise of a compelling trending topic micro-meme may be inclined
because users are less likely to index messages for later retrieval.         to take the tag associated with the meme and compose his or her
We compare tagging patterns in Twitter with those in Delicious to            own tweet on the subject. Thus, it is overwhelmingly likely that
show that tagging behavior in Twitter is different because of its            they might never have written the tweet if they had not been
conversational, rather than organizational nature. We use a mixed            inspired to participate in the micro-meme phenomenon. This is
method of statistical analysis and an interpretive approach to               supported by observations from our study, where the tags
study the phenomenon. We find that tagging in Twitter is more                associated with micro-memes generally had not been used before
about filtering and directing content so that it appears in certain          they were embraced as micro-memes.
streams. The most illustrative example of how tagging in Twitter             The differences between tagging practices in Twitter and tagging
differs is the phenomenon of the Twitter micro-meme: emergent                practices in traditional tagging platforms, such as Delicious, are
topics for which a tag is created, used widely for a few days, then          partly due to structural differences between the two platforms.
disappears. We describe the micro-meme phenomenon and discuss                Tags in Delicious can be used to browse and discover new
the importance of this new tagging practice for the larger real-time         information about a topic, while tags in Twitter are primarily used
search context.                                                              to find messages from other users about a topic. The relationship
                                                                             between tag usage surrounding trending topics in Twitter differs
Categories and Subject Descriptors                                           from the tag usage surrounding trending topics in Delicious.
H.5.4 [Information Interfaces and Presentation]: Hyper-                      Through the analysis of corpuses of tagging data from Twitter and
text/Hypermedia – User issues, architecture                                  Delicious, we will demonstrate that the lifecycles of tags related
                                                                             to trending topics have distinct trajectories in each of the two
General Terms                                                                systems.
Measurement, Human Factors
                                                                             In this paper we explore a subset of hashtags used in Twitter from
Keywords                                                                     December 2008 to October 2009, which is the period when
Twitter, tagging, trends, memes.                                             hashtags became widely adopted on the site. This data was
                                                                             collected by a third party by sampling tweets continuously over
                                                                             several years. We use a mixed method of statistical analysis as
1. INTRODUCTION                                                              well as an interpretive approach to study the data. From looking at
Tag selection in social tagging sites is often a posteriori, the key         newly coined tags, we will discuss how statistical metrics
concepts are distilled into short strings that are then attached to a        differentiate micro-memes from other newly coined tags in
document, image, or resource to facilitate retrieval. In contrast,           Twitter. These results are then compared with those from
tagging has emerged as a method for filtering and promoting                  Delicious data, where we do not observe similar phenomenon.
content in Twitter, rather than as a tool for recall. Users on Twitter
have developed a tagging culture of placing a hash symbol (#) in             Our research question is: how are tags used in Twitter compared
front of short strings, called hashtags, on their posted messages,           to Delicious; specifically, what can we tell about the adoption of
called tweets. Since then, a phenomenon of tagging which we call             these tags from analyzing their trends? Our contributions in this
micro-meme has arisen. Participation in micro-memes is a priori;             paper include being the first large-scale analysis of Twitter
an individual user is unlikely to have composed a tweet on the               hashtags and introduction of the notions of conversational tagging
topic in question if they had not observed the micro-meme tag in             and micro-memes.
use by other Twitter users.
                                                                             1.1 Terminology
                                                                             To accurately describe the tagging practices in Twitter, we use the
                                                                             following terminology consistently throughout the paper.
 Permission to make digital or hard copies of all or part of this work for
 personal or classroom use is granted without fee provided that copies are   A hashtag is the specific name for a tag in Twitter. Hashtags
 not made or distributed for profit or commercial advantage and that         derive their name from the fact that they are preceded by the
 copies bear this notice and the full citation on the first page. To copy    symbol ‘#’, also known as a hash mark, e.g., #nowplaying.
 otherwise, or republish, to post on servers or to redistribute to lists,
 requires prior specific permission and/or a fee.                            Adoption is the process by which a newly coined hashtag is
 HT’10, June 13–16, 2010, Toronto, Ontario, Canada.                          embraced by a critical mass of users and disseminated through
 Copyright 2010 ACM 978-1-4503-0041-4/10/06...$10.00.                        Twitter. For the purposes of this paper, we define adoption as tags
representing less than 0.001% of the tags appearing per-day for 3. METHOD
the first 10 days data is collected, but later becomes widely-used.
3.1 Data
Abandonment is when a critical mass of users stop attaching a Our data comes from 2 different sources, both of which are online
specific hashtag to their tweets. Essentially, this is a decline in use services which allow users to tag content (Table 1). We have a
over time until appearances of the tag become infrequent. sample of 42 million hashtags used in the microblogging website
A micro-meme is a small-scale meme emerging around a Twitter Twitter, inserted in messages posted by users. We have a sample
hashtag. As more users adopt the hashtag, they add to an of 378 million tags from the online bookmarking service
asynchronous, massively multi-person conversation by tweeting Delicious, created by users to organize their bookmarks. Both of
their thoughts about the topic prompted by the hashtag. these datasets contain the tag along with the timestamp of when
that tag was attached.
2. RELATED WORK
A number of previous studies have focused on time-series trends Dataset Start Date End Date # Tags
in search queries on the web. These studies of query patterns are Twitter 1
Dec 2008 Oct 2009 42M
highly relevant because of our argument that tagging practices in
Twitter are shaped by the real-time communication dimension of Delicious [12] Jan 2006 Dec 2007 378M
the system. Adar et al. [1] studied the general trends for queries in Table 1: Summary of datasets used in the analysis.
several datasets of queries, blog posts, and news articles. Like our
study, they looked at frequency of terms over time; they found While it would have been ideal for the datasets to cover the same
that distinct trends could be explained by different user behaviors time periods to control for temporal variations, obtaining large
relating to the topic of the terms. Vlachos et al. [11] focused on amounts of user data from different sources is a challenging task;
burst and periodic queries, representing them concisely using we were constrained by the availability of data.
coefficients in a Fourier transform. Identifying trends in queries
has real applications; for example, Ginsberg et al. [6] were able to
3.2 Processing
To explore this data, we constructed time-series charts of the tags,
predict flu epidemics using search engine data before institutions
where the elements of the time-series are the number of times a
such as the US Centers for Disease Control and Prevention.
tag is issued per day. We used only tags which appeared at least
Extending this further with the same search data, Shimshoni et al.
10,000 times in the data to obtain sufficient data points to explore.
[10] were able to predict trends for categories of seasonal queries.
Next, we removed tags which appeared more than 0.001% of the
Chien and Immorlica [3] presented an efficient method for finding
time on average for the first 10 days. This eliminated recurring
related queries by correlating queries with similar time-series
tags so we could focus on newly coined tags. We normalized the
distributions. Carman et al. [2] analyzed queries, tags, and web
frequency of each tag per day by dividing by the total number of
content and found that queries and web content had a stronger
tags sampled that day. This eliminated the weekly variation in
overlap than tags and queries or tags and content. This illustrates
online activity (since there is significantly more web traffic on
that tags are not necessarily used exclusively for retrieval.
Wednesday than Sunday) as well as different sample sizes used
Other studies have explored tagging activity for websites where throughout the datasets. From looking at the data, we removed
the goal is information organization. Santos-Neto et al. [9] studied obvious cases of spam, in which a single website tagged their link
tagging vocabulary used for scientific publications, for the on Delicious repeatedly over several months, and cases of data
purpose of classification and retrieval. They concluded that noise, for which it was obvious that the tag was invalid. Finally,
tagging is used for organizational purposes more than for we calculated the standard deviation, skew, and kurtosis.
collaboration with others. Wu and Zhou [13] uncovered a social
aspect to tags in Delicious through various visualizations, 4. INTERPRETIVE ANALYSIS
showing that tags and users connected in a network have high We begin our study with an interpretive analysis of the tags used
levels of semantic and social relatedness. Marlow et al. [8] in Twitter and Delicious. The authors went through the 224 most
proposed a framework for the analysis of social tagging systems. common tags in the Twitter dataset and the 304 most common
We have found that Twitter can be classified as a social tagging tags in the Delicious dataset. The reason we first chose a
system under their definition, but that the patterns of tagging qualitative approach was to make observations that would take
behavior within Twitter are distinct. We also provide in-depth into account the meaning of the tag itself. This allowed us to
analysis of the tag entry mechanism Marlow et al. call “blind inform our interpretation with our knowledge of historical events
tagging”, the category for which they have the least data. Ding et and gave us a better understanding of the tag by seeing it used in
al. [5] looked at tagging practices in Delicious, YouTube, and the context of the message. One author had participated in Twitter
Flickr. We expand upon their taxonomy of the tagging features of for several years, allowing us to combine observed data with
popular social networking sites to include Twitter. Twitter historical familiarity of the Twitter ecosystem to better understand
provides a useful set of distinctions because the ways tags can be phenomenon.
used are differently constrained. Dellschaft and Staab [4] looked
at tag stream data and ranked tags by frequency of use to
4.1 Following the Trend
understand how individual users made tag selections. It is Once users began to understand that tweets, in the aggregate,
uncommon for a tweet to be assigned more than one tag, so we do provided rich real-time information about specific issues, they
not compare tag co-occurrence; instead, we look at tag selection began to build tools to help filter and highlight trending topics.
from a social context since Twitter users are influenced by the tags
used by people in their network or from lists of trending topics,
1
when they choose tags according to the ‘Imitation’ model Collected by Infochimps. http://infochimps.org/datasets/twitter-
proposed by Dellschaft and Staab. census-::-conversation-metrics-one-year-of-urls-hashtagsMany third-party Twitter clients, such as Brizzly2 and Tweetdeck,3 Tagging practices in Twitter are an example of a new type of
have automatically refreshing sidebars to display the topics tagging, which we have chosen to call ‘conversational’ tagging. In
currently the most popular. Later, Twitter itself began to display conversational tagging, the tag itself is an important piece of the
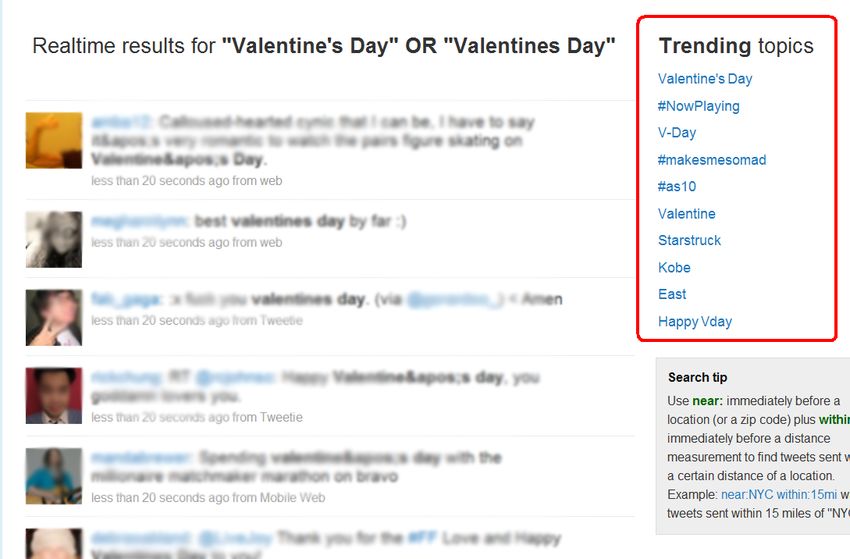
trending topic information on their front page (see Figure 1). message. The tag can either serve as a label in the traditional sense
These trending topic lists are individually linked to the current set of a tag, or it can serve as a prompt for user comment. In many
of tweets composed on that topic. While tweets without hashtags trending topics, Twitter tags sometimes serve as prompts, and the
were also displayed in trending topic lists, the act of tagging a resulting content is an asynchronous massively-multi-person
tweet increased the likelihood of a tweet being displayed in a conversation. While these are not the only types of tags used in
group of tweets on a trending topic. Twitter, we argue that this is a type of tagging behavior that
emerged due to the structure of the Twitter system.
4.3 Participating in Micro-memes
#igrewupon, #liesmentell, #igottacrushon and #90stweet are
examples of hashtags we observed in Twitter associated with
emergent micro-memes. These hashtags are rarely used to retrieve
old tweets; instead, they provide synchronic metadata used to
funnel related tweets into common streams. Figure 2 shows a
time-series chart for the hashtag #itsabouttime. At its peak
popularity, 3% of the tweets that day contained this micro-meme.
#itsabouttime
Figure 1: A screenshot of a Twitter search page, showing the
Trending topics on the right sidebar, circled in red. Actual
tweets are blurred for privacy.
4.2 Conversational vs. Organizational Tagging
Twitter is often characterized as an ephemeral stream of status
updates. In one-hundred-forty characters or less, members of the
Twitter community answer the question “What’s happening?”
back and forth among themselves. One year after Twitter went Figure 2: Use of the Twitter hashtag #itsabouttime over time.
live, members of the community, without involvement or support The value on the y-axis represents the proportion of this tag
from Twitter administrators, began tagging their tweets. If Twitter on that day. The red line is a 3-day moving average.
is a temporal stream of the aggregate thoughts of its users, why This type of tagging behavior s not observed in the Delicious data
would anyone want to go to the effort of tagging their tweets? It because the tags used in Delicious are attached to resources rather
would seem that there would be no use for attaching metadata to than to user-contributed data. In Twitter, a massively multi-party
this evaporating pool of thoughts. It would also seem that in an conversation can emerge as increasing numbers of users adopt the
online environment purposely constrained by space, the characters hashtag around which a micro-meme arises. Each user contributes
required to tag a tweet, which count toward the one-hundred- his or her own commentary to the stream of conversation.
forty-character-per-tweet limit, tagging would be slow to catch on.
The motivation for an individual to participate in an episode of
In reality, many members of the Twitter community do use
micro-meme tagging is to see their tweets displayed in the filtered
hashtags in their tweets.
stream of messages with that tag attached. Many of the micro-
Tagging practices differ between communities in which they are memes are constructed in topic-comment format, so people who
used due to the design of the individual systems as well as use Twitter might be interested in skimming a few dozen to a few
patterns of behavior which develop in response to those systems. hundred tweets offering individual (often humorous or insightful)
In our analysis, we saw tagging practices in Delicious as examples responses to the micro-meme. For example, in December 2009,
of organizational tagging. In Delicious, tags are attached to the hashtag #willgetyouslapped was a trending topic. A Twitter
resources in order to facilitate access to the resources at a later user saw this hashtag and tweeted, “Taking online courses without
date. Tags in Delicious also facilitate discovery through browsing owning a computer #willgetyouslapped. You can not take yo class
as each tag is a link to a list of all resources to which that tag has on yo iphone”. In this instance, the hashtag serves as the topic and
been attached. Thus, a user who tags a resource immediately the tweet can be interpreted as commentary on that topic.
places it in the context of all content that has been similarly
tagged. Delicious was designed as a metaphorical library of 5. STATISTICAL ANALYSIS
bookmarks for users to access easily on the web. Tags are the Next, we analyze tag and timestamp data using the second, third,
metadata that provide organizational structure in the system. and fourth moments: standard deviation, skew, and kurtosis. This
allows us to quantitatively describe the adoption of tags over time.
Our analysis covered both Twitter and Delicious; however, we
2 focus our statistical report on Twitter hashtags because the
http://brizzly.com/
3 patterns of Delicious data were unsurprising and generally regular.
http://www.tweetdeck.com/5.1 Standard Deviation #twitterafterdark
We can calculate the standard deviation of the timestamps for
each tag in Twitter. This measures the spread of activity of the tag,
representing how long a tag remained in use. The standard
deviation of our sample is calculated by the equation,
Daily Proportion
∑
1
From this, we find that a low standard deviation is a good
indicator that the tag is used for conversational (i.e. social) rather
than organizational purposes. Table 2 illustrates the tags extracted
from Twitter along with the standard deviation of their post date.
The tags are sorted by standard deviation, but only tags with the
lowest and highest standard deviations are shown for brevity.
Tag Std Dev #postcrossing
#ladiespleasestop 0.22
#ruleofrelationships 0.22
#clubrules 0.36
#helooksgoodbut 0.37
#thingssaidb4sex 0.38
#doyoumind 0.39
#oneletteroffmovies 0.51
#anybodyseen 0.54
#shelooksgoodbut 0.60
#excusemebut 0.68
Skip 214 tags…
#goodnight 70.53 Figure 3: Time-series charts for #twitterafterdark (above),
#fml 71.16 which has negative skew representing a large gain in adoption,
#gov20 71.62 and #postcrossing (below), where the positive skew indicates a
#nsfw 72.76 slow abandonment of the tag.
#energy 73.52 5.3 Kurtosis
#p2 75.03 The fourth moment, kurtosis, represents the staying power of a tag
#radio 78.22 around its peak popularity. The equation we used for kurtosis is,
#dollhouse 78.70 1
#bbcqt 82.74 ∑
3
#contest 90.91 1
∑
Table 2: Tags from the Twitter dataset with their post
timestamp sorted by standard deviation. This is a metric that concisely represents whether a tag maintained
continued use for some period of time. It can be used to differen-
The tags in Table 2 with small standard deviations are what we
tiate between micro-memes, recurring tags, or spam. Examples of
earlier referred to as micro-memes. These micro-memes can be
tags with positive and negative kurtosis are presented in Figure 4.
quantified in terms of their measures of standard deviation and
kurtosis. Their measures of standard deviation are low compared 6. DISCUSSION
to the measures of standard deviation of hashtags which are newly The metrics we have presented can support automatic detection of
coined but not associated with micro-memes. This means they are tagging behavior associated with emergent micro-memes. This
both adopted and abandoned in a short period of time. work is a first step towards building classifiers that can track the
short-lived participatory phenomena which we expect to
5.2 Skew proliferate in other real-time aggregations of user-created content.
The skew of the tag timestamps tells us whether the tag is one
which grows slowly and becomes adopted more over time, or one We have found a relationship between certain statistical metrics
that catches on instantly and decays in use. In other words, it and the adoption of specific tags over time. This indicates that
compares the rates of adoption against abandonment. Examples of metrics like standard deviation and kurtosis have potential
positive and negative skew are shown in Figure 3. Skew is also applications for automatically classifying the type of tag if its
known as the third moment, calculated by, usage pattern is known. Perhaps micro-memes can be tracked as
they are occurring to enhance social communication in Twitter.
1
∑ Skew can be used to measure the viral nature of a tag: whether a
1 / tag slowly gains traction up to a peak, or is adopted rapidly, but
∑ abandoned shortly after.#moonfruit This research results in an increased understanding of the
motivation for social tagging. The knowledge will also enrich our
understanding of how individuals classify their social communica-
tion in the aggregate. Through observation of how individuals
spontaneously create links within a body of content, we can better
address whether to design for the support of searching or
browsing, or some combination thereof when elaborating systems
for information retrieval. We also better understand the function of
tagging in the real-time search environment in addition to the
previously documented functions of tagging.
8. ACKNOWLEDGEMENTS
We thank Infochimps and the authors in [12] for collecting and
sharing the data used in this study. We also thank the anonymous
reviewers for their feedback on earlier drafts.
#h1n1
9. REFERENCES
[1] Adar, E., Weld, D. S., Bershad, B. N., and Gribble, S. S.
2007. Why we search: visualizing and predicting user beha-
vior. In Proceedings of WWW '07, 161–170.
[2] Carman, M. J., Baillie, M., Gwadera, R., and Crestani, F.
2009. A statistical comparison of tag and query logs. In Pro-
ceedings of SIGIR '09, 123–130.
[3] Chien, S. and Immorlica, N. 2005. Semantic similarity
between search engine queries using temporal correlation. In
Proceedings of WWW '05, 2–11.
[4] Dellschaft, Klaas, and Steffen Staab. 2008. An epistemic
dynamic model for tagging systems. In Proceedings of HT
'08, 71–80.
Figure 4: Charts for #moonfruit (above) where the positive [5] Ding, Y, Jacob, E.K., Zhang, Z., Foo, S., Yan, E., George,
kurtosis represents short temporal activity, and #h1n1 (below) N.L., and Guo, L. 2009. Perspectives on social tagging. JAS-
with negative kurtosis, emphasizing the tag’s staying power. IST, 60, 12, 2388–2401.
While Twitter is one of the first platforms where tagging has a [6] Ginsberg, J., Mohebbi, M.H., Patel, R.S., Brammer, L.,
conversational function, we expect these findings to generalize to Smolinski, M.S., and Brilliant, L. Detecting influenza epidem-
other social platforms such as the recently launched Google Buzz. ics using search engine query data. Nature, 457, 1012–1015.
On the other hand, since tagging behavior differs depending on
[7] Java, A., Song, X., Finin, T., and Tseng, B. 2007. Why we
the system’s focus on conversation or organization, studying tag
twitter: understanding microblogging usage and communi-
behavior on Delicious or Flickr will not necessarily translate into
ties. In SNA-KDD Workshop Proceedings, KDD 2007, 56–65.
the same findings on Twitter. Similarly, interfaces supporting
tagging like the tag cloud have been commonly used for browsing [8] Marlow, C, Naaman, M., Boyd, D., and Davis, M. 2006.
content, but may be less useful for achieving conversational goals. HT06, tagging paper, taxonomy, Flickr, academic article, to
read. In Proceedings of HT '06, 31–40.
Our work adds to the discussion of why people use microblogging
[9] Santos-Neto, E., Condon, D., Andrade, N., Iamnitchi, A., and
services. Two studies of Twitter [7,14] report nearly identical
Ripeanu, M. 2009. Individual and social behavior in tagging
reasons: to report daily activities, conversation, sharing informa-
systems. In Proceedings of HT '09, 183–192.
tion or URLs, and breaking news. Clearly, the short-term
conversational nature of hashtags are useful in conversation and [10] Shimshoni, Y., Efron, N., and Matias, Y. 2009. On the
breaking news. However, people’s use of Twitter changes over Predictability of Search Trends. Working draft. Retrieved
time. There has been an increase in services which archive and http://research.google.com/archive/google_trends_predictabil
allow searching of past tweets. This may alter the role of the ity.pdf on February 2, 2010.
hashtag in the future. [11] Vlachos, M., Meek, C., Vagena, Z., and Gunopulos, D. 2004.
Identifying similarities, periodicities and bursts for online
7. CONCLUSION search queries. In Proceedings of SIGMOD '04, 131–142.
We use interpretive and statistical approaches to explore the
[12] Wetzker, R., Zimmermann, C., and Bauckhage, C. 2008.
patterns of Twitter tags over time and compare them with
Analyzing social bookmarking systems: A del.icio.us cook-
Delicious tags. We find that the differences in tagging practice
book. In MSoDa Workshop Proceedings, ECAI 2008, 26–30.
between the two systems are caused by their design and function.
Users add tags to their messages in Twitter to join discussions on [13] Wu, C. and Zhou, B. 2009. Analysis of tag within online
existing topics. This leads to the phenomenon of micro-memes, social networks. In Proceedings of GROUP '09, 21–30.
where clever short-lived tags catch on and then die-out quickly. [14] Zhao, D. and Rosson, M. 2009. How and why people
Statistical measures of standard deviation and kurtosis are Twitter: the role that micro-blogging plays in informal com-
correlated with patterning of these micro-memes. munication at work. In Proceedings of GROUP '09, 243-252.You can also read