Indonesia Clean Stove Initiative From Concept to the Field to the Lab - TOWARDS UNIVERSAL ACCESS TO CLEAN COOKING SOLUTIONS
←
→
Page content transcription
If your browser does not render page correctly, please read the page content below
TOWARDS UNIVERSAL ACCESS TO CLEAN COOKING SOLUTIONS

          Indonesia Clean Stove Initiative
                         -
        From Concept to the Field to the Lab

                     Laurent Durix
              for the Indonesia CSI Team

                                                  1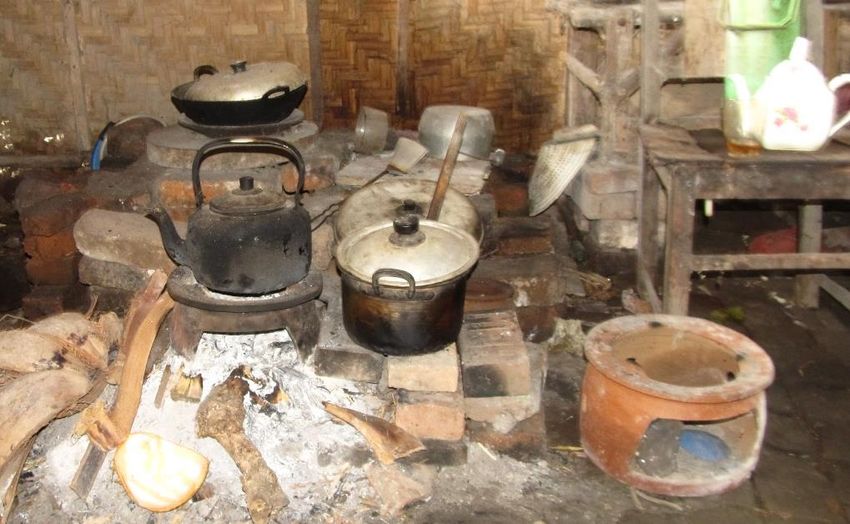
Part I:
From the Concept to the Field

                                2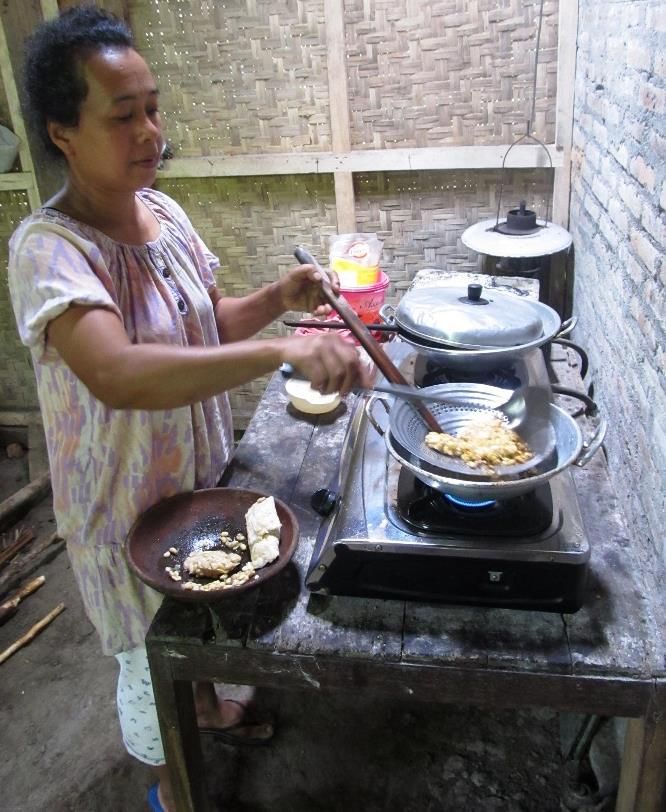
Situation in Indonesia - CSI Phase I
 •   Just ended one of the largest conversion to a new
     fuel – from Kerose to LPG: From 2007 to 2012 up to
     54 LPG million packages (stove and cylinder)
     distributed. Gradual but large scale program. Some
     area (yellow) will not get LPG.

 •   At the same time, attempts to introduced clean
     biomass stoves – date back to late 1970’s – small-
     scale- driven by localized initiatives (NGOs) had only
     limited successes.

                                                              3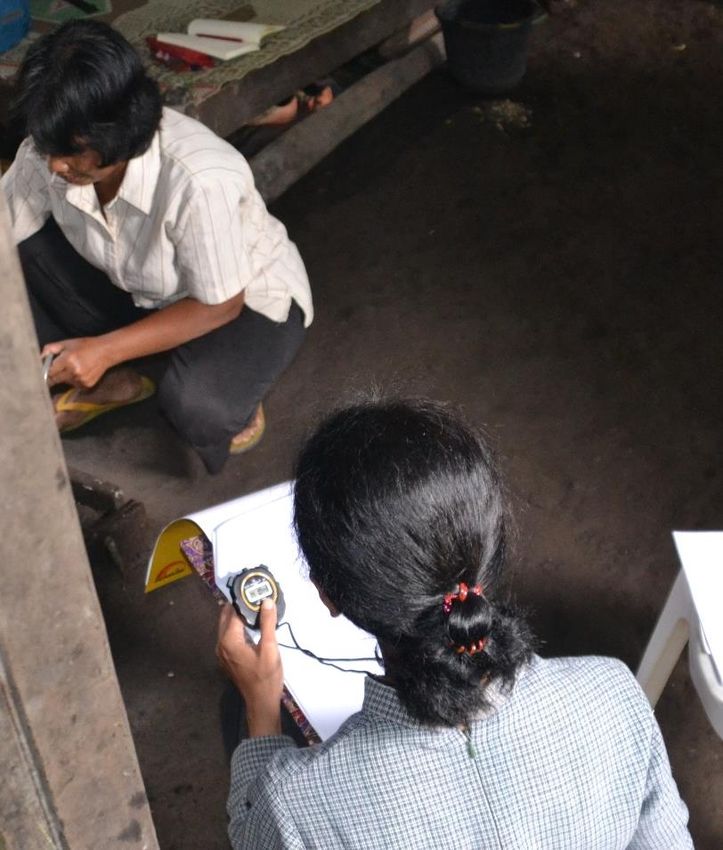
Situation in Indonesia - CSI Phase I (ctd)
 •     Official statistics say that forty percent of Indonesia’s more than 60 million households continue to rely
       heavily on traditional biomass fuels for cooking. WHO states that household air pollution from solid fuel
       combustion is linked to some 165,000 premature deaths in Indonesia each year.

 •     In most of rural Indonesia, biomass is renewably harvested, abundant and affordable to the poor. Scaled-up
       use of clean biomass stoves could mitigate the health risks of traditional biomass cooking and contribute to
       Indonesia’s green growth agenda.

                                                                  Households relying on fuelwood as primary cooking
                 2010 Primary cooking fuels                                          fuel in 2010
100%
 90%                                             None
 80%
                                                 Wood
 70%
 60%
                                                 Charcoal
 50%
 40%                                             Kerosene

 30%
                                                 LPG
 20%
 10%                                             Electricity
 0%
       DI Yogyakarta   Jawa Timur   Indonesia

                                                                                                                    4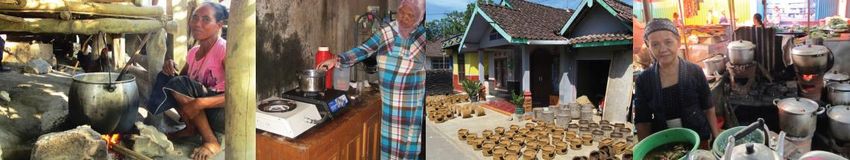
The Vision: Universal Access to Clean Cooking
 • Long term vision: Universal Access to Clean Cooking by 2030
 • Mid-term target: Deliver 10 million clean biomass cookstoves by 2022
 • Short-term plan: Test the RBF mechanism through the CSI pilot in 2015

                                                                        Clean Biomass
                                                                        Stove Market
                                                                        Penetration

                                                         2nd National
                                  National                 Program
                                  Program

                                            Stage III
                                                                                   40%
                                 Stage II
                             Stage I
                     Pilot

       2010
                      2016                        2022                          2030
                                                                                         5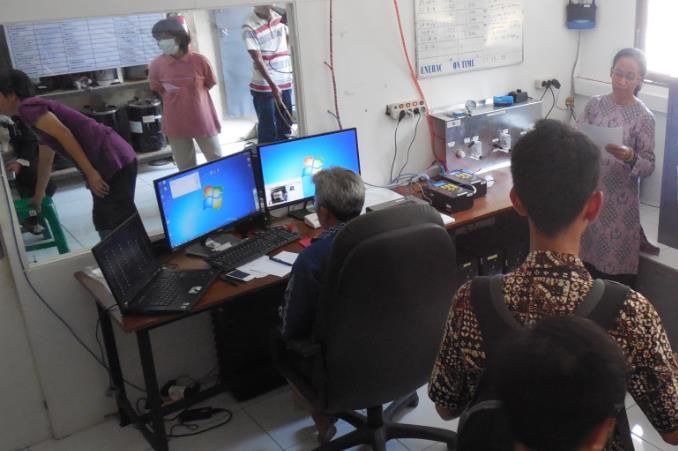
A tool: Results-Based Financing Framework

                                            6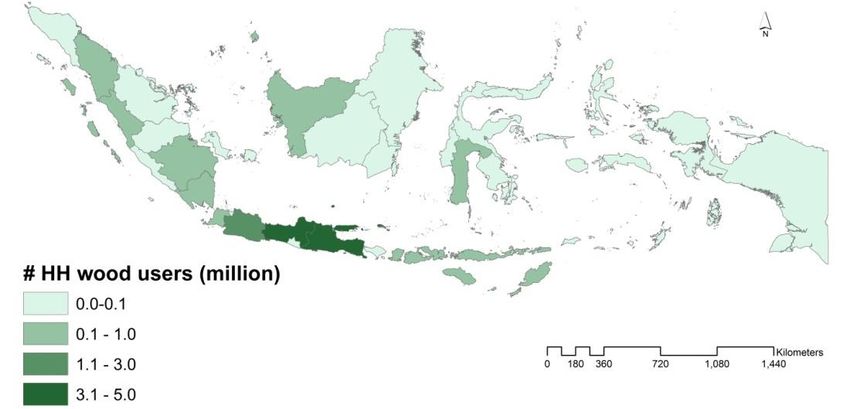
BUT …. National statistics can be misleading
 •     Stove adoption is an individual decision – global trends exist but field reality is much more complex. In
       Central Java, where the most wood users are located, provincial-level statistics show roughly half primarily
       wood users, half primarily LPG users and not much else (by 2013 kerosene has disappeared)

 •     It was very clear from field visits that this LPG/Biomass dichotomy was not so obvious at household level.
       How to integrate this fact in project design? The first step is to actually understand the field reality and accept
       that others are better equipped for this.

 •     In comes the Social Team coordinated by Helen Carlsson Rex: An Anthropologist, a Gender specialist, a
       Sociologist supported by a very competent local NGO.
                 2010 Primary cooking fuels
100%                                                              Households relying on fuelwood as primary cooking
 90%                                               None                              fuel in 2010
 80%
                                                   Wood
 70%
 60%
                                                   Charcoal
 50%
 40%                                               Kerosene

 30%
                                                   LPG
 20%
 10%                                               Electricity
 0%
       DI Yogyakarta   Jawa Timur   Indonesia

                                                                                                                        7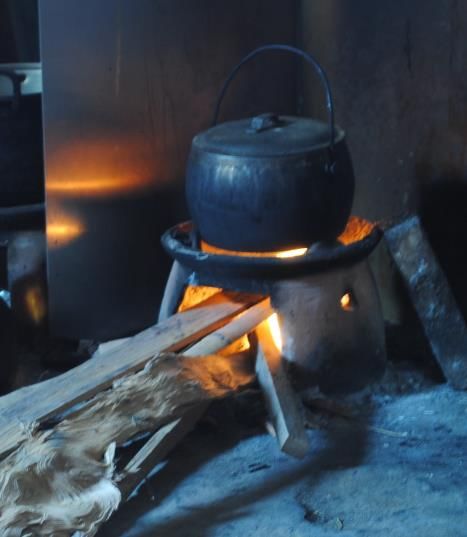
CHALLENGE: Increase Uptake & Use of Clean
                    Stoves
Piloting Experimental Approaches to Integrate Social & Gender Aspects in Clean Stove Testing & Promotion

1.                   2.                    3.                   4.                    5.
Qualitative          Survey to             Integration of       Social testing        Insights into
socio-cultural       validate              socio-cultural       protocol for          marketing &
exploration          qualitative           factors into         development &         promotion
                     findings              technical test       design of clean       strategies
                                                                cookstoves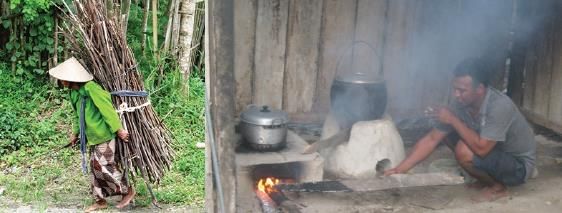
Part II:
    From the Field to the Lab

(And some food for thought on “stove markets”)

                                                 9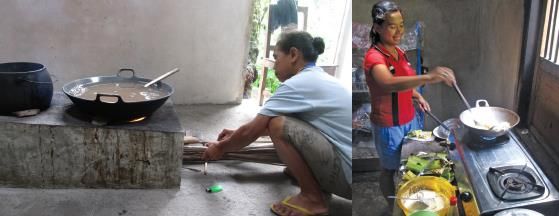
1 AND 2: Social analysis to understand households behavior
   •    A mix of fine qualitative analysis and strong quantitative verification of results. Households visits and
        cooking sequence observation, focus discussion groups and large scale survey (1,400 randomly
        sampled households in the pilot area)

   •    Pilot study area is peri-urban ring around Yogyakarta, Central Java.

   •    First results:
          – Half of households use both LPG and Biomass
          – Therefore biomass is used by close to 3 out of 4 households (hh)
          – Keren stove, is most used biomass stove
          – This baseline stove is very versatile and very well handled by cooks

                 2010 Primary cooking fuels                         Yogya peri-urban Survey 2014, total and by income quintile
100%                                                       100%
                                                                                100%                                                          5%
 90%                                            None       90%    Firewood
                                                                                 90%                                          18%
                                                                  only, 25%                                     24%
                                                           80%                                    30%
 80%                                 Wood                                        80%
                         Wood                   Wood
 70%      Wood                                             70%                   70%                                                         50%
 60%                                                       60%                   60%
                                                Charcoal          Firewood                                                    47%
 50%                                                       50%     & LPG,                                       51%
                                                                                 50%
                                                                     47%                          52%
 40%                                            Kerosene 40%                     40%
 30%                                                       30%                   30%
           LPG            LPG         LPG       LPG
 20%                                                       20%                   20%                                                         45%
                                                                  LPG only,                                                   34%
 10%                                                                27%                                         25%
                                                Electricity 10%                  10%              19%
 0%                                                         0%                    0%
       DI Yogyakarta   Jawa Timur   Indonesia                       Total         Quintile 1    Quintile 2    Quintile 3    Quintile 4 10Quintile 5 >
                                                                                    x>$112    $112>x>$150   $150>x>$240      $240
Digging a bit deeper in aggregate households behavior
• A third fuel is used: electricity.
– For rice cooking and warming – half of hh survey used these appliances
– Rice warmer-only exists as a separate appliance (market niche)
• In the end:
– Only 27 % of hh use just one fuel
– 45% use two fuels
– 28% use 3 fuels
• There is often a Modern kitchen and a Traditional Kitchen in a household
LPG, Firewood, Firewood only
& rice cooker 18%
&/or warmer
28%
LPG only
9%
Electric & rice
LPG & rice cooker &/or
cooker &/or warmer
warmer 0%
LPG &
18%
Firewood
Firewood & 20%
rice cooker
&/or warmer
7%
11What do people do with these 3 fuels?
• Some level of task-specialization for each fuel start to emerge.
– Electricity is for rice cooking and/or keeping warm
– Wood and LPG are used to cook and boil water but more hh
• Cook-only with LPG
• Boil water-only with Biomass
– We can assume [unverified by data yet] that quantities of water involved in cook&boil vary between LPG
and Biomass
100%
90% Do not use Do not use
26% 27%
80% Do not use
Business, 3% 47%
70% Business, 7%
Percent of Households
60%
50% Cook & Boil Water, 45%
40% Cook & Boil Water, 47%
Rice Cooker &
Warmer, 33%
30%
Boil Water, 1%
20%
Cook, 26%
10% Boil Water, 17% Rice warmer, 20%
0% Cook, 1%
LPG Firewood Electricity
12Away from fuel, into cooking tasks and cooking cycles
• Irrespective of fuel used, households do the following type of cooking tasks
– All Boil water and cook rice
– Vast majority deep fry and cook soup and many stir fry
• Two main cooking events happen and some involve only reheating
– Morning cooking (takes 65 to 80 minutes in average)
– Dinner cooking (circa 30 mn)
– Lunch is a minor event
Breakfast Cooking Tasks Dinner Cooking Tasks
100% 97%96% 100%
Boil water Cook rice Deep fried Boil water Cook rice Deep fried Make soup
90% 90%
Make soup Stir fried Steam/Boil
Grill food Stir fried Steam/Boil Grill food
80% 75% 80%
70% 70%
Percent of Households
Percent of Households
58% 60%
60% 60% 54%
50% 46% 50%
40%
40% 34% 40%
30%
30% 30%
20% 20%
13% 14%
11%
10% 8% 8%
10% 5%
0.1% 0.6% 2% 0.8%0.3% 0.50% 2% 0.70%
0% 0%
Cooking Reheating Cooking Reheating
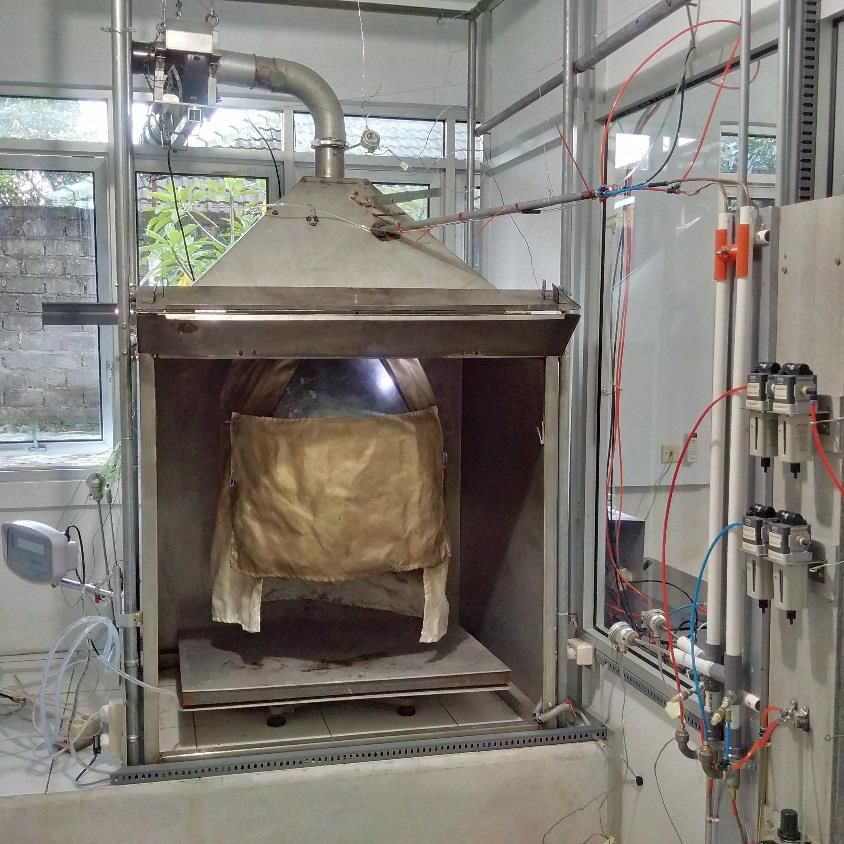
133. Integration of socio-cultural factors into Technical Test
• New testing method measures the whole burning/cooking cycle in line with local cooking practices,
based on anthropologist and sociologist field studies and verified by the detailed household survey
• Common and representative Cooking Cycles are identified and described in details by the Social Team
• Then the Lab Team extracts the related Burn cycles and selects two that are frequent but dissimilar,
and combine them into a Technical Test (TT).3. A culturally relevant Technical Test
• The Technical Test (TT) emissions are similar to these of
the related cooking cycles.
• The TT lab results reasonably predicts tested stove
average performance in areas that use similar cooking
cycles (e.g. Central Java).
• The test together with the cooking cycle was ‘packaged’
as the CSI-WHT (water heating test) so as to explain it
more easily to suppliers3. Technical Test and Stove Evaluation CSI Star Rating are awarded – example in table below.
From the Lab .. Back to the Concept
 •   RBF Incentives are linked to Cookstoves Star Ratings from tests
                                                                                             Indicator Testing
 • Minimum to              No                  Stove Name
                                                                   Total Incentive
                                                                                                     CO       PM2.5
 receive subsidy: at                                              to be given (RP)                (g/MJNET) (g/MJNET)
 least a single star in                                                              Efficiency
 each category.

 • 10,000 Rp for each
 star for a total of        1   RWW1                                   220,000.00       **          ***          ***
 30,000 Rp.

 • 30,000 Rp for each
 second star in each
 category. If 2 second
                            2   ZAMA-ZAMA                              170,000.00       **           **          ***
 stars, then 60,000 Rp
 and if 3 second stars
 then 90,000 Rp.
                                PS1 W
 • 50,000 Rp for each       3                                          220,000.00       **          ***          ***
 third star in each
 category. If 2 third
 stars, then 100,000 Rp
 and if 3 third stars       4   Prime Square Wood                      190,000.00        *          ***          ***
 then 150,000 Rp.

                            5   FIELD DRAGON                           140,000.00        *           **          ***
Personal concluding thoughts …
Keeping in mind that this is a Behavior Change CoP BBL …
… whose “behaviors” do we want to change?
1. Households? Implied – women that do the cooking
2. Project designing Teams? Implied – Us World Bank, governments, other Donors or consulting teams
3. Testing labs?
4. Stove designers & manufacturers?
5. Stove retailers & marketers?
In my personal opinion, we started addressing some behaviors of the 2nd and 3rd ….
… but more needs to be done on 4th and 5th before we go back to the 1st !
This is a work in progress … to be continued !You can also read