The Value of Environmental Goods and Services in KZN - Ezemvelo KZN Wildlife Debbie Jewitt
←
→
Page content transcription
If your browser does not render page correctly, please read the page content below
The Value of
Environmental Goods and Services
             in KZN
           Steve McKean
          Steve@KZNWildlife.com

            Debbie Jewitt

           Joe Phadima
           Myles Mander

      Ezemvelo KZN Wildlife
Introduction to Natural Capital and
Ecosystem Services: Some background.
The 4 capitals…..

• Built capital is the infrastructure (buildings, roads,
  houses, etc.) that make up the material structure of
  human society.

• Human capital is the physical bodies of individual
  humans, their health and education, and the information
  stored in their brains.

• Social capital is the web of interpersonal connections,
  institutional arrangements, rules and norms that facilitate
  human interactions.

• Natural capital is the land and the resources it contains,
  including ecological systems and services.
Capitals and their connections
                         Nature:                                 Economy:
                    Ecosystem services,                        (Fixed) Capital
                       biodiversity,                             Production
                          Water                                     Trade

 Nature destabilizes                         Society:                        Economy destabilizes
 economy                                 Welfare & Rights                    nature (e.g. greenhouse
 (e.g. peak oil or climate         Intellectual & Social Capital             gas or pollution)
 change)                                    Institutions

                                          Governance:
                                          Transparency
                                    Contracts & Accountability
                                       Standards & Laws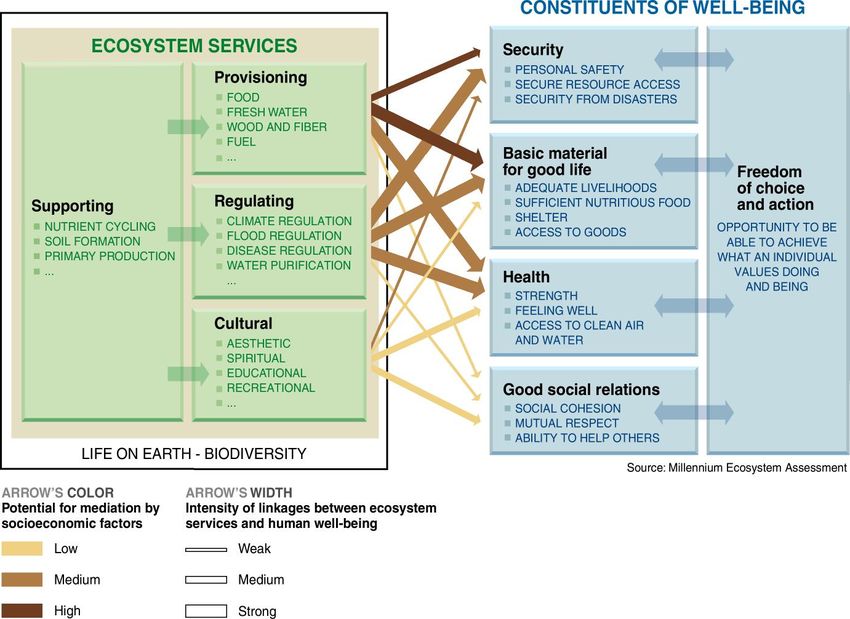
Business as usual – natural environment
is infinite...
Energy
Growing and
Economy and Resources Infinite
society environment
Separate from Source of
environment resources
Free of Wastes Sink for wastes
biophysical
constraints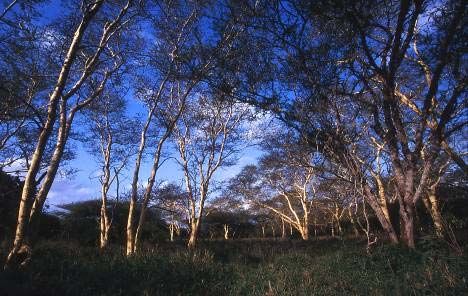
Emerging economic realisation – natural
environment is FINITE...
Energy
Growing a and
Greener Resources Finite
Economy Environment
Source of renewable
Adding value to the
resources
environment
Source of ecosystem
Optimizing scarce Wastes services
resources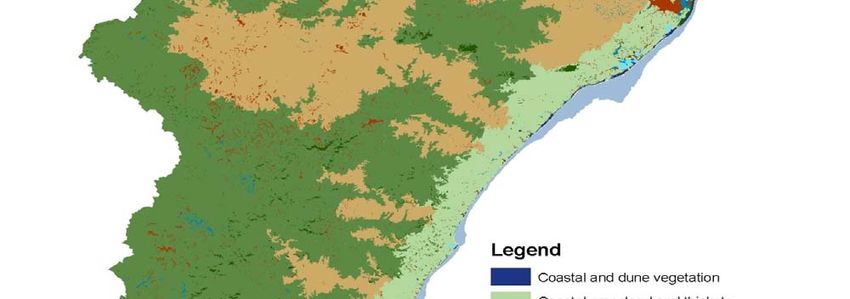
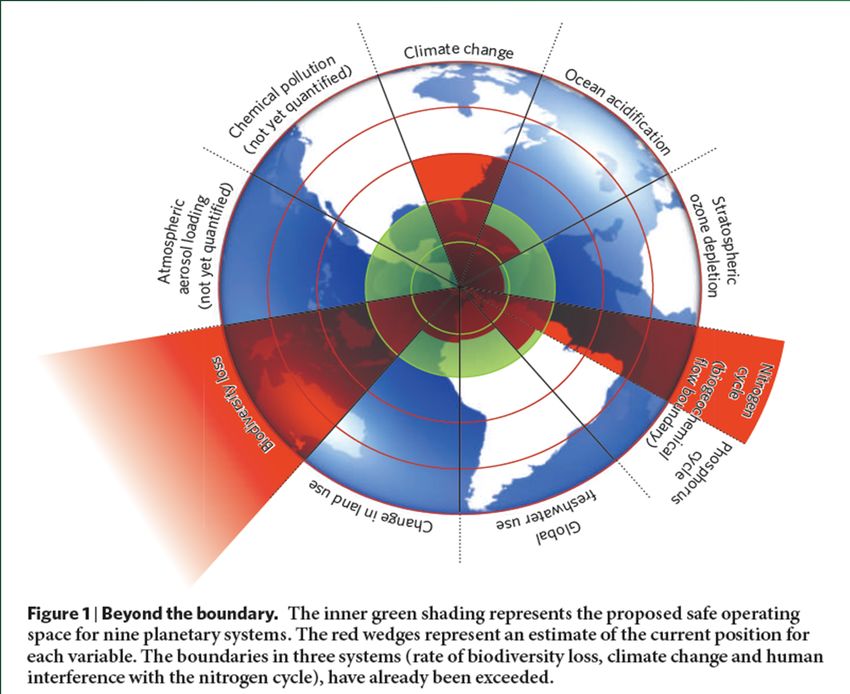
A safe operating space for humanity. Nature 461:472-475
Operating outside the safe space at the local
                    scale.

• Water quality trends in Albert Falls Dam (1999-2009):
  132% increase in Phosphorus; 215% increase in
  chlorophyll ‘a’

• Water quality trends in Nagle Dam (1999-2009):
   668% increase in TP; 738% increase in chlorophyll ‘a’

• The limitations of built infrastructure:
    28 out of 800 waste water works operating with
    acceptable standards means huge reliance on natural
    capital to supply services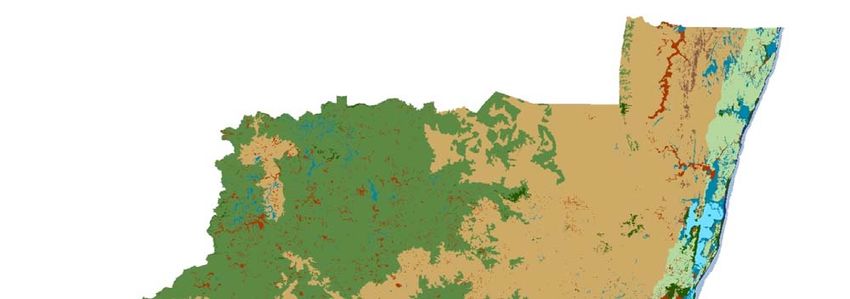
Operating outside the safe space -
                  HEADLINES.

• Flood costs KZN R715m
   – 25th January 2011
• KZN storm damage hits R40m
   – 18th Feb 2010
• R617m for KZN flood damage
   – 28th January 2009

• Storms, floods, tornadoes and weather conditions
  never seen in KwaZulu-Natal before cost the
  provincial government close to R4-billion in 2007.
GREEN INFRASTRUCTURE AND ECOSYSTEM
SERVICES: THE BENEFITS PEOPLE DERIVE FROM
                 NATURE

  .
Why value ecosystem goods
        and services?
• Inadequate political and economic support
  as the full value to society is not
  recognised – failure to recognise
  economic value of natural systems
  underlie their decline.
• Need for full roles and values of natural
  areas in society to be valued and
  explained in relevant terms.
• Need a compelling economic case for
  biodiversity and ecosystem conservation.
Hence, KZN Wildlife conducted a study in 2011 to determine the economic value of the essential services provides by biodiversity Biodiversity is the “engine” which produces services to society which society often takes for granted.
Habitat types
           of KZN

D Jewitt
So what are these services worth?
• The overall value of ecosystems services is calculated
at R149.6 billion per year
• To put the figures in perspective;
R 250,000 2011
R 204,000
R 200,000
R 149,671
Millions
R 150,000
Provincial Finance Budget
R 100,000 R 70,000
R 50,000 KZN GDP
R- Ecosystem services valueEcosystem service value from different
habitat types
Grasslands, with services Wetlands, with services
such as soil erosion such as flood reduction, water
prevention, grazing, flood purification.
damage reduction..
R38.4 billion
R11.4 billion
(
Forests, with services such Estuaries with services
as carbon sequestration. such as fish and prawn
nurseries.
R2.9 billion
R10.8 billion
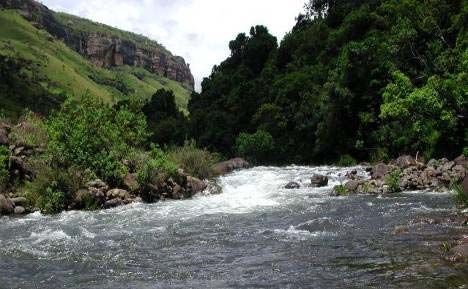
Rivers, with.services such Floodplains, with services
as water supply, water such as water quality
purification. management.
R18.7 billion R43.5 billion
Savannas, with services Rocky shores and
such as fuelwood provision, beaches with services such
grazing. as sea food and recreation.
R19 billion R275 million
Vegetated dunes, with Reefs, with services such
services such as the as tourism.
protection of beach properties
from coastal storms.
R4.2 billion
R596 millionEZEMVELO’s MANDATE
Biodiversity Conservation and EcoTourism
EZEMVELO’s MISSION
T o ensure effective conservation and sustainable
use
of KwaZulu-Natal’s biodiversity in collaboration with
stakeholders for the benefit of present and future
generations
Both inside and outside protected areasWhat does that mean in real terms?
Biodiversity offers R150 billion worth of services
Ezemvelo is given a budget of
R512 million to conserve biodiversity
The return on this is R292.36 for every R1
invested by the province in Ezemvelo (with
contributions from other relevant organisations)
What other investment by government provides a
return of this magnitude?
This value could also be taken as the amount that
Treasury would have to fund should there be no
ecosystems services providedImportant to reverse this trend of value loss through:
rehabilitation, prevent transformation of pristine
habitats, effective management and expand
protected area estate
R 250,000 Millions R 204,000
R 200,000
R 149,671
R 150,000
R 100,000 R 70,000 R 56,634
R 50,000 Value in KZN
R‐
et
P
ue
s
ea
GD
dg
al
Just over 8% of KZN is
Ar
sv
Bu
N
d
KZ
ic e
protected, yet protected
te
ce
ec
rv
an
areas account for a large
se
ot
in
Pr
lF
m
proportion of the value of
te
cia
ys
services provided
in
os
ov
Ec
PrPROJECTED LOSS OF SERVICE VALUE DUE TO
TRANSFORMATION OF NATURAL ASSETS
100
90
Natural Area Remaining in KZN (%)
80
1994 Connectivity Threshold
70
2000
60 2005
2008 Persistence Threshold
50
40
Fragmentation Threshold
30
20
10
0
1994 1998 2002 2006 2010 2014 2018 2022 2026 2030 2034 2038 2042 2046 2050
Year
TOTAL SERVICES 2011 2021 2031
PROVIDED BY R 149 R 132 R 89
BIODIVERSITY billion billion billionConsequences of loss?
Some examples
• Alien plants reduce water supply by 7%
already…..predicted to increase to 21% in 20 years.
- Mvoti-Mzimkulu water management area – current
loss = 126 million m3 - projected to grow to 420
3
. million m
- Replacement infrastructure - Spring Grove Dam
142 million m3 - at a cost of R2.1 billion
• Reduction in the efficiency of built infrastructure due
to sedimentation
• Umzimvubu produces 5 million m3 pa due to
degradation – a Spring Grove dam would take 28
years to become filled with sedimentConsequences of loss?
more examples
• What would it cost rural households to replace fuel wood with
paraffin for cooking and heating?
• What would it cost province to supply rural households with water,
reticulated sewage systems, build only with commercially available
building materials……etc?
• What would be the cost of only formal jobs in industry to replace
current jobs associated with agriculture and tourism?
.
• If natural assets not managed, government would need to find R150
billion to substitute the services which ecosystem goods and
services currently provide to maintain CURRENT livelihoodsWay forward…….. Product improvement: - Finer scale - Value ecosystem services of land cover types and areas in varying . condition. E.g. PSED – Provincial Strategic Economic Strategy - Incorporating “ecosystem dis- services” (e.g. acid mine drainage, car parks etc)
Way forward……..
Planning:
  - All scales but hierarchical - National,
    provincial, district municipalities, local
    municipalities e.g. PGDS – Provincial
    Growth and Development Strategy.
  - The full value of biodiversity must be
    recognised by economists in order to
    make balanced decisions.
  - Many different products from different
    sources, done in different ways – could
    create confusion amongst users!
Thank you!
You can also read