Inflation Nation Putting Spring Statement 2022 in context - Resolution Foundation
←
→
Page content transcription
If your browser does not render page correctly, please read the page content below
BRIEFING

                                   Inflation Nation
                           Putting Spring Statement 2022 in context
      Torsten Bell, Mike Brewer, Adam Corlett, Sophie Hale, Karl Handscomb, Lindsay Judge, Jack
      Leslie, Jonathan Marshall, Louise Murphy, Krishan Shah, James Smith, Hannah Slaughter &
                                                                                 Greg Thwaites
                                                                                    March 2022

resolutionfoundation.org                                                           @resfoundation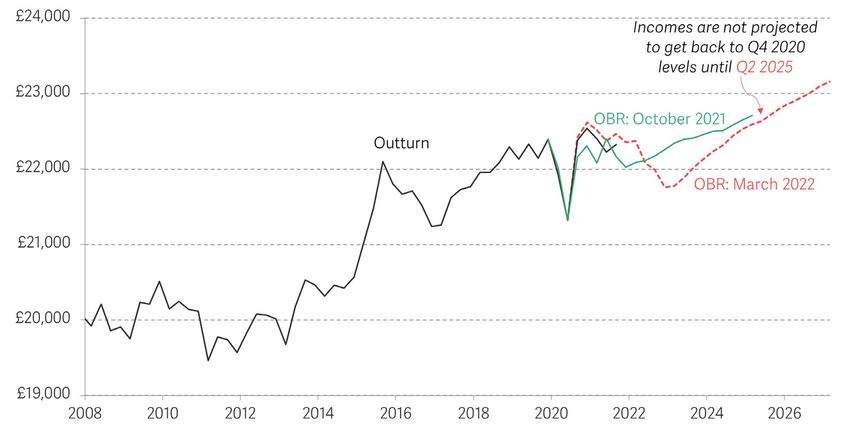
Inflation Nation | Putting Spring Statement 2022 in context                                  2

Summary
It’s hard to overstate the scale of the cost of living crisis that’s coming in 2022-23, with
the highest inflation in 40 years and the worst income squeeze on record lying ahead of
us. Against that backdrop, and with fiscal ammunition thanks to the Office for Budget
Responsibility’s (OBR’s) borrowing forecasts improving by £42.4 billion over five years,
the Chancellor set himself two tasks at Spring Statement 2022: to offer the public some
protection against the surging cost of living, and to show the Conservative Party that
he is a tax cutter. He set out significant packages on both fronts. But an indefensible
refusal to target support at low- and middle-income households next year, and previously
announced tax rises, meant he has fallen well short of both goals.

The stronger than expected recovery from the pandemic is about to be
undermined by surging inflation

The British economy has continued its stronger-than-expected recovery from the
pandemic, with the economy now around 0.5 per cent larger, and unemployment almost
400,000 lower, than projected in October 2021. But surging inflation is the main economic
news, with the OBR doubling its forecast for 2022’s inflation peak to 8.7 per cent. Rising
costs for firms and falling incomes for consumers mean that growth for 2022 has been
revised down from 6 per cent to 3.8 per cent, although (unlike the Bank of England) the
OBR assume there is no lasting damage to the size of the economy.

There is, however, significant damage to real wages, which are projected to fall by 3.6
per cent over the course of 2022. The slow recovery from this fall, on the back of the
disastrous wage stagnation of the past decade, means that by 2027, real wages are set to
have grown by just £18 a week since the financial crisis, compared to £240 a week if they
had grown in line with the pre-financial crisis trend.

Immediate support has done little for the low- and middle- income households
worst affected by the rising cost of living

The Chancellor has responded to surging inflation with a significant, but poorly targeted,
package of support for 2022-23, choosing to rebuild his tax-cutting credentials rather
than target the households worst affected by the rising cost of living. Measures include
raising the National Insurance threshold from £9,880 to £12,570 in July, a 5p cut to Fuel
Duty rates, and a £500 million increase to the Household Support Fund.

Only £1 in every £3 for the measures announced yesterday will go to the bottom half of
the income distribution. Households in the top half gain an average of £475, compared
to just £136 for the poorest fifth of households. If we consider these measures alongside
previously announced support for energy bills and (larger) tax rises, the Treasury is only

Resolution Foundation
Inflation Nation | Putting Spring Statement 2022 in context                                   3

offering limited support to household budgets next year: an average boost of £110. That
average hides big losses amongst higher income households from tax increases: a typical
household gains £323, but policy changes will actually make households in the top half of
the income worse off, on average, by £169 a year.

Even taking into account the support measures announced by the Chancellor yesterday,
the typical working-age household faces an income fall of 4 per cent or £1,100 in 2022-
23. But the greatest falls will be felt by the poorest quarter of households who are set
to see their real incomes drop by 6 per cent as benefits fail to keep pace with the rising
prices. As a result, a further 1.3 million people will fall into absolute poverty next year
including 500,000 children – the first time Britain has seen such a rise in poverty outside
of recessions.

This scale of income shock is not one the country is projected to recovery swiftly from.
Incomes are on course to be lower at the next election (2024-25) than they were at the
previous (2019), with typical non-pensioner income projected to be 2 per cent lower. Such
an outcome would make this the worst parliament on record for living standards growth.

Despite the headlines, taxes are going up not down

Looking further ahead, the Chancellor also announced a 1p cut in the basic rate of
Income Tax for April 2024 which looks set to save the average earner £243 a year. But the
gains of this and the lasting impact of a higher National Insurance threshold are more
than wiped out by previously announced tax rises: the Health and Care Levy combined
with the freeze to Income Tax thresholds.

In 2024-25, when the income tax cut comes into effect, 27 million out of the 31 million
people in work will pay more Income Tax and NI as a result of personal tax changes
announced by Rishi Sunak. Households in the middle of the income distribution will on
average be £535 a year worse off, while losses among the richest ten percent will average
over £2,000. Cutting the basic Income Tax rate while raising that for National Insurance
(via the Health and Care Levy) also makes little sense. It widens the gaps in marginal tax
rates paid by many working-age people versus those in retirement, or workers versus
landlords, on the same level of income.

Looking beyond just personal income taxes, the Chancellor set out his intention to
support capital and R&D investment by British firms, but the big picture is taxes going
up, not down. Tax receipts as a share of the economy are set to reach their highest level
since 1982-83 – the equivalent of a £3,000 rise per household since the 2019 election.

Resolution Foundation
Inflation Nation | Putting Spring Statement 2022 in context                                   4

The Chancellor did not offer protection for public services from rising inflation

Although the Chancellor stepped in to offer households some protection from higher
than expected inflation, he chose not to do so for public services. This in part reflects the
fact that costs of production in the UK are not rising as fast as the costs of consumption,
with the latter driven by the cost of imports (particularly energy). As a result, the 3.3 per
cent annualised real increase in non-Covid day-to-day spending between 2021-22 and
2024-25 that was planned in Autumn 2021 has fallen, but only to 2.9 per cent. Real day-to-
day spending on defence will now decline by 5.7 per cent between 2021-22 and 2024-25,
up from the 4.3 per cent fall expected in October.

Unlike household finances, the public finances have improved

While household finances are taking a hammering, the public finances have actually
been on the up: tax receipts have come in much stronger in 2021-22 than expected
and the OBR expects a lasting improvement on that front that averages to around £35
billion a year. This is only partially offset by (the eventually) higher benefit and (largely
temporary) debt interest spending as a result of higher inflation, leaving borrowing across
the forecast period projected to be £25.6 billion lower than expected in the Autumn even
accounting for the significant tax cuts announced yesterday.

This contributes to a staggeringly quick fiscal consolidation, with borrowing falling from
14.8 per cent in 2020-21 to just 1.3 per cent in 2024-25. That would amount to three-times
the fall seen over the same length of time post-financial crisis, taking the deficit to
well below where it had been expected to reach before the pandemic, and to its lowest
levels since the surpluses of the early Gordon Brown chancellorship. As a result, the
Chancellor’s headroom against his fiscal rules (the binding rule that requires him to
have debt falling in 2024-25) has increased to £28 billion from the £18 billion forecast in
October 2021. That is the equivalent to a further 4p to 5p cut in the basic rate of Income
Tax.

This Spring Statement saw the Chancellor prioritise rebuilding his tax-cutting credentials
over supporting the low-to-middle income households who will be hardest hit from the
surging cost of living, but while also leaving himself fiscal flexibility in the years ahead.
The package of measures announced offered some immediate support to households
and laid the ground for a 2024 election. But on both counts it looks likely to be far from
the last word.

Resolution Foundation
Inflation Nation | Putting Spring Statement 2022 in context                                                       5

The OBR is forecasting a huge rise in inflation that will dominate the
economic and fiscal outlook
The key context to the Spring Statement is a near doubling of the OBR’s inflation
forecast, signalling a huge hit to living standards. CPI inflation was already at a 30-year
high in February, but the Russian invasion of Ukraine is set to push inflation even higher,
driven by further rises in the price of energy. As a result, the OBR has nearly doubled
its forecast for inflation this year from 4 per cent to 7.4 per cent. Inflation now has ‘twin
peaks’ this year: in October, inflation was expected to peak at 4.4 per cent in Q2 2022,
but the OBR’s latest forecast is for inflation to rise to 7.7 per cent in Q2 2022 before rising
further in the second half of the year, eventually peaking at 8.7 per cent in Q4 2022 (see
Figure 1).

The OBR acknowledges that there is significant uncertainty around its inflation forecast
– not least because it closed the forecast on 2 March, since when oil and gas prices
have fallen. Nevertheless, it is clear that we are set for a huge rise in prices: by the time
inflation returns to the Bank of England’s 2 per cent target (in Q4 2025), the level of
consumer prices is around 5 per cent higher than expected in October.

      FIGURE 1: The OBR is forecasting the highest inflation in its history
      Outturn and forecasts for 12-month CPI inflation: UK

10%
                                                                             Forecast
                                                                                        OBR (Mar 2022)

 8%

 6%
                                                                                                 OBR (Oct 2021)

 4%
                                      OBR (March 2020)                                            BoE (Feb 2022)

 2%
                   Outturn

 0%
   2016         2017         2018     2019        2020        2021       2022        2023        2024
      SOURCE: RF analysis of ONS; OBR, Economic and Fiscal Outlook, various; Bank of England, Monetary
      Policy Report, February 2022.

The nature of the rise in inflation means that it be disastrous for family finances but, as
we show later, contribute to stronger public finances. The combination of a faster-than-
expected recovery at home and abroad, with a shift in spending away from services and

Resolution Foundation
Inflation Nation | Putting Spring Statement 2022 in context 6 towards goods, has been met by higher inflation concentrated in the price of traded goods, particularly energy.1 This sort of shock means it costs more for the UK to buy goods from the rest of the world, effectively making us poorer, hobbling the recovery. But the faster recovery has also led to a tighter labour market, met by rate rises from the Bank of England.2 Given all this, we start with a brief discussion of the impact of high inflation on the economy, before discussing the policy measures taken in response. Despite the stronger recovery so far, the jump in the cost of living means the OBR’s growth outlook is weaker in the near term The good news for the Chancellor is that the stronger-than-expected recovery, with the fastest year of peacetime growth in nearly a century last year, has meant that the economy starts the forecast about 0.5 per cent larger than expected in October. This is despite an unforeseen ‘blip’ from Omicron which reduced GDP by 0.2 per cent in December. But the outlook is weaker, with higher inflation leading to a substantial markdown in growth for this year. As shown in Figure 2, the OBR is now expecting growth this year to be 3.8 per cent, considerably weaker than the 6 per cent forecast in October. This is the largest markdown to an official fiscal forecast for calendar-year growth outside of a recession. About 0.7 percentage points of this reflects the stronger-than-expected growth in 2021, but most reflects the impact of higher inflation. Looking further ahead, growth has also been marked down in 2023 before recovering to leave the size of the economy little changed from the previous forecast in the medium term. This reflects the OBR’s continued assumption of 2 per cent ‘scarring’ from the pandemic. 1 For more on the drivers of inflation, see: J Smith, Macroeconomic Policy Outlook: Q1 2022, Resolution Foundation, March 2022. 2 See, for example, Minutes of the Monetary Policy Committee meeting ending on 16 March 2022, Bank of England. Resolution Foundation
Inflation Nation | Putting Spring Statement 2022 in context                                                      7

      FIGURE 2: The OBR’s forecast for GDP starts stronger but is weaker further out
      Quarterly real GDP, outturn and select forecasts: UK
£620bn

£600bn
                                             OBR (Mar 2020)
£580bn

£560bn                                                                                          OBR (Mar 2022)
                                                                                       BoE (Feb 2022)
£540bn

£520bn
                                               OBR (Oct 2021)
£500bn
                                 Outturn
£480bn

£460bn

£440bn

£420bn
     2018Q1             2019Q1      2020Q1       2021Q1         2022Q1       2023Q1        2024Q1        2025Q1

      NOTES: Historic forecasts have been adjusted to reflect ONS revisions to the level of GDP.
      SOURCE: RF analysis of ONS; OBR, Economic and Fiscal Outlook, various; Bank of England, Monetary
      Policy Report, February 2022.

While the real size economy is little changed, cumulative growth in nominal GDP over the
forecast – a key driver of tax revenues – is slightly higher than it was in the OBR’s October
forecast. This reflects somewhat higher GDP deflator inflation, albeit to a much lesser
extent than for consumer prices because of the smaller role for higher import prices.

Given the huge jump in CPI inflation forecast by the OBR, and the negative effects it will
have on incomes and higher energy costs will have on production, it is perhaps surprising
that there is no lasting hit to economy. The OBR does note that there is a risk that there
could be more bad news stemming from the conflict in Ukraine. Nonetheless, the OBR’s
forecasts for GDP are noticeably stronger than those from the Bank of England (Figure
2) despite a much bigger rise in inflation (Figure 1). A key reason for this is that OBR’s
forecast is based on futures prices for oil and gas which imply that prices will fall back
sharply from their current elevated levels (the Bank of England’s forecast in contrast
assumes constant wholesale energy prices beyond six months). This means that the
required adjustment to higher import prices is much smaller in the OBR’s forecast.
As explained below, this contributes to limiting the extent to which unemployment
increases.

Resolution Foundation
Inflation Nation | Putting Spring Statement 2022 in context 8 The resilience of the labour market has been hugely good news, but higher inflation is set to hit pay packets Faster-than-expected GDP growth and policy support has combined to deliver an unprecedented bounce back in the labour market. The unemployment rate fell to 3.9 per cent in the three months to February 2022, below pre-pandemic levels. As a result, the labour market is now tighter than at any point in the past 20 years.3 This represents the fastest return to pre-crisis unemployment on record, considerably faster than after the financial crisis: the unemployment rate has fallen by 1.2 percentage points in the twelve months to January 2022, compared to an average fall of 0.5 percentage points per year between 2011 and 2019.4 And, due to the current strength of the labour market, the OBR expects the unemployment rate to remain at 3.9 per cent in the first quarter of 2022, 1.1 percentage points lower than its forecast in October 2021. This revision equates to 388,000 fewer people being unemployed. In the medium term, the OBR’s projection is for unemployment to remain low, peaking at only 4.2 per cent in 2023 (see Figure 3). In this respect, the OBR’s forecast differs considerably from the Bank of England’s February forecast which embodied a pickup in unemployment to 5 per cent by 2025. The OBR’s forecast is much more ‘Federal- Reserve like’ in its approach – predicting a sharp fall in inflation without a large rise in unemployment – dubbed an ‘immaculate disinflation’.5 However, although the OBR is optimistic about unemployment, it has revised its medium-term participation prediction downwards, reflecting higher economic inactivity among full-time students and those with long-term ill health. This fall in participation is set to outweigh the fall in unemployment, with the OBR revising medium-term total employment down by 104,000 compared to its prediction in October 2021. 3 G Thwaites, Labour market tight, household budgets tighter, Resolution Foundation, March 2022. 4 N Cominetti, L Gardiner & H Slaughter, The Full Monty: Facing up to the challenge of the coronavirus labour market crisis, Resolution Foundation, June 2020. 5 J Smialek, Fed raises rates and projects six more increases in 2022, New York Times, March 2022. Resolution Foundation
Inflation Nation | Putting Spring Statement 2022 in context                                                                        9

        FIGURE 3: The OBR predicts only a small rise in unemployment
        16+ unemployment rate, outturn and projections: UK
9%

8%
               Outturn
7%

6%                                                                                                         OBR (Mar
                                                                              OBR (Oct 2021)                2022)        BoE
                                                                                                                      (Feb 2022)
5%

4%
                                                                                           OBR (Mar 2020)
3%

2%

1%

0%
  2006          2008        2010        2012        2014       2016        2018        2020         2022       2024      2026

        SOURCE: RF analysis of ONS, Labour market statistics; OBR, Economic and fiscal outlook, various; Bank of
        England, Monetary Policy Report, February 2022.

A contributor to the optimism about this ‘immaculate disinflation’ not materially raising
unemployment is the view that, despite a rise in wage growth in the near term, workers
are expected to acquiesce to the huge rise in the cost of living by accepting a cut to their
real wages. In particular, the OBR expects the tight labour market to drive up nominal
wage growth in the short term: wages are expected to grow by 5.2 per cent in 2022 as a
whole (Figure 4). But beyond 2022, the OBR’s forecasts show no sign of the wage-price
spiral feared by some policy makers in recent months: wage growth is expected to fall
below 3 per cent in the medium term, before stabilising at 3.2 per cent in 2025.6 The result
is workers facing imminent, large falls in their living standards, as pay packets fail to keep
pace with rising prices. Indeed, as Figure 4 shows, real wages are set to fall by 3.6 per
cent over the course of 2022, driven by high inflation, and will not return to year-on-year
growth until the end of 2023.

6    S P Chan, Don’t ask for a big pay rise, warns Bank of England boss, BBC News, February 2022.

Resolution Foundation
Inflation Nation | Putting Spring Statement 2022 in context 10
FIGURE 4: Despite strong nominal wage growth, real wages are set to fall until
the end of 2023
Annual growth in average weekly earnings (regular pay) and CPIH inflation, outturn and
projections: GB/UK
+10%
Forecast
+8%
+6%
Nominal
earnings Inflation
+4%
+2%
0%
Real earnings
-2%
-4%
-6%
2002 2004 2006 2008 2010 2012 2014 2016 2018 2020 2022 2024 2026
NOTES: Average weekly earnings growth is year-on-year change in quarterly whole economy average,
regular pay (i.e. excludes bonuses), adjusted for CPIH inflation. Projections apply the OBR’s forecast of
average earnings and CPI inflation. Earnings outturn data covers Great Britain; earnings growth forecast
and all inflation data covers the UK.
SOURCE: RF analysis of ONS, Labour market statistics; OBR, Economic and fiscal outlook, March 2022;
ONS, Consumer price inflation.
By the time real wages start growing again in Q4 2023, earnings will be no higher on
average than they were in 2007, as shown in Figure 5. And even when pay starts growing
again, real wages will not return to their April 2021 peak until Q3 2026, in four-and-a-
half years’ time. By 2027, real wages are set to have grown by just £18 a week since the
financial crisis, compared to £240 a week if they had grown in line with the pre-financial
crisis trend.7
7 For the earnings analysis in this section, we use the outturn for average weekly earnings (AWE) regular pay (i.e. excluding bonuses),
and then apply the OBR’s earnings growth rate to this outturn. This means that we get slightly different pay levels and trends to the
OBR. Notably, our analysis shows real returning to its pre-financial crisis peak sooner than the OBR series – this is because Q1 2008
(when the OBR’s earnings series begins) was a spike in total pay (but not regular pay), meaning that comparing total pay to this
baseline looks relatively pessimistic.
Resolution FoundationInflation Nation | Putting Spring Statement 2022 in context 11
FIGURE 5: Real wages are set to have grown by just £18 a week between 2008
and 2027
Average weekly earnings, adjusted for CPIH inflation (2021-22 prices), outturn and OBR
projections: GB/UK
£600
OBR: March 2020
£550
OBR:
OBR: October 2021 March 2022
£500
£450
£400
2000 2002 2004 2006 2008 2010 2012 2014 2016 2018 2020 2022 2024 2026
NOTES: Average weekly earnings series is whole economy average, regular pay (i.e. excludes bonuses), adjusted
for CPIH inflation. Projections apply the OBR’s forecast of average earnings and CPI inflation to create an inflation
adjusted pay series, which is then used to extrapolate from AWE. Earnings outturn data covers Great Britain;
earnings growth forecast and all inflation data covers the UK.
SOURCE: ONS, Labour market statistics; OBR, Economic and Fiscal Outlook, various; ONS, Consumer price
inflation.
The key judgement underlying this forecast is that only a small rise in unemployment
is needed to pressure workers into accepting a big fall in real wages. The upshot is a
sanguine picture for unemployment but a huge hit to living standards. And, as discussed
below, the main new announcements in the Spring Statement are the Chancellor’s
response to that hit.
The Chancellor has taken steps to cushion the blow of rising prices,
but with a package that does little for low-income households
The Chancellor has responded to the higher inflation with a significant, if poorly targeted,
package of support with a set of measures that do more to improve his (apparent) tax-
cutting credentials than to help the households most affected by the rising cost of living.
The measures taking effect in 2022-23 – which will cost just over £9 billion, just over £8
billion of which is directly supporting households’ living standards – are:
• A substantial increase in the starting point for employee and self-employed
National Insurance (NI) in July 2022, taking the threshold from £9,880 to £12,570
where it will be aligned with the Income Tax personal allowance. Like the Income
Tax personal allowance, it will then be frozen until 2026.8
8 There was also a rise in the Employment Allowance, which lowers some employers’ liability to employer NI; we discuss this
towards the end of this note.
Resolution FoundationInflation Nation | Putting Spring Statement 2022 in context 12
• A one-year reduction in Fuel Duty rates, from 57.95 to 52.95 pence per litre, taking
them to their lowest nominal rate since 2009, and their lowest real rate since 1995. If
passed on in full, this will save a typical household that drives £75 a year, but would
reverse only 13 per cent of the increase in pump prices over the past year.
• A £500 million increase to the discretionary Household Support Fund, extending its
operation into 2022-23.
As a whole, the package of immediate support is significant but very poorly targeted at
those most likely to struggle with the rising cost of living: only £1 in every £3 announced
yesterday will go to the bottom half of the income distribution. This is partly because
the higher NI threshold is of no help to those who are not working or earn less than the
current NI threshold, and partly because the cash gains from the cut in Fuel Duty are
worth more to higher-income households who drive more (55 per cent of the bottom
income decile do not drive). As a result, as Figure 6 shows, middle-income households
gain most as a share of income from the newly-announced measures for 2022-23. The
average gain across the top half of the income distribution is £475, compared to a gain of
just £136 for the poorest fifth of households.9
FIGURE 6: Middle- and higher-income households are the biggest gainers from
the Spring Statement measures announced to deal with the cost of living
Impact on household incomes of policies announced in the Spring Statement and
taking effect in 2022-23, by income vingtile: UK
NI threshold increase Fuel Duty cut Spring Statement policy changes, as a share of income (right axis)
+£600 +1.5%
+£500
+£400 +1.0%
+£300
+£200 +0.5%
+£100
£0 0%
1 2 3 4 5 6 7 8 9 10 11 12 13 14 15 16 17 18 19 20
Poorer ← Net equivalised household income vingtile, after housing costs → Richer
NOTES: We exclude the bottom 5 per cent due to concerns about the reliability of data for this group.
SOURCE: RF analysis of DWP, Family Resources Survey, using the IPPR Tax Benefit Model; ONS, Living
Costs and Food Survey.
9 These figures exclude the impact of the Household Support Fund, as it is not clear who will benefit from this.
Resolution FoundationInflation Nation | Putting Spring Statement 2022 in context 13
These new measures are in addition to support announced in February to ameliorate
April’s rise in the energy price cap (a £150 Council Tax rebate for Band A to D properties,
and a £200 Energy Bills Rebate, to be recouped through higher bills in future years),10
but also come on top of tax rises announced in previous Budgets that take effect in
April (the increase in the rate of NI by 1.25 percentage points, and the freeze to the
Income Tax personal allowance and higher-rate threshold). The impact of this combined
set of changes for 2022-23 look more progressive. As shown in Figure 7, the majority of
households gain from the package to help with April’s energy price cap rise, while higher-
income households lose out significantly from the higher rate of NI and the freeze to
the Income Tax personal allowance and higher-rate threshold. If we consider just the
changes to Income Tax and NI due in 2022-23 and reflect that the NI threshold will not
fall until July, earners on less than £25,000 will gain, and those above will lose from all the
measures being introduced in the next fiscal year (if the NI threshold had fallen in April,
this cut-off point would have risen to £32,000). Overall, the gain for a typical household is
£323 but households in the top half of the income distribution will be worse off by £169
on average.
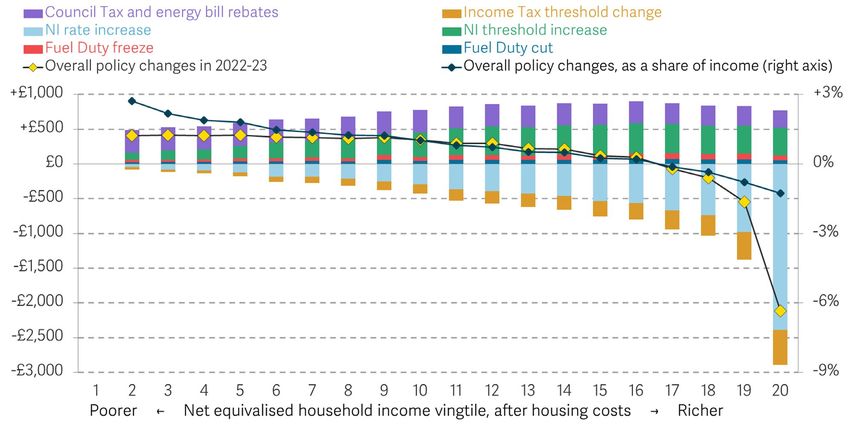
FIGURE 7: Pre-announced tax rises mean that the combined impact of all
changes due to take effect in 2022-23 hit higher-income households harder
Impact on household incomes of policies taking effect in 2022-23, by income vingtile:
UK
NOTES: We exclude the bottom 5 per cent due to concerns about the reliability of data for this group.
National Insurance impact excludes the employer rate.
SOURCE: RF analysis of DWP, Family Resources Survey, using the IPPR Tax Benefit Model; ONS, Living
Costs and Food Survey.
10 A Corlett et al., The price is right? The April 2022 energy price rise and the Government’s response, Resolution Foundation,
February 2022.
Resolution FoundationInflation Nation | Putting Spring Statement 2022 in context 14 With typical energy bills about to rise by £58 a month in April, and with the prospect of a rise of a further £69 a month in October, it is clear from the cash figures in Figure 7 – which shows that the support package is worth around £400 a year for households in most of the vingtiles in the bottom half of the distribution – that the measures announced by the Chancellor are far from adequate for poorer households.11 In particular, it is very surprising that he did nothing to address the £11 billion real terms cut in benefits that will take place in 2022-23, caused by using a lagged measure of inflation. We show later the impact of the Chancellor’s decision on real incomes in 2022-23, but Figure 8 illustrates how three stylised family types could see their incomes change between September 2021 and September 2022. A couple with two earners will see their income fall in real terms over this period, with the higher NI threshold, the support package announced to deal with energy bills and wage growth being not quite sufficient to offset the higher cost of living. For working-age families on UC, income changes since last September will be affected by the expiration of the £20-per-week boost to UC, which left around 6 million families worse off by over a £1,000 per year. For those on UC and in work, though, the cut in the UC taper rate and increase UC work allowances led to higher benefit awards. This can be seen in our example families below, where the extra support from the lower UC taper means that annual income changes constitute a fall of 3 per cent for a single parent working 20 hours a week, but an out-of-work individual reliant on benefits will have a level of income in September 2022 that is almost one-sixth (15 per cent) lower than a year earlier. 11 The OBR has assumed that annual energy bills will rise to £2,800 after the October 2022 price cap change, although these predictions are based on wholesale futures prices from late February and early March when prices were especially elevated following the invasion of Ukraine. Resolution Foundation
Inflation Nation | Putting Spring Statement 2022 in context                                                              15

       FIGURE 8: The support package announced for 2022-23 does nothing to
       support incomes for low-earning and out-of-work individuals
       Family income changes for three example families from September 2021 to September
       2022: UK
                                                                                  Single parent
                                                                                 with one child,           Couple both
                                                    Single person out-
                                                                                working 20 hours         working full-time
     Individual or family circumstance              of-work, renting a
                                                                                per week at a low-        at the median
                                                       shared room
                                                                                 medium wage,                  wage
                                                                                     renting

         September 2021 annual income                             £9,054                       £18,265             £38,065

           End of £20 per week UC boost                           -£1,040                      -£1,040                   £0

   Cost of living rise to September 2022                            -£557                      -£1,198             -£2,648

                            Wage increases                             £0                       +£167              +£1,559

                        Lower UC taper rate                            £0                       +£878                    £0

                           Benefit uprating                         +£99                        +£197                    £0

                            NI rate increase                           £0                         -£9                 -£362

                      Higher NI thresholds                             £0                        +£95                 +£733

                Energy support measures                            +£163                        +£326                 +£326

         September 2022 annual income                              £7,718                      £17,681             £37,672

              Total real change in income                         -£1,336                       -£584                 -£392
                           Total change (%)                          -15%                         -3%                   -1%

       NOTES: Single person renting shared room assumed to only benefit from half of the energy support
       measures. Cost of living rise calculated using OBR forecast inflation for Q3 2022 (including Fuel Duty cut).
       All figures in 2021-22 prices.
       SOURCE: RF Case Study Model.

In addition to the main measures discussed above, the Chancellor did announce some
small changes to reduce our dependence on expensive fossil fuels. Zero-rating VAT on
domestic insulation and clean heat sources will lessen the cost for households with the
means to invest in their homes, but the seven-in-ten of the poorest homeowners who
live in properties with an EPC D rating or below are likely to be excluded,12 and upgrading
homes is unlikely to happen at the pace needed to prevent the four-in-five families living
in the leakiest homes falling into fuel stress as bills rise.13

12 A Corlett and J Marshall, Shrinking Footprints, Resolution Foundation, March 2022
13 A Corlett, L Judge and J Marshall, Higher and Higher, Resolution Foundation, January 2022

Resolution Foundation
Inflation Nation | Putting Spring Statement 2022 in context 16
A surprise Income Tax cut from 2024-25 will be more than offset by
the cumulative impact of frozen personal allowance and higher-rate
thresholds
The Chancellor’s ‘rabbit-out-of-the-hat’ was a 1p cut in the basic rate of Income Tax
(reducing it to 19 per cent) from April 2024.14 This will save an average earner £243 at
that point, and together with the higher NI threshold announced yesterday, represents a
significant give-away to better-off households in that year.
However, these two new tax giveaways are more than offset by the significant tax rises
already announced by the Chancellor for 2024-25, the freeze in Income Tax personal
allowance and higher-rate threshold, and Health and Social Care Levy. The combined
effect in 2024-25 of these personal tax changes announced by Rishi Sunak is shown in
Figure 9: households in the middle of the income distribution will be £535 a year worse
off, but losses among the richest ten percent are above £2,000 a year, over 2 per cent of
disposable income.
FIGURE 9: The cut to the basic rate of tax in 2024-25 is more than offset by
already-announced direct tax rises
Impact on household incomes of direct tax changes taking effect in 2024-25, by income
vingtile: UK
Income Tax threshold change Health and Social Care Levy
NI threshold increase Income Tax cut
Overall policy changes in 2022-23 Combined effect, as a share of income (right axis)
+£2,000 +1%
+£1,000
£0 0%
-£1,000
-£2,000 -1%
-£3,000
-£4,000 -2%
-£5,000
-£6,000 -3%
1 2 3 4 5 6 7 8 9 10 11 12 13 14 15 16 17 18 19 20
Poorer ← Net equivalised household income vingtile, after housing costs → Richer
NOTES: We exclude the bottom 5 per cent due to concerns about the reliability of data for this group.
National Insurance impact excludes the employer rate.
SOURCE: RF analysis of DWP, Family Resources Survey, using the IPPR Tax Benefit Model.
14 This will not apply in Scotland, as many Income Tax parameters are devolved.
Resolution FoundationInflation Nation | Putting Spring Statement 2022 in context 17 These losses are driven by the cumulative impact of the decision to freeze the Income Tax personal allowance and higher-rate threshold at a time when inflation is very high (the high inflation between now and 2024-25 also reduces the generosity of July’s increase in the NI threshold, as that will then be frozen until 2026). Considering Income Tax alone, only those earning between £49,100 and £50,300 pay less tax in 2024-25; considering Income Tax and NI, the only people paying less are those earning between £11,000 and £13,500. Of the around 31 million people in work, around 27 million (86 per cent, on unrounded numbers) will pay more in Income Tax and NI in 2024-25 thanks to changes announced since Rishi Sunak became Chancellor. Overall, the Chancellor’s reforms to Income Tax and NI will, by 2024-25, have succeeded in aligning the point at which people start to pay Income Tax and NI. This is a helpful, if small, simplification to the personal tax system. This new combined threshold will be higher in real-terms than the NI threshold of 2019-20, but lower than the Income Tax personal allowance of 2019-20. What makes less sense is how the rates of these two taxes will have changed, and the implications this has for the rate of tax of different sorts of economic activity. By 2024- 25, the basic rate of Income Tax will have fallen by 1 percentage point, but this will have been more-than-offset by a new 1.25 percentage point Health and Social Care Levy. The combined effect will have been to increase the main rate of tax paid on earned income (by 0.25 percentage points), but to have lowered the main rate of tax on unearned income other than that from dividends (by 1 percentage point). As we argued when the Health and Social Levy was announced, this is not a sensible reform.15 It means that working- age people are more likely to see a higher marginal tax rate than people in retirement on the same level of income; it means a lower tax rate for landlords than most workers; and, when considered with the rise in the employer NI rate announced alongside the Health and Social Levy, it increases the tax distortion in favour of self-employment over employment. Households are set for very large real income falls in 2022-23, to an extent that is unprecedented outside of recessions Even after the measures announced yesterday and discussed above, the outlook for real household incomes is sobering. Using the Real Household Disposable Income measure, the OBR forecasts that average real per person income will be 2.2 per cent lower in 2022- 23 than in 2021-22. This equates to an average fall of £1,200 per household, and is the biggest financial year drop on record (going back to 1956-57). (The OBR notes that the drop would have been around 1 percentage point larger without the rebates and tax cuts 15 T Bell et al., Nationally Insured? New taxes and new spending to address key Department for Health and Social Care priorities, Resolution Foundation, September 2021. Resolution Foundation
Inflation Nation | Putting Spring Statement 2022 in context                                                                      18

announced over the past two months.) On these forecasts, real incomes will not return
to their previous (Q4 2020) peak until Q2 2025 – meaning four-and-a-half years of lost
income growth (see Figure 10).

       FIGURE 10: The OBR forecasts a very large hit to disposable incomes this year,
       which may take years to recover from
       Average Real Household Disposable Income per person: UK

       NOTES: Includes non-profit institutions serving households (NPISH).
       SOURCE: ONS, and OBR, Economic and Fiscal Outlook, various.

These aggregate-based forecasts tell us about average (i.e. mean) household incomes.
But we can zoom in by modelling the effect of economic forecasts and government
policies on disposable incomes (after housing costs) across the income distribution.16
Based on the OBR’s new forecasts for inflation, pay, housing costs and more, and looking
at non-pensioner household incomes,17 we project that the typical real income will be 4
per cent lower in 2022-23 than in 2021-22: a fall of £1,100.18 This would be the worst hit to
living standards since 1975, as Figure 11 shows. We project a further fall in working age
incomes in 2023-24 (of 2 per cent), leaving typical household incomes £1,500 lower than
in 2021-22. There is some recovery beyond 2023-24, however, with projected growth of 2
per cent in 2024-25 – aided by the new Income Tax cut.

16 For more information on our approach, see: A Corlett & L Try, The Living Standards Outlook 2022, March 2022, Resolution
   Foundation.
17 Our modelling focuses on non-pensioner incomes due to the added complexities of predicting future private pension income, for
   example.
18 This compares to a very similar forecast of 4 per cent in A Corlett & L Try, The Living Standards Outlook 2022, March 2022,
   Resolution Foundation. The new National Insurance threshold rise (which boosts incomes) is offset by an even-higher inflation
   forecast and large increases in mortgage interest costs (which are projected to rise by 60 per cent – from a low base – between
   2021-22 and 2023-24), among other factors. The change in mortgage costs is also an important cause of the difference between
   this after housing costs income projection and the OBR’s RHDI forecast (which deals with housing costs in different ways), with
   mortgagors facing the largest typical income falls of any tenure group in 2022-23.

Resolution Foundation
Inflation Nation | Putting Spring Statement 2022 in context 19
FIGURE 11: Despite the Chancellor’s announcements, 2022-23 is still projected
to deliver the biggest hit to typical household incomes since the mid-1970s
Annual real growth in median equivalised household disposable income for non-
pensioners, after housing costs: GB/UK
+12%
+10%
+8%
+6%
+4%
RF projection
+2%
0%
-2%
-4%
-6%
1962 1966 1970 1974 1978 1982 1986 1990 1994- 1998- 2002- 2006- 2010- 2014- 2018- 2022- 2026-
95 99 03 07 11 15 19 23 27
NOTES: Projections after 2019-20. Data source changes in 1994-95. GB from 1994-95 to 2001-02. See A
Corlett & L Try, The Living Standards Outlook 2022, March 2022, Resolution Foundation for details of our
projection methodology.
SOURCE: RF analysis of DWP & IFS, Households Below Average Income; and RF projection including use of
the IPPR Tax Benefit Model, ONS data, and OBR forecasts.
Looking beyond the median, Figure 12 sets out projected growth for non-pensioner
households of all income levels in each year. In fact, the change in income at the median
gives an optimistic impression of what is likely to happen next year, with changes at other
income levels generally even worse. The greatest hit is for those on the lowest incomes,
with the average real income of the bottom quarter falling by 6 per cent relative to 2021-
22. This can be ascribed to the large gap between inflation (over 8 per cent) and this
April’s benefit uprating (3.1 per cent), together with the fact that incomes in 2021-22 were
partially supported by the £20 a week benefit boost which has now been withdrawn, as
well as other ongoing reductions in the generosity of the social security system (with no
increases in the benefit cap or Local Housing Allowances, for example).
Resolution FoundationInflation Nation | Putting Spring Statement 2022 in context 20
FIGURE 12: The lowest-income households are set to see the greatest income
falls in 2022-23
Annual real growth in average equivalised household disposable income for non-
pensioners, after housing costs, by income vingtile: UK
Growth for the 2nd poorest
+10%
20th of the population
+8%
+6%
+4% Growth for the
richest 20th of
the population
+2%
0%
-2%
-4%
-6%
-8%
2020- 2021- 2022- 2023- 2024- 2025- 2026-
21 22 23 24 25 26 27
NOTES: We exclude the bottom 5 per cent due to concerns about the reliability of data for this group. See
A Corlett & L Try, The Living Standards Outlook 2022, March 2022, Resolution Foundation for details of our
projection methodology.
SOURCE: RF projection including use of the IPPR Tax Benefit Model, ONS data, and OBR forecasts.
Among working age households where no-one is currently earning, typical income is
projected to fall by 8 per cent in 2022-23. It should also be noted that this modelling is
likely to understate the impact of the higher cost of living on low-income households in
2022-23 because we assume a single, shared rate of inflation for all households; in reality,
the critical role of energy costs in driving inflation in the next few months means that
prices are set to rise fastest for the poorest.19 In 2023-24, incomes are generally forecast
to shrink less rapidly for poorer households than the top half of the income distribution,
due to benefits rising by (an expected) 7.5 per cent: this would be above inflation in that
year, but would simply reflect the value of benefits catching up with the previous year’s
price increases.
Although the projected income falls in 2022-23 are large, they would clearly have been
even larger in the absence of policy interventions. As Figure 13 shows, without the
policies announced at the Spring Statement and in February, typical incomes may have
fallen by around 6 per cent, and the income fall for the poorest could have been as large
as 9 per cent.20 Policy has, therefore, offset around a third (34 per cent) of the potential
19 See: T Waters, Pay, prices and policy, Institute for Fiscal Studies, March 2022. The OBR breaks down the components of inflation in
Chart 2.7 of OBR, Economic and Fiscal Outlook – March 2022, OBR March 2022.
20 We do not include the impact of the Fuel Duty reduction here. However, we estimate that this only reduces CPI inflation by around
0.1 percentage points in 2022-23; indeed, the OBR estimates that the Spring Statement policy package acted to increase inflation
overall (by around 0.1 percentage points in 2022-23) as a result of increased demand.
Resolution FoundationInflation Nation | Putting Spring Statement 2022 in context 21
shock for the poorer half of the population (with the £350 fuel bill rebates announced
in February being more important than the NI threshold increase announced yesterday
for this group), and policy has offset around a fifth (22 per cent) of the hit to the higher-
income half, with the NI cut being the more important intervention there. Figure 13 also
shows how much of the potential income fall would have been attributable to the NI
rate rise, with policy changes more than cancelling out the impact of the rate rise for the
bottom half.
FIGURE 13: Recent policy changes have offset one third of the income shock
that would have faced the poorer half of the population in 2022-23
Projected and counterfactual real growth in average annual equivalised household
disposable income for non-pensioners, after housing costs, by income vingtile, 2022-23:
UK
0%
-1%
-2%
-3%
-4%
-5%
-6%
-7%
Offset by Council Tax / Energy Bills rebates
-8%
Offset by National Insurance threshold rise
-9%
Outstanding projected income fall, due to tax rises
-10%
Outstanding projected income fall, excluding tax rises
-11%
1 2 3 4 5 6 7 8 9 10 11 12 13 14 15 16 17 18 19 20
Poorer ← Net equivalised non-pensioner household income vingtile, after housing costs → Richer
NOTES: We exclude the bottom 5 per cent due to concerns about the reliability of data for this group. See
A Corlett & L Try, The Living Standards Outlook 2022, March 2022, Resolution Foundation for details of our
projection methodology. ‘Tax rises’ refers to the NI rate rise and the Income Tax threshold freeze, and shows
what the impact would have been without any changes to the NI threshold.
SOURCE: RF projection including use of the IPPR Tax Benefit Model, ONS data, and OBR forecasts.
On current projections, this would be the weakest Parliament for
living standards growth on record
Although incomes are forecast to grow in 2024-25 (aided by the Income Tax cut) and
future years (driven by growing real wages), the outlook over the next few years taken
together is very poor. Across the distribution, real incomes are projected to be lower in
2026-27 (the end of the OBR’s forecast window) than in 2021-22, meaning at least half a
decade of lost living standards growth. If we look at the approximate (expected) period
Resolution FoundationInflation Nation | Putting Spring Statement 2022 in context 22
between general elections, from 2019-20 to 2024-25, income growth is also projected to
be negative across the distribution: the typical non-pensioner income is projected to be
2 per cent lower in 2024-25 than five years earlier. As Figure 14 shows, such an outcome
would make this the worst parliament on record for living standards growth (the typical
income fell by 1 per cent between 2005-06 and 2010-11, for example).
FIGURE 14: The five years from 2019-20 to 2024-25 are currently projected to be
the worst parliament ever for changes in household incomes
Total real growth in median equivalised household disposable income per period for
non-pensioners, after housing costs, by income vingtile: GB/UK
+40%
+35%
+30%
+25%
+20%
Growth for the
+15% richest 20th of
the population
+10%
+5%
0%
Growth for the 2nd
-5%
poorest 20th of the
population
-10%
1966 to 1970 to 1974 to 1979 to 1983 to 1987 to 1992 to 1997-98 2001-02 2005-06 2010-11 2015-17 2019-20
1970 1974 1979 1983 1987 1992 1997-98 to 2001- to 2005- to 2010- to 2015- to 2019- to 2024-
02 06 11 16 20 25
NOTES: We exclude the bottom 5 per cent due to concerns about the reliability of data for this group. See
A Corlett & L Try, The Living Standards Outlook 2022, March 2022, Resolution Foundation for details of our
projection methodology. Some periods are four years long and others five years. The chosen time periods
correspond to the years of past general elections (plus 2024), but we do not include a division for the 2017
election and nor do we try to estimate growth over the February to October parliament of 1974.
SOURCE: RF analysis of DWP & IFS, Households Below Average Income; and RF projection including
use of the IPPR Tax Benefit Model, ONS data, and OBR forecasts.
The same outcome is found with the OBR’s Real Household Disposable Income forecast
(shown earlier in Figure 10). Using that different measure (and even ignoring an under-
performance in the ONS’s outturn data), the mean real income per person is forecast to
be 0.4 per cent lower in Q2 2024 than in Q4 2019: the worst growth rate over a parliament
(both overall and per year) since at least the start of this series in 1955 (indeed, on this
measure this would be the only parliament to record a fall in average real income).
The weak income forecast, and the particularly weak short-term outlook for the poorest
households, is also reflected in our projections for absolute poverty. The historic norm
is for absolute poverty rates to fall over time, but our modelling points to an increase in
2021-22 (reversing falls produced by benefit increases in 2020-21); a further large rise in
Resolution FoundationInflation Nation | Putting Spring Statement 2022 in context 23
2022-23; and little progress thereafter (see Figure 15). As the Chancellor has not opted to
additionally increase benefits this year, the number of people living in absolute poverty
is projected to rise in 2022-23 by 1.3 million, including 500,000 children. Small falls are
projected after 2023-24, but this would still leave the share of people and children in
absolute poverty higher in 2026-27 than in 2019-20. (Relative child poverty, meanwhile, is
projected to rise to rates not seen since the record-breaking 1990s, with 33 per cent of
children living in relative poverty by 2026-27.)
FIGURE 15: Absolute poverty is likely rising, and no progress is expected over
this parliament as a whole
Proportion of people/children living in absolute poverty, after housing costs: GB/UK
100% 100%
All Children
80% 80%
Outturn Outturn
60% 60%
40% 40%
20% 20%
RF projection
RF projection
0% 0%
1961 1969 1977 1985 1993- 2001- 2009- 2017- 2025- 1961 1969 1977 1985 1993- 2001- 2009- 2017- 2025-
94 02 10 18 26 94 02 10 18 26
NOTES: Data source changes in 1994-95. GB prior to 2001-02. See A Corlett & L Try, The Living Standards
Outlook 2022, March 2022, Resolution Foundation for details of our projection methodology.
SOURCE: IFS, Living standards, poverty and inequality in the UK; RF analysis of DWP, Households Below
Average Income; and RF projection including use of the IPPR Tax Benefit Model, ONS data, and OBR
forecasts.
Higher inflation will reduce the spending power of government
departments
Although the OBR projects CPI to peak at 8.7 per cent in 2022-23, the fact that this is
driven by imported goods – particularly oil and gas – means that inflation is set to have
a much smaller impact on the real value of public spending than some had feared. In
particular, the OBR projects GDP deflator inflation to be half the rate of CPI inflation: just
4 per cent in 2022-23. This means that the generosity of the Chancellor’s spending plans –
outlined in the Spending Review in October – are reduced but not hugely so. As shown in
Figure 16, the 3.3 per cent annualised real increase in total (non-Covid related) day-to-day
Resolution FoundationInflation Nation | Putting Spring Statement 2022 in context 24
spending planned between 2021-22 and 2024-25, has fallen to 2.9 per cent: amounting to
just over £5 billion of lost spending in 2021-22 prices. Similarly, inflation will contribute to
a reduced growth in capital spend from an annualised rate of 1.9 per cent to 1.5 per cent.
So, if inflation does not become domestically ingrained, then both current and capital
spend are set to grow in real terms over the next three years.
FIGURE 16: Inflation means that the day-to-day increase in government
spending will be slightly smaller
Annual average change in real (2021-22 terms) RDEL and CDEL as detailed at each fiscal
event: UK
+15%
+15%
Real RDEL growth Real CDEL growth
+10%
+9%
+7% +6%
+5%
+5% +4%
+4% +4%
+3% +3% +3%
+1% +3%
+2% +1%
+2% +2% +1%
0%
-2% -1%
-3%
-5%
-8%
-10%
SR 2000 SR 2002 SR 2004 CSR SR 2010 SR 2013 SR 2015 SR 2019 SR 2020 SR 2021 SS 2022
2007
NOTES: Values are deflated by contemporaneous deflators. In 2007 there was a Comprehensive Spending
Review.
SOURCE: RF analysis of HMT, PESA Tables, various, Spending Review 2021 and Spring Statement 2022;
OBR, Economic and Fiscal Outlook, various.
This modest impact on the overall level of real public spending means that the big
increases in funding for health and social care are projected to be largely maintained.
Figure 17 charts the real change in the Department of Health and Social Care resource
budget from 2008-09 to 2024-25. It shows that the higher level of domestic inflation
reduces the large increase in the health budget by only £2 billion in 2022-23. And, at £15
billion, this increase remains the largest seen in recent years.
Just as departments expecting real-term increases in their budgets after the Spending
Review should continue to do so, so department that were facing real-term falls also face
modestly larger falls. In particular, with no new funding made available, real day-to-day
spending on defence will decline by 5.7 per cent between 2021-22 and 2024-25 (a larger fall
than the 4.3 per cent decline expected in October).
Resolution FoundationInflation Nation | Putting Spring Statement 2022 in context 25
FIGURE 17: Real spend for DHSC in 2022-23 will be £2 billion smaller than
expected at the 2021 Spending Review
Real (2021-22 terms) change in Department of Health and Social Care budget, historical
and projected: UK, 2008-09 to 2024-25
+£20bn
Spending Review projection additional spend
Spring Statement projection
Historical
+£15bn
+£10bn
+£5bn
£0
-£5bn
-£10bn
2008- 2009- 2010- 2011- 2012- 2013- 2014- 2015- 2016- 2017- 2018- 2019- 2020- 2021- 2022- 2023- 2024-
09 10 11 12 13 14 15 16 17 18 19 20 21 22 23 24 25
SOURCE: RF analysis of HMT, PESA Tables, various; Spending Review 2021; and OBR, Economic and Fiscal
Outlook, October 2021 and March 2022.
These modest changes to projected real government spending are predicated on
domestically generated inflation remaining significantly lower than CPI. Given that
almost half of departmental resource spending relates to staff pay, the fact that public
sector pay is rising much more gradually than pay in the private sector may mean that
this is a reasonable expectation in the short term. However, given the legacy of the past
decade of pay restraint, and the ambition announced in the Spending Review that “public
sector pay growth over the next three years should retain broad parity with the private
sector”,21 upward pressures may be significant.
Supply bottlenecks are expected to reduce public sector investment
levels
Capital spending is a key part of the Government’s overall strategy to generate higher
productivity and economic growth. However, given major supply bottlenecks in the
economy and globally, the OBR has revised down actual capital spending in 2021-22
and 2022-23. These revisions reflect both the £8.4 billion reduction in 2021-22 CDEL
that departments have agreed, as well as supply bottlenecks impacting the ability
of departments to deliver on investment plans in 2022-23. Together with reductions
in anticipated calls on Covid-related loan schemes, these leave public sector net
21 HM Treasury, Spending Review 2021,, October 2021.
Resolution FoundationInflation Nation | Putting Spring Statement 2022 in context 26
investment (PSNI) £20 billion lower in 2021-22, and £10 billion lower in 2022-23, than
forecast in October. As a result, PSNI is set to fall to 1.6 per cent of GDP in 2021-22, before
rising to 2.5 per cent by the end of the forecast (see Figure 18). This leaves the Chancellor
with greater headroom to increase investment and remain within his 3 per cent of GDP
cap on investment. In 2021-22 cash terms, this headroom amounts to a total of £60 billion
over 5 years from 2022-23 to 2026-27.
FIGURE 18: Supply chain disruptions mean public sector investment will be
more volatile than previously forecast
Public Sector Net Investment (PSNI) as a proportion of GDP, outturn and projected: UK,
1948-49 to 2026-27
+9%
+8%
+7%
Outturn
+6%
+5%
+4%
OBR (Oct 2021)
+3%
+2%
OBR (Mar 2022)
+1%
0%
-1%
1948- 1953- 1958- 1963- 1968- 1973- 1978- 1983- 1988- 1993- 1998- 2003- 2008- 2013- 2018- 2023-
49 54 59 64 69 74 79 84 89 94 99 04 09 14 19 24
SOURCE: RF analysis of OBR, Economic and Fiscal Outlook, October 2021; ONS, Public Sector Finances;
OBR, Economic and Fiscal Outlook, October 2021 and March 2022.
Despite the challenges for households’ finances, the government
finances have improved
As with households, government finances are substantially affected by rising inflation.
But the most important public-finance story emerging from the Spring Statement is
the surprisingly rapid increase in tax revenues. As shown in Figure 19, government
receipts in 2021-22 are now projected to be £38 billion higher than expected in October.
This represents the second-largest-ever increase in revenue in the first year of a fiscal
forecast, following hot on the heels of the largest on record which occurred in the
previous OBR forecast.22 This huge improvement in tax revenues is expected to persist
throughout the forecast.
22 This is measured by changes in public sector current receipts forecasts, with comparable data going back to November 1990.
Resolution FoundationYou can also read